16 marks
On separate diagrams, sketch the graphs of:
(i) for
(ii) for
(iii) for
Was this exam question helpful?
Exam code: 9709
On separate diagrams, sketch the graphs of:
(i) for
(ii) for
(iii) for
Was this exam question helpful?
Sketch the graph of for .
Was this exam question helpful?
(i) Write down the maximum value of , where .
(ii) Write down the minimum value of , where .
Was this exam question helpful?
The point has coordinates and lies on the graph of , where and .
Write down the coordinates of the image of point under each of the following transformations:
(i)
(ii)
(iii)
Was this exam question helpful?
Solve for .
Was this exam question helpful?
The diagram shows the graph of for .
By adding a suitable straight line to the graph, show that the equation has four solutions in the interval .

Was this exam question helpful?
Sketch the graph of for .
Was this exam question helpful?
Given that , write each of the following as an expression involving the cosine function.
(i)
(ii)
Was this exam question helpful?
Solve for .
Was this exam question helpful?
(i) On the same set of axes, sketch the graphs of and in the interval . Show clearly the coordinates of all points of intersection with the coordinate axes.
(ii) Deduce the number of solutions to the equation in the interval .
Was this exam question helpful?
(i) Sketch the graph of in the interval . The sketch must include the coordinates of all points where the graph meets the coordinate axes.
(ii) Given that , use your graph to find all other values of in the given interval for which .
Was this exam question helpful?
(i) Describe geometrically the transformation that maps the graph of onto the graph of .
(ii) On the graph of , a point has coordinates . State the new coordinates of point after the transformation to . Leave your answer in surd form.
Was this exam question helpful?
(i) Sketch the graph of in the interval . The sketch must include the coordinates of all points where the graph meets the coordinate axes.
(ii) Write down all the values of for which for .
Was this exam question helpful?
(i) Sketch the graph of in the interval . The sketch must include the coordinates of all points where the graph meets the coordinate axes.
(ii) Given that , use your graph to find another value of in the given range for which .
Was this exam question helpful?
By sketching an appropriate graph, find all the solutions of in the interval .
Was this exam question helpful?
(i) Sketch the graph of in the interval .
(ii) Write down all the values where in the given interval.
Was this exam question helpful?
On the same set of axes, sketch the graphs of the following functions:
(i) in the interval
(ii) in the interval
The sketch must include the coordinates of all points where the graphs meet the coordinate axes. Also state the periodicity of each function.
Was this exam question helpful?
(i) On the same set of axes, sketch the graphs of and in the interval , giving the coordinates of all points of intersection with the coordinate axes.
(ii) State the coordinates of any points where the graphs intersect.
Was this exam question helpful?
The graph shows the curve with equation in the interval .

A student states that the curve could also have equation .
Is the student correct? You must give a reason for your answer.
Give the coordinates of all points of intersection with the coordinate axes within the interval.
Give another example of an equation that would also produce the same curve.
Was this exam question helpful?
The graph shows the curve with equation in the interval .
Point has coordinates and is the minimum point closest to the origin. Point is the maximum point closest to the origin.
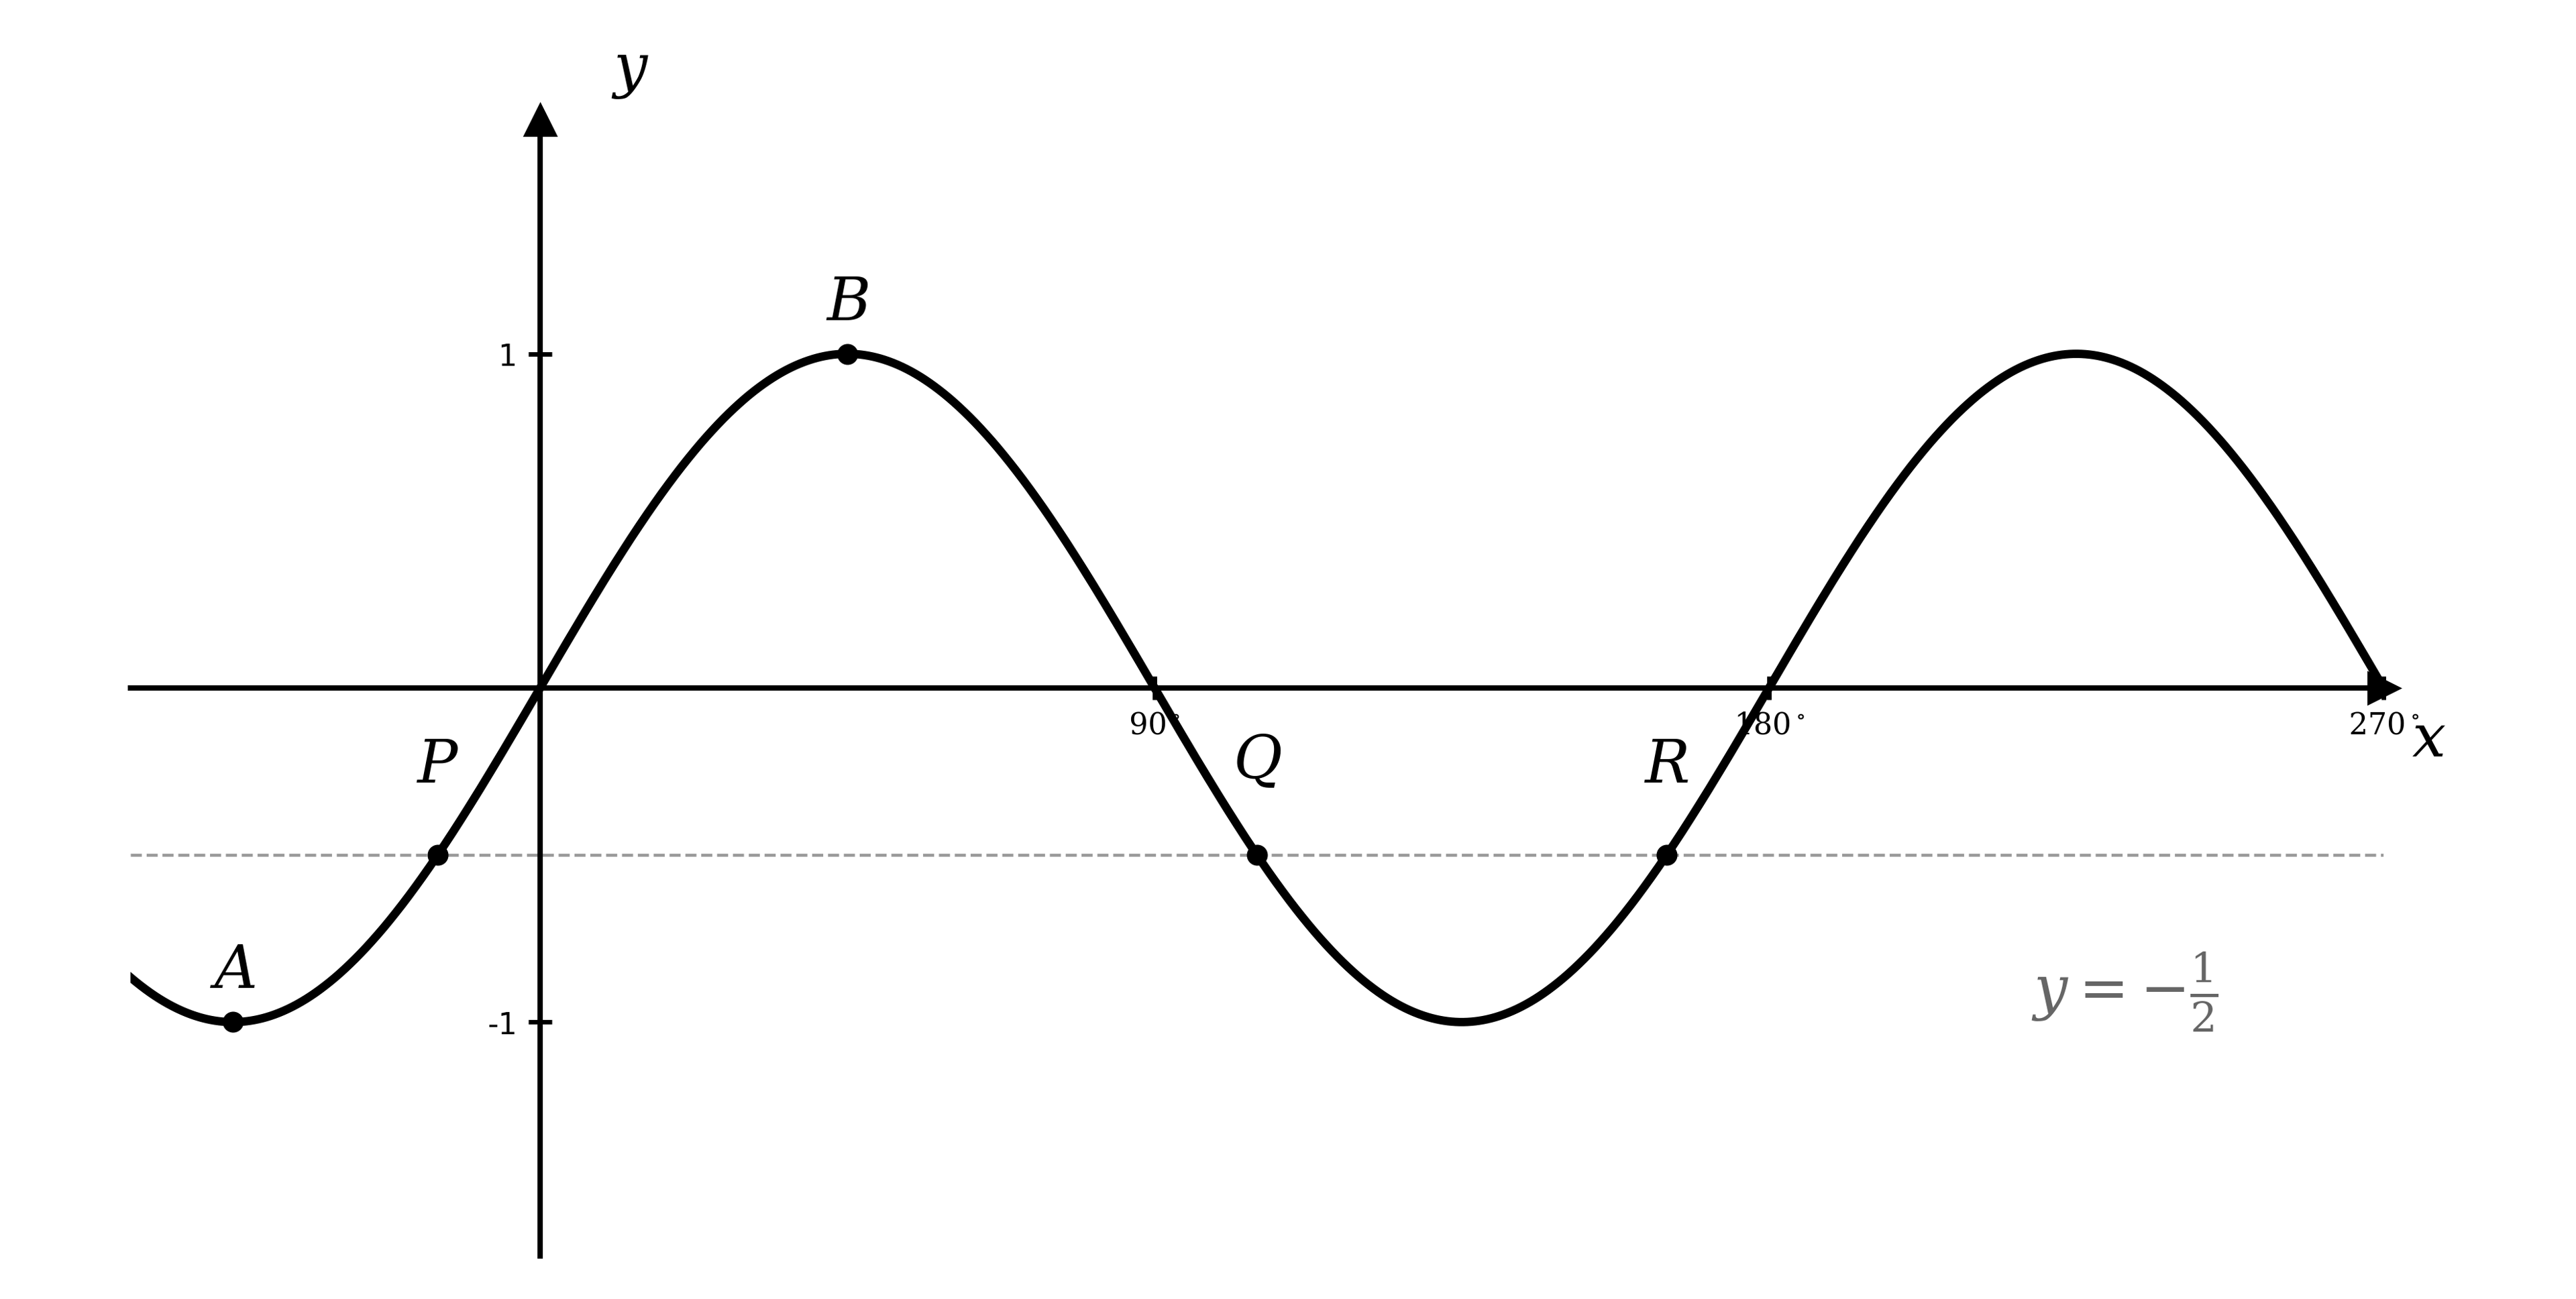
State the coordinates of .
A straight line with equation meets the graph of at the three points , and , as shown in the diagram.
Given that point has coordinates , use graph symmetries to determine the coordinates of and .
Was this exam question helpful?
(i) Describe geometrically the transformation that maps the graph of onto the graph of .
(ii) On the graph of , a point has coordinates . State the new coordinates of point after the transformation to .
Was this exam question helpful?
(i) Describe geometrically the transformation that maps the graph of onto the graph of .
(ii) On the graph of , a point has coordinates . State the new coordinates of point after the transformation to .
Was this exam question helpful?
A section of a new rollercoaster has a series of rises and falls. The vertical displacement of the rollercoaster carriage, , measured in metres relative to a fixed reference height, can be modelled using the function , where is the time in seconds.
(i) Sketch the function for the interval .
(ii) How many times will the rollercoaster carriage fall during the 30 seconds?
(iii) How long does the model suggest it will take for the rollercoaster carriage to reach the bottom of the first fall?
Was this exam question helpful?
Sketch the graph of in the interval . The sketch must include the coordinates of all points where the graph meets the coordinate axes.
Given that , use your graph to find all other values of in the given interval for which .
Was this exam question helpful?
(i) Sketch the graph of in the interval . The sketch must include the coordinates of all points where the graph meets the coordinate axes.
(ii) Given that , use your graph to find all values of in the given interval for which .
Was this exam question helpful?
Sketch the graph of in the interval .
Write down all the values of for which in the given interval.
Was this exam question helpful?
On the same set of axes, sketch the graphs of and in the interval .
The sketches must include the coordinates of all points where the graphs meet the coordinate axes. In each case state the periodicity of the function.
Was this exam question helpful?
(i) On the same set of axes, sketch the graphs of and in the interval . State the coordinates of all points of intersection with the coordinate axes and of maximum and minimum points where appropriate.
(ii) Verify that is a solution to the equation . Hence, using your sketch from part (i) or otherwise, find all other solutions to the equation in the interval .
Was this exam question helpful?
The graph shows a curve with equation , , where is a constant.

A student states that there is only one possible value for . Explain why the student is incorrect, stating at least two possible values for .
Give the coordinates of all points of intersection with the -axis in the given interval.
Was this exam question helpful?
The graph shows a curve with equation in the interval .

Points and are the stationary points closest to the origin. State the coordinates of and .
A straight line with equation meets the graph at three points, , and . Determine the coordinates of , and .
Was this exam question helpful?
Changes in the depth of water in a small tidal estuary relative to a fixed reference depth can be modelled using the function , where is measured in metres and is the time in hours.
(i) Sketch the function for the interval .
(ii) If represents 2pm, during what times, to the nearest half hour, will the estuary be at or above the halfway point between and its maximum depth?
Was this exam question helpful?
A series of dips and mounds caused by underground mining has a cross-section which can be modelled using the function , where and are respectively the horizontal and vertical displacements, in metres, from a fixed origin point.
(i) Sketch the function for the interval and state the periodicity of the model.
(ii) How many dips are in this model in the given interval?
Was this exam question helpful?
(i) On the same set of axes, sketch the graphs of and in the interval . Show clearly the coordinates of all points of intersection with the coordinate axes.
(ii) Deduce the number of solutions to the equation , in the interval .
Was this exam question helpful?
By sketching an appropriate graph, find all the solutions to in the interval .
Was this exam question helpful?
(i) On the same set of axes, sketch the graphs of and in the interval . Label the axes appropriately to show all points of intersection between the graphs and the coordinate axes.
(ii) State the periodicity of each function.
Was this exam question helpful?
On the same set of axes, sketch the graphs of and in the interval . Label the coordinates of points of intersection with the coordinate axes and of maximum and minimum points where appropriate.
Find the solution to the equation within the interval . Hence, determine the coordinates of the corresponding point of intersection between the two graphs in part (a).
Was this exam question helpful?
On the same set of axes, sketch the graphs of and in the interval . Label the coordinates of points of intersection with the coordinate axes.
Within the interval , determine the coordinates of the two points where . Give your answer in surd form.
Was this exam question helpful?
The graph shows part of the curve with equation , where is a constant.

A student states that there are an infinite number of possible values for . Is the student correct? You must explain your answer fully.
Another student claims that the curve could also be the graph of the equation . Find a value for to show that the student is correct.
Was this exam question helpful?
The graph shows two curves with equations and , in the interval , where and are integers.

Using the graph above, find the values of and and label or list the points of intersection each graph has with the coordinate axes.
Within the stated interval, the curves intersect at the two points and as shown in the diagram. The coordinates of point are , accurate to 2 decimal places. By considering the graph, as well as the properties of the sine and cosine functions, state the coordinates of point , to two decimal places.
Was this exam question helpful?
(i) Describe geometrically the transformation that maps the graph of onto the graph of .
(ii) On the graph of , a point has coordinates . State the new coordinates of point after a transformation onto each of the graphs in part (i). Give your answers in surd form.
Was this exam question helpful?
Describe geometrically the transformation that maps the graph of onto the graph of .
On the same set of axes, sketch both graphs in the interval . Label the coordinates of any points of intersection between the two graphs.
Was this exam question helpful?
A function , , first crosses the -axis at .
(i) Determine the value of and sketch the graph of .
(ii) State the period of .
Was this exam question helpful?