Chemical Change & Rate of Reaction (Cambridge (CIE) IGCSE Combined Science: Chemistry): Exam Questions

Exam code: 0653

29 mins5 questions
1
1 mark

Which statement explains how a catalyst increases the rate of a chemical reaction?

  • It increases the energy of the particles in the reaction mixture.

  • It increases the minimum energy that colliding particles must have to react.

  • It reduces the energy of the particles in the reaction mixture.

  • It reduces the minimum energy that colliding particles must have to react.

2a
2 marks

Iron reacts with dilute hydrochloric acid to form hydrogen and a salt.

(i) Explain why this is a chemical change.

[1]

(ii) State the test for hydrogen and give the observation for a positive result.

test .................................................

observation .....................................

[1]

2b
2 marks

Iron is used as a catalyst in some chemical reactions.

Describe what is meant by a catalyst.

3
4 marks

Calcium carbonate reacts with dilute hydrochloric acid to produce calcium chloride.

(i) State the names of the other two products in this reaction.

[2]

(ii) The rate of this reaction can be increased by increasing the temperature of the hydrochloric acid.

Explain why.

Use ideas about particle collisions and energy in your answer.

[2]

4
11 marks

Procedure

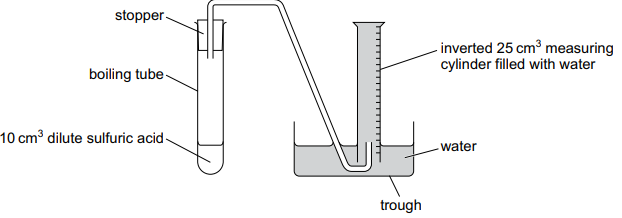
  • Set up the apparatus as shown in Fig. 3.1.

Diagram of gas collection: boiling tube with stopper connected by delivery tube to inverted 25 cm³ measuring cylinder over water in a trough, held by clamp.

Fig. 3.1

  • Use the 10 cm3 measuring cylinder to measure 10 cm3 of dilute sulfuric acid.

  • Remove the stopper from the boiling tube.

  • Add the dilute sulfuric acid to the boiling tube.

  • Add about 1 cm3 of aqueous copper(II) sulfate to the boiling tube.

  • Add a spatula of metal F to the boiling tube.

  • Put the stopper back into the boiling tube and start the stop-watch.

(i) Record in Table 3.1 the time taken to collect 5 cm3 , 10 cm3 , 15 cm3 , 20 cm3 and 25 cm3 of gas.

Record each time to the nearest second.

Table 3.1

volume of gas collected  / cm3

time taken  / s

5

10

15

20

25

[3]

(ii) State the independent variable and the dependent variable in this investigation.

independent variable ......................................................................................................... dependent variable ............................................................................................................

[1]

(iii) On the grid, plot a graph of volume of gas collected (vertical axis) against time taken.

Square sheet of fine graph paper with dense, evenly spaced black grid lines forming many small squares across the entire white page

[3]

(iv) Draw the line of best fit.

[1]

(v) Describe the relationship between the volume of gas collected and the time taken.

[1]

(vi) Suggest one possible source of error in the measurement of the time taken.

[1]

(vii) Suggest one way to obtain a more accurate measurement of the volume of gas collected.

[1]
5
9 marks

Procedure

The student:

  • uses a measuring cylinder to measure 10 cm3 of dilute sulfuric acid

  • adds the dilute sulfuric acid to a boiling tube

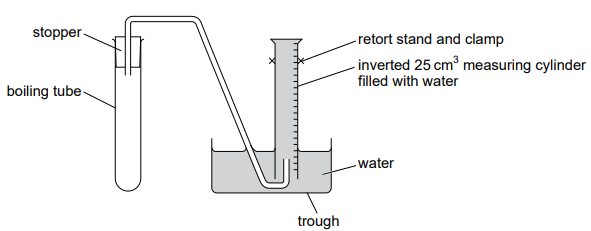
  • sets up apparatus as shown in Fig. 3.1

Diagram of gas collection: boiling tube with 10 cm³ dilute sulphuric acid and stopper, delivery tube into water trough, gas captured in inverted 25 cm³ cylinder

Fig. 3.1

  • removes the stopper from the boiling tube

  • adds one spatula of metal F to the boiling tube

  • puts the stopper back into the boiling tube and starts the stop-watch

  • records in Table 3.1 the time taken to collect 5 cm3 , 10 cm3 , 15 cm3 , 20 cm3 and 25 cm3 of gas.

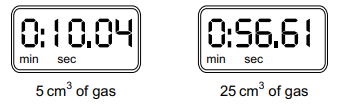
(i) Fig. 3.2 shows the stop-watch readings for 5 cm3 and 25 cm3 of gas collected.

Two digital timers show 10.04 s for 5 cm³ of gas and 56.61 s for 25 cm³ of gas, labelled with “min sec” under each display

Fig.3.2

Record in Table 3.1 the time taken to the nearest second to collect 5 cm3 and 25 cm3 of gas.

Table 3.1

volume of gas collected / cm³

time taken / s

5

10

22

15

34

20

46

25

[2]

(ii) State the independent variable and the dependent variable in this investigation.

[1]

(iii) On the grid, plot a graph of volume of gas collected (vertical axis) against time taken.

Dense black-and-white grid of tiny uniform squares forming a full page of graph paper with thin lines and a narrow border around the edges

[3]

(iv) Draw the line of best fit.

[1]

(v) Describe the relationship between the volume of gas collected and the time taken.

[1]

(vi) Suggest one possible source of error in the measurement of the time taken.

[1]

(vii) Suggest one way to obtain a more accurate measurement of the volume of gas collected.

[1]