11 mark
Which of the following is a vector quantity?
Density
Force
Mass
Speed
Was this exam question helpful?
Exam code: 4XSD1
Which of the following is a vector quantity?
Density
Force
Mass
Speed
Was this exam question helpful?
Which of the following is a scalar quantity?
Acceleration
Energy
Momentum
Velocity
Was this exam question helpful?
The diagram shows the driving force on a sports car as it moves along a race track.

Name two forces that oppose the driving force.
The car has a mass of 1400 kg.
The acceleration of the car is 5.5 m/s2.
(i) State the equation linking force, mass and acceleration.
[1]
(ii) Calculate the force causing this acceleration.
[2]
force = ............................................... N
Was this exam question helpful?
A student investigates the motion of different falling masses by measuring the time taken for empty cupcake cases to fall from a window.

The student drops one case from the window.
He repeats the experiment with two cases stuck together, then with three cases and then with four.
Name two measuring instruments that he would need for his investigation.
State the dependent and independent variables in this investigation.
State one factor that the student should keep constant in order to make this investigation valid (a fair test).
The student draws this table to record his results.
Add suitable headings to his table.

State one way that the student can improve his investigation.
The student notices that the cases accelerate and then fall at constant speed.
(i) The arrows in the diagrams show the size and direction of the forces acting on a case at different points in its fall. Label the forces on the middle diagram.
[2]
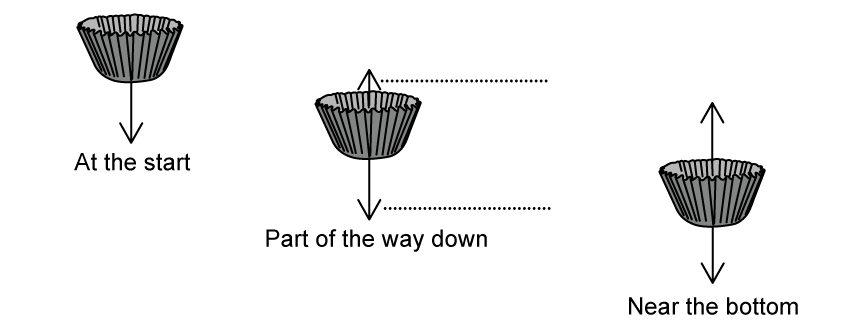
(ii) Explain why the case accelerates and then falls at constant speed.
[3]
Was this exam question helpful?
When an object falls at terminal velocity
it accelerates at 10 m/s2
it has no weight
the resultant vertical force is downwards
the vertical forces on it are balanced
Was this exam question helpful?
The student puts a pile of 400 sheets of paper on a table.
He uses a ruler to measure the height of the pile.

The student records the thickness of the pile as 4.1 cm.
This means that the thickness of one piece of paper is about
1 cm
1 mm
0.1 mm
0.01 mm
Was this exam question helpful?
The diagram shows a man pulling a child on a sledge.

The acceleration of the sledge is 1.5 m/s2. The mass of the child and sledge is 38 kg.
(i) State the equation linking force, mass and acceleration.
[1]
(ii) Calculate the force needed to produce this acceleration.
[2]
force = ............................................... N
(iii) Suggest a reason why the force exerted on the sledge by the man must be greater than the force calculated.
[1]
The sledge starts from rest and accelerates at 1.5 m/s2 until its velocity is 2.8 m/s.
(i) State the relationship between acceleration, velocity and time.
[1]
(ii) Show that the time taken to reach 2.8 m/s is about 2 s.
[2]
This velocity-time graph shows the motion of the sledge as it travels down a hill.
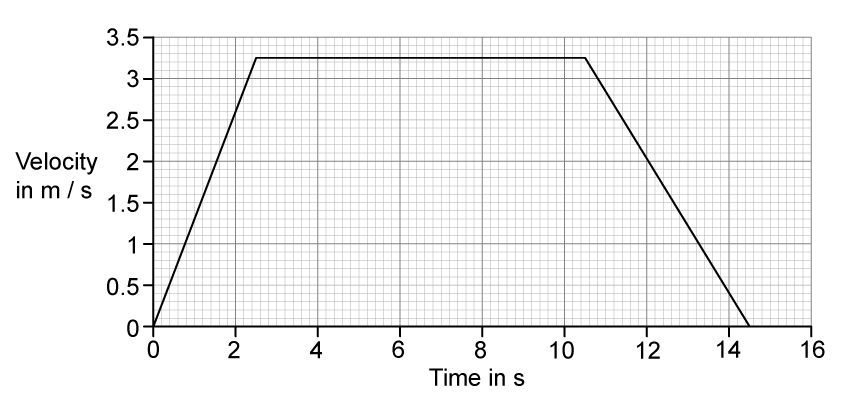
(i) Calculate the distance travelled by the sledge.
[3]
distance travelled = ............................................... m
(ii) State the equation linking average speed, distance moved and time taken.
[1]
(iii) Calculate the average speed of the sledge for the whole journey.
[2]
average speed = ............................................... m/s
Was this exam question helpful?
A car pulls a caravan along a horizontal road.

The caravan is removed and the car makes the return journey without it.

Without the van, the car has a greater acceleration and uses less fuel.
Explain these changes.
Was this exam question helpful?
A student investigates the extension of a rubber band when masses are added.
Tick the boxes to select the correct items of apparatus that the student would need in order to complete this investigation.
Two items have already been selected.

The table below shows the student's results.

(i) Complete the table by inserting the missing force.
[1]
(ii) Plot a graph to show how force varies with extension.
[5]

(iii) Use the information from the graph to explain whether the rubber band obeys Hooke's Law.
[2]
Was this exam question helpful?
A rabbit runs across the road in front of a car.
The driver applies the brakes.

State four factors that affect the chance of the rabbit escaping without being hit.
Was this exam question helpful?
Parachutes are used to slow down a spacecraft as it falls through the atmosphere.
Photograph G shows an Apollo spacecraft with three parachutes attached.

This spacecraft falls at a constant velocity.
(i) State the name of this constant velocity.
[1]
(ii) Explain why this velocity stays at a constant value.
[3]
(iii) Photograph H shows an identical Apollo spacecraft. Only two of its parachutes are working.

Explain how the constant velocity reached by this spacecraft compares with the constant velocity of the spacecraft shown in photograph G.
[2]
Photograph I shows a space shuttle using a parachute when it lands on a runway.

Explain what would happen to the stopping distance of the shuttle if this parachute did not open.
Was this exam question helpful?
A student investigates the extension of an elastic band for different forces.
(i) List the laboratory apparatus that the student needs for this investigation.
[3]
(ii) Extension, force and temperature are variables for this investigation.
Draw a line from each variable to its type.
[2]

(iii) Describe how the student can measure the extension of the elastic band when he adds a force of 12 N.
[2]
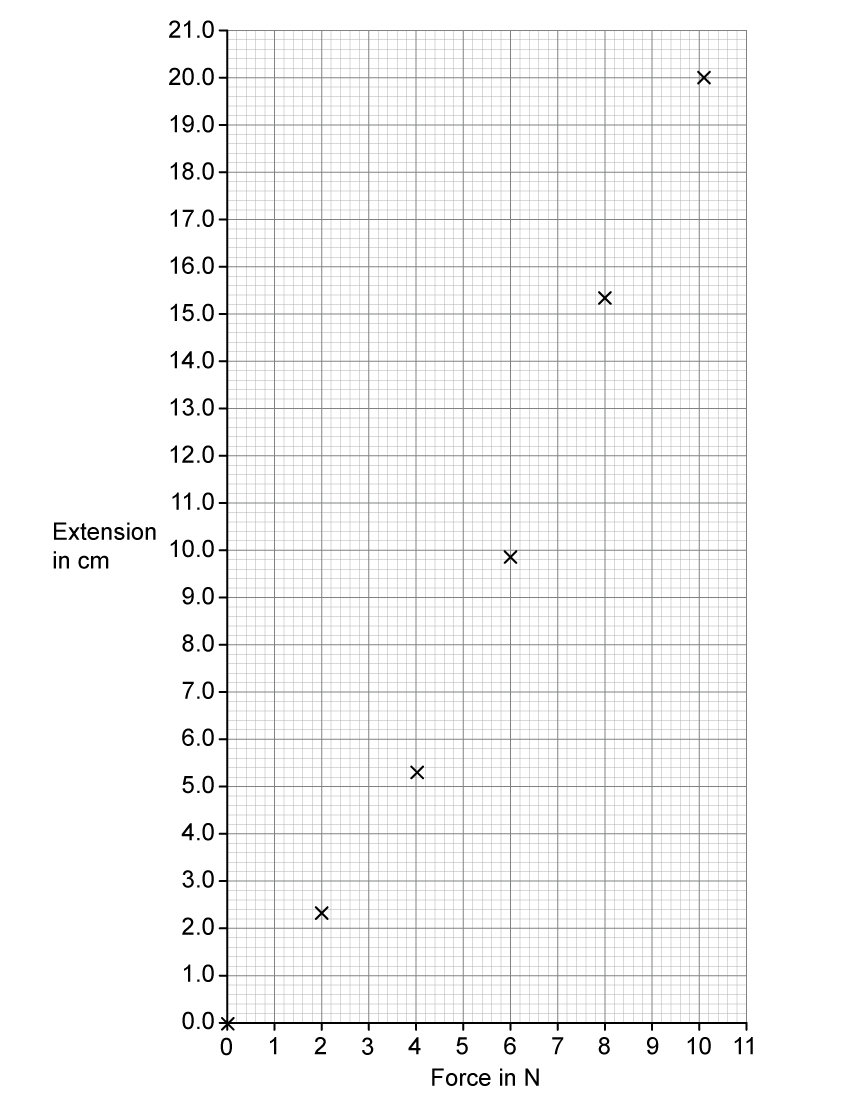
The student obtains this data as he first adds weights to the elastic band (loading) and as he then removes weights from the band (unloading).

He plots the loading data on a graph as shown.
(i) Suggest how the student could improve the quality of his data.
[2]
(ii) Draw a curve of best fit through the loading data.
[1]
(iii) On the same axes, plot the unloading data.
[2]
(iv) Draw a curve of best fit through the unloading data.
[1]
(v) The student concludes that the band is an elastic material and that it obeys Hooke’s law.
Discuss whether his conclusion is correct.
You should support your argument with data.
[3]
Was this exam question helpful?
A skydiver jumps from an aircraft.
The mass of the skydiver is 70 kg.
(i) State the equation linking weight, mass and g.
[1]
(ii) Calculate the weight of the skydiver and state the unit.
[2]
weight = ...................unit ........................
The graph shows the vertical velocity of the skydiver during the first 40 s of the fall.
His parachute is not open during this time.
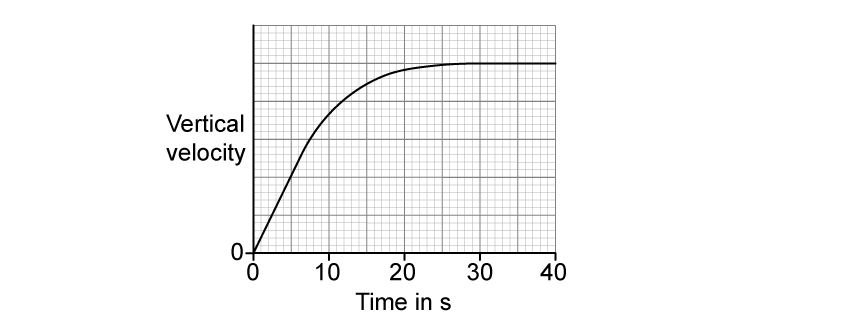
Explain the shape of the graph.
The diagram shows the skydiver falling at a constant velocity.
Add two labelled arrows to the diagram to represent the forces acting on the skydiver.

The skydiver opens his parachute after 40 s.
Continue the line on the graph to show how the skydiver’s vertical velocity changes and reaches terminal velocity.

Was this exam question helpful?
The graph shows the minimum stopping distances, in metres, for a car travelling at different speeds on a dry road.

Complete the equation to show the link between stopping distance, thinking distance and braking distance.
Describe the patterns shown in the graph.
Use the graph to estimate the stopping distance for a car travelling at 35 miles per hour.
stopping distance = ......................................... m
To find the minimum stopping distance, several different cars were tested.
Suggest how the data from the different cars should be used to give the values in the graph.
The tests were carried out on a dry road.
If the road is icy, describe and explain what change there would be, if any, to
(i) the thinking distance
[2]
(ii) the braking distance
[2]
Was this exam question helpful?
A student investigates how the extension of a spring varies when he hangs different loads from it.

Write a plan for the student’s investigation.
Your plan should include details of how the student can make accurate measurements.
You may add to the diagram to help your answer.
The student finds that the spring obeys Hooke’s law.
Draw a graph on the axes to show Hooke’s law relationship. Label the axes.

The student concludes that the spring shows elastic behaviour.
Explain what is meant by the term elastic behaviour.
Was this exam question helpful?
A student investigates whether a spring obeys Hooke’s law.
She uses the apparatus shown in the photograph.

Which additional measuring instrument does the student need for the investigation?
Explain how the student can investigate whether the spring obeys Hooke’s law.
Was this exam question helpful?
A hot-air balloon is tied to the ground by two ropes.
The diagram shows the forces acting on the balloon.
The tension T in each rope is 200 N.

The ropes are untied and the balloon starts to move upwards.
State the value of the force acting downwards on the balloon immediately after the ropes are untied and before the balloon starts moving.
force downwards = ............................................... N
(i) State the relationship between unbalanced force, mass and acceleration.
[1]
(ii) The balloon has a total mass of 910 kg.
The initial unbalanced force on the balloon is 400 N upwards.
Calculate the initial acceleration.
[2]
initial acceleration = ............................................... m/s2
Explain how the upward acceleration of the balloon changes during the first few seconds of its flight.
While the balloon is still accelerating, the pilot controls the balloon by pouring some sand from the bags. Explain how this affects the upward acceleration of the balloon.
Was this exam question helpful?
An ice hockey player strikes a puck, initially at rest, towards a goal.
(i) Describe the motion of the puck while it is in contact with the hockey stick.
[1]
The diagram shows the puck immediately after it has lost contact with the hockey stick.
The force of friction on the puck is represented on the diagram.

(ii) Draw labelled arrows on the diagram to show the other forces that act on the puck at this instant.
[3]
After leaving the hockey stick, the puck does not move with constant speed.
(i) State the direction in which the puck is accelerating.
[1]
(ii) Explain how the force arrows in the diagram show this.
[2]
Was this exam question helpful?
A flying squirrel is an animal that can glide through the air. It spreads out its limbs to stretch out a membrane that helps it to glide.

© Robert Savannah
The flying squirrel glides from P to Q with a constant velocity.

The velocity of the squirrel decreases to zero when it reaches the second tree because
an unbalanced force acts on the squirrel
no force acts on the squirrel
the GPE of the squirrel increases
the KE of the squirrel increases
Was this exam question helpful?
A student investigates terminal velocity.
She uses a tall glass tube filled with oil.
She drops a metal ball into the tube.
The ball falls through the oil.

Use ideas about forces to explain how a falling object can reach a terminal velocity.
Describe how the student could find out if the ball reaches terminal velocity as it falls through the oil.
In your answer, you should include
the measuring instruments that the student will need
the measurements that she should take
how she could use her measurements to find out if the ball reached terminal velocity.
You may include a labelled diagram in your answer.
Was this exam question helpful?
A golfer practises hitting balls on a golf course.
Ball X rolls along level ground, as shown in the diagram.
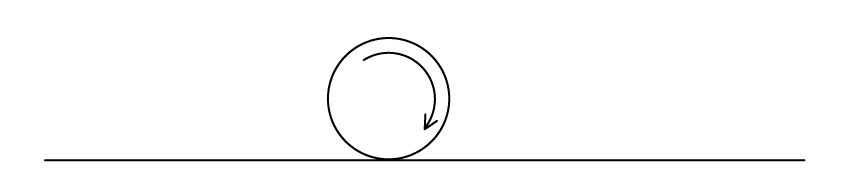
(i) Add labelled arrows to the diagram to show the directions of two of the forces acting on ball X.
[2]
(ii) Explain why ball X slows down and stops.
[3]
The golfer hits ball Y at an angle into the air.
He gives it the same initial kinetic energy as ball X.
Suggest why ball Y travels much further than ball X before it stops.
The mass of ball Y is 45 g.
The golfer gives the ball 36 J of kinetic energy when he hits it.
(i) State the equation linking kinetic energy, mass and speed.
[1]
(ii) Calculate the initial speed of ball Y.
[4]
initial speed = .............................................................. m/s
(iii) Ball Y reaches a maximum height of 30 m.
Suggest how the golfer should hit ball Y so it can reach a greater height.
[1]
Was this exam question helpful?
The Apollo 15 mission landed on the Moon in 1971.
The astronaut David Scott dropped a hammer and a feather.
They were released from rest at the same time and from the same height.
The hammer and the feather landed at the same time.

The graph shows how the velocity of the hammer changed with time.

(i) Use the graph to calculate the acceleration due to gravity on the Moon.
Give the unit.
[3]
acceleration = .......................... unit .................
(ii) Use the graph to calculate the height the hammer was dropped from.
[2]
height = ................................... m
The gravitational field strength is smaller on the Moon than on the Earth.
Suggest why.
If the same experiment is carried out on Earth, air resistance affects both objects.
The feather reaches the ground after the hammer, even though the force of air resistance is smaller on the feather than on the hammer.
Explain why the feather reaches the ground after the hammer.
Was this exam question helpful?
A student plans to measure the thickness of a sheet of paper with a ruler.
Explain why it is difficult to measure the thickness of a single piece of paper with a ruler.
The student puts a pile of 400 sheets of paper on a table.
He uses a ruler to measure the height of the pile.

The student records the thickness of the pile as 4.1 cm.
Suggest two reasons why the student's value for the thickness of the pile may be inaccurate.
The student folds the sheet of paper to make a paper aeroplane.
He throws the paper aeroplane into the air and it flies at a constant velocity.
(i) Explain why the forces on the paper aeroplane must be balanced.
[2]
(ii) The diagram shows the paper aeroplane as it moves at a constant velocity towards the right and slightly downwards.

Add labelled arrows to the diagram to show the directions of the forces of
Weight
Lift
Drag
[3]
(iii) As it flies, the paper aeroplane loses gravitational potential energy.
What happens to this energy?
[1]
Was this exam question helpful?
A student investigates the stretching of rubber bands.
She stretches four rubber bands as shown in the photograph.

She applies a force of 5.0 N and measures the length of the rubber bands.
She repeats the experiment with different numbers of rubber bands, using a force of 5.0 N each time.
The table shows her results.

(i) Estimate the length of the four rubber bands shown in the photograph and use your value to complete the table.
[1]
(ii) Suggest two reasons why your estimate may not be accurate.
[2]
Suggest how the student made this investigation a fair test.
(i) The number of rubber bands is a series of whole numbers.
State the name of this type of variable.
[1]
(ii) Display the results of the student’s investigation on the grid.
[4]

(iii) Describe the relationship between the number of rubber bands and the stretched length.
[2]
Was this exam question helpful?
A student makes chains of elastic bands by joining them together with paperclips.
He uses a newtonmeter to stretch each chain along a metre rule, as shown in photograph A.

For each chain, he records
the number of elastic bands
the length when the tension is 2 N
the length when the tension is 1 N
Then he calculates the difference in length for each chain.
(i) Complete the table by calculating the missing value.
[1]

(ii) Use the grid to plot a graph to show the relationship between the number of elastic bands and the difference in length.
[5]

(iii) Describe your line of best fit.
[2]
Photograph B shows a paperclip in one of the chains against the same metre rule.

Use photograph B to estimate the length of this paperclip.
length = ....................................cm
Look again at photograph A.
Suggest two ways that the student could improve his measuring technique.
Was this exam question helpful?
A student uses this apparatus to investigate forces stretching a spring.

She uses a ruler to measure the vertical distance h between the bottom of the mass hanger and the base of the stand.

Suggest two ways that the student can measure distance h more accurately.
The student continues her investigation by loading the spring with different masses.
The table shows her results.

(i) Name the dependent variable in this investigation.
[1]
(ii) Explain how the force values in the table are calculated.
[2]
(iii) Plot a graph of distance h against force, and draw the line of best fit.
[5]

(iv) Use the graph to find the force for which h is zero
[2]
force = ......................N
(v) Explain whether the spring obeys Hooke's law.
[2]
Was this exam question helpful?