Movement & Position (Edexcel IGCSE Science (Double Award) (Modular): Physics Unit 1): Exam Questions

Exam code: 4XSD1

2 hours17 questions
1a
1 mark

A toy car rolls down a ramp and hits a cushion.

The graph shows how its velocity changes with time.

Velocity-time graph for the toy car. The vertical axis is labelled velocity and the horizontal axis is labelled time; neither axis carries a scale and both begin at zero. The line rises steeply from the origin and curves over to become horizontal at a maximum velocity, stays horizontal for most of the graph, then drops steeply back down to zero at the end.

Constant velocity on the graph is shown by

  • the area under the line

  • the horizontal part of the line

  • the sloping line at the end

  • the sloping line at the start

1b
1 mark

The distance travelled is shown by

  • the area under the line

  • the horizontal part of the line

  • the sloping line at the end

  • the sloping line at the start

1c
1 mark

The average velocity of the toy car is given by

  • the change in velocity divided by the time taken

  • the distance moved divided by the time taken

  • the time taken divided by the change in velocity

  • the time taken divided by the distance moved

2a
2 marks

A bus travels along a straight road.

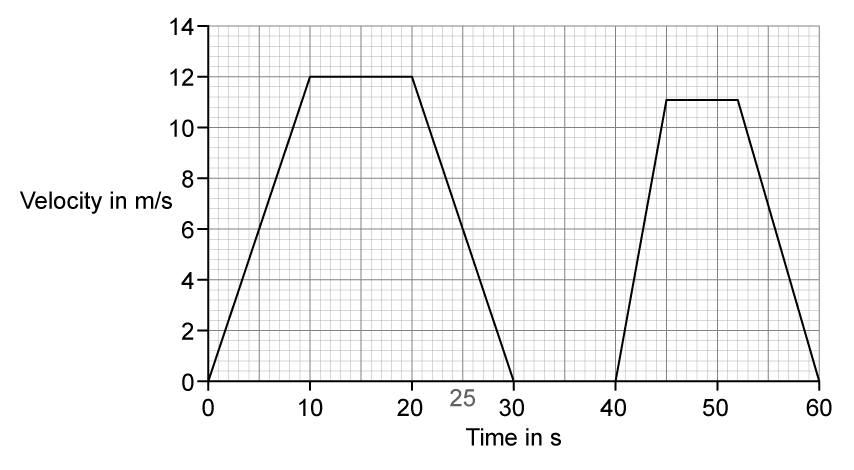
The graph shows how the velocity of the bus changes during a short journey.

A velocity-time graph drawn on a fine grid, with time in seconds on the horizontal axis from 0 to 60 and velocity in metres per second on the vertical axis from 0 to 14. The line rises straight from 0 at 0 seconds to 12 m/s at 10 seconds, stays level at 12 m/s until 20 seconds, then falls straight to 0 at 30 seconds. It stays at 0 until 40 seconds, then rises straight to 11 m/s at about 46 seconds, stays level at 11 m/s until about 52 seconds, and falls straight to 0 at 60 seconds.

(i) State the velocity of the bus after 25 s.

[1]

velocity = .............................m/s

(ii) How long is the bus stationary during its journey?

[1]

time = .............................s

2b
4 marks

(i) State the equation linking acceleration, change in velocity and time taken.

[1]

(ii) Calculate the acceleration of the bus during the first 10 seconds.

Give the unit.

[3]

acceleration = .......................... unit ..........................

2c
3 marks

(i) State the equation linking average speed, distance moved and time taken.

[1]

(ii) The bus moves a total distance of 390 m during the journey.

Calculate the average speed of the bus.

[2]

average speed = ......................... m/s

2d
2 marks

The bus travels further in the first 30 seconds of its journey than it does during the last 30 seconds.

Explain how the graph shows this. 

3a
2 marks

Two students are investigating motion. Student 1 walks in a straight line. Student 2 measures the distance Student 1 has walked at 10 s intervals.

State two measuring instruments the students should use.

3b
3 marks

The table shows their measurements.

Time in s

Distance walked in m

0

0

10

14

20

19

30

24

40

29

50

30

60

31

Draw a graph of distance against time for this data.

Blank graph grid with distance walked in m on the vertical axis, labelled 0 to 35 in steps of 5, and time in s on the horizontal axis, labelled 0 to 80 in steps of 10. No points or lines are plotted.
3c
1 mark

How far had Jenny walked after 35 s?

Distance walked = ................................... m

3d
2 marks

(i) Describe how Jenny’s speed changed during the investigation.

[1]

(ii) What feature of the graph shows this change?

[1]

4a
7 marks

The velocity-time graph shows how the velocity of a motorcycle changes with time.

Velocity-time graph for a motorcycle. The horizontal axis is time in seconds, marked from 0 to just past 30 with labels every 5 seconds. The vertical axis is velocity in m/s, marked from 0 to 25 with labels every 5 m/s. The line rises as a straight slope from the origin to 21.5 m/s at 10 seconds, runs horizontally at 21.5 m/s from 10 seconds to 20 seconds, then falls as a steeper straight slope to 0 m/s at 22.5 seconds.

State and explain which part of the graph shows that the motorcycle has

(i) A constant velocity.

[2]

(ii) A constant acceleration.

[3]

(iii) A constant deceleration.

[2]

4b
7 marks

(i) State the formula linking acceleration, change in velocity and time taken.

[1]

(ii) Calculate the acceleration of the motorcycle between 0 and 10 seconds.

[3]

acceleration = ............................................................ m/s2

(iii) Show that the distance travelled by the motorbike between 0 and 10 seconds is about 108 m.

[3]

distance = ............................................................ m

4c
3 marks

Calculate the total distance travelled by the motorbike.

distance = .............................................................. m

5a
1 mark

The following graphs A to D show the variation of displacement and velocity with time for different objects.

Four graphs labelled A to D, each with time in s from 0 to 5 on the horizontal axis. Graph A: displacement in m on the vertical axis, scaled 0 to 2.5, showing a horizontal straight line at 2.0 m for the whole 5 s. Graph B: velocity in m/s on the vertical axis, scaled 0 to 2.5, showing a horizontal straight line at 2.0 m/s for the whole 5 s. Graph C: displacement in m on the vertical axis, scaled 0 to 12, showing a straight line falling steadily from 12 m at 0 s to 0 m at 5 s. Graph D: velocity in m/s on the vertical axis, scaled 0 to 12, showing a straight line rising steadily from 0 m/s at 0 s to 12 m/s at 5 s.

Which of these graphs represents an object moving with a constant velocity of 2 m/s?

  • A

  • B

  • C

  • D

5b
1 mark

Which of the graphs in (a) represents an object which is not moving?

  • A

  • B

  • C

  • D

6a
2 marks

This question is about motion graphs.

A skateboarder is travelling along a flat road at constant speed. Her friend is standing by the side of the road.

The friend starts their stop watch once the skateboarder passes them.

On the axes below, sketch a graph of the skateboarder's distance from her friend against time on the stopwatch.

Two blank axes. The x-axis is labelled "Time" and the y-axis is labelled "Distance".
6b
3 marks

Ahead of the skateboarder, the flat road begins to slope downhill at a constant angle.

(i) The skateboarder reaches the start of the downhill section and begins accelerating.

Give the name of the force causing this acceleration.

[1]

(ii) On the axes below, sketch a graph of the skateboarder's velocity starting from when she begins travelling downhill.

Ignore the effects of friction and air resistance.

Two blank axes. The x-axis is labelled "Time" and the y-axis is labelled "Velocity".

[2]

6c
3 marks

Just before reaching the downhill part of the road, the skateboarder's speed was 3 m/s. After travelling down the hill for 5 seconds, her speed is now 10 m/s.

Calculate the acceleration of the skateboarder in these 5 seconds.

1a
7 marks

An aeroplane takes two minutes to travel the short distance between airports on two islands.

A black and white photograph of a small twin-propeller passenger aeroplane in flight against a plain pale sky, banking slightly with its landing gear lowered and an airline name printed along the rear fuselage.

The graph shows how the speed of the aeroplane changes as it

  • takes off

  • flies across the sea

  • lands on the other island

When it is flying across the sea, the aeroplane travels at a constant speed.

A speed-time graph drawn on a square grid. The vertical axis is labelled speed in m / s and is scaled from 0 to 40 in steps of 10. The horizontal axis is labelled time in s and is scaled from 0 to 120 in steps of 20. The line starts at the origin and rises as a straight slope to a speed of about 42 m/s at 15 s. It then stays horizontal at about 42 m/s until 95 s, before falling as a straight slope to 0 m/s at 120 s.

Use the graph to answer the following questions.

(i) State the value of the constant speed.

[1]

speed = ..................................... m/s

(ii) Calculate the acceleration of the aeroplane at the start of the journey and give the unit.

[3]

acceleration = ............................... unit ...................

(iii) Calculate the total distance that the aeroplane travels.

[3]

distance = ..................................... m

1b
3 marks

Each airport has a runway that is about 500 m long.

When it lands, the speed of the aeroplane is 40 m/s.

Explain why the airline should not use an aeroplane that has more mass and needs a higher speed for landing.

2a
3 marks

Graph 1 shows how the velocity of a car changes with time.

Graph 1, a velocity-time graph. The vertical axis is labelled velocity in m/s and runs from 0 to 25, with fine gridlines every 1 m/s and values marked every 5 m/s. The horizontal axis is labelled time in s and runs from 0 to 4, with values marked every 1 s. A single straight line starts at the origin and rises steadily, reaching 22 m/s at 4 s.

Calculate the distance the car travels in the first four seconds.

distance = ............................................... m

2b
3 marks

As the car travels further along the track its acceleration changes as shown in graph 2.

Graph 2, a velocity-time graph. The vertical axis is labelled velocity in m/s and runs from 0 to 70, with fine gridlines and values marked every 10 m/s. The horizontal axis is labelled time in s and runs from 0 to 40, with values marked every 10 s. A single curved line starts at the origin and rises steeply at first, then becomes gradually less steep, flattening out towards a velocity of about 66 m/s at 40 s.

(i) State which feature of graph 2 shows how the acceleration changes.

[1]

(ii) The acceleration changes even though the driving force does not change.

Suggest two possible reasons for this change in acceleration.

[2]

3a
3 marks

The graph shows how the velocity of an aircraft changes as it accelerates along a runway.

Velocity-time graph on gridded axes, with velocity in m/s from 0 to 80 on the vertical axis and time in s from 0 to 60 on the horizontal axis. The line starts at the origin and rises in a straight line to about 65 m/s at 35 s, then curves and flattens, reaching about 78 m/s at 60 s.

Use the graph to find the average acceleration of the aircraft.

acceleration = ............................................................. m/s2

3b
3 marks

Explain why the acceleration is not constant, even though the engines produce a constant force.

4a
5 marks

The Apollo 15 mission landed on the Moon in 1971.

The astronaut David Scott dropped a hammer and a feather.

They were released from rest at the same time and from the same height.

The hammer and the feather landed at the same time.

Drawing of an astronaut in a white spacesuit standing on the grey surface of the Moon against a black sky. Both arms are held out sideways at the same height. A label with an arrow on the left points to a hammer held in one gloved hand, and a label with an arrow on the right points to a feather held in the other gloved hand.

The graph shows how the velocity of the hammer changed with time.

Velocity-time graph drawn on a fine square grid. The vertical axis is labelled velocity in m/s and is marked from 0 to 2.5 with labels every 0.5. The horizontal axis is labelled time in seconds and is marked from 0 to 1.4 with labels every 0.2. A straight line rises steadily from the origin to a velocity of 2.0 m/s at a time of just over 1.25 seconds, then drops vertically back to zero.

(i) Use the graph to calculate the acceleration due to gravity on the Moon.

Give the unit.

[3]

Acceleration = .......... unit .................

(ii) Use the graph to calculate the height the hammer was dropped from.

[2]

Height = .................................... m

4b
1 mark

The gravitational field strength is smaller on the Moon than on the Earth.

Suggest why.

4c
4 marks

If the same experiment is carried out on Earth, air resistance affects both objects. 

The feather reaches the ground after the hammer, even though the force of air resistance is smaller on the feather than on the hammer. 

Explain why the feather reaches the ground after the hammer.

1a
2 marks

A student cycles to school.

The graph shows the stages A to G of the journey.

Velocity-time graph of a cycle journey. The vertical axis is velocity in m/s from 0 to 8 and the horizontal axis is time in s from 0 to 30. Seven straight-line stages are labelled. A rises from 0 m/s at 0 s to 5 m/s at 7 s. B is horizontal at 5 m/s from 7 s to 10 s. C falls from 5 m/s at 10 s to 0 m/s at 13 s. D is horizontal at 0 m/s from 13 s to 15 s. E rises from 0 m/s at 15 s to 7 m/s at 17 s. F is horizontal at 7 m/s from 17 s to 24 s. G falls from 7 m/s at 24 s to 0 m/s at 27 s.

Describe the motion of the student during stages B and D.

1b
1 mark

State how the graph shows that the acceleration for stage E is greater than the acceleration for stage A.  

1c
4 marks

Calculate the distance that the student travels in the last 10 s of the journey.

1d
3 marks

The total distance travelled is 106.5 m.

Show that the average speed of the journey is about 4 m/s.

2a
3 marks

The diagram shows some people waiting in a queue at a supermarket.

A line drawing of a queue of seven customers at a supermarket checkout, each carrying a wire shopping basket. A leader line labels the customer standing at the back of the queue as person X. At the front of the queue a customer is lifting a basket onto the checkout counter, where an assistant in an apron stands beside a till. The counter is labelled checkout.

The queue moves forward each time a person leaves the checkout.

Person X spends seven minutes in the queue before reaching the checkout.

The graph shows how distance changes with time for person X.

A distance-time graph for person X drawn on a fine grid. Time in minutes runs from 0 to 8 on the horizontal axis and distance in m runs from 0 to 7 on the vertical axis. The line is a series of steps. It stays at 0 m until 0.8 minutes, then rises steeply to 1.5 m at 1.0 minute and stays flat until 2.5 minutes. It rises to 2.5 m and stays flat until 3.5 minutes, rises to 3.5 m and stays flat until 4.5 minutes, rises to 4.4 m and stays flat until 5.8 minutes, rises to 5.6 m and stays flat until 6.8 minutes, then rises to 6.1 m at 7.0 minutes and stays flat to 8 minutes.

(i) Determine the initial length of the queue.

[1]

initial length = .............................................................. m

(ii) Explain how you could use the graph to work out the number of times person X is stationary.

[2]

2b
4 marks

(i) State the equation linking average speed, distance moved and time taken.

[1]

(ii) Calculate the average speed of person X in the queue.

Give the unit.

[3]

average speed = .............................................. unit .........................

3a
5 marks

The diagram shows an air track that can be used to investigate motion.

Air comes out through a series of small holes in the air track.

A small glider floats on a cushion of air.

Three-dimensional drawing of an air track. It is a long beam of triangular cross-section, resting on two small supports, with a row of small circular holes along its sloping front face labelled air holes. A pipe enters the lower left end and an arrow pointing into it is labelled air in. A box-shaped glider sits astride the track and is labelled glider. A thin rectangular card stands upright on top of the glider and is labelled card.

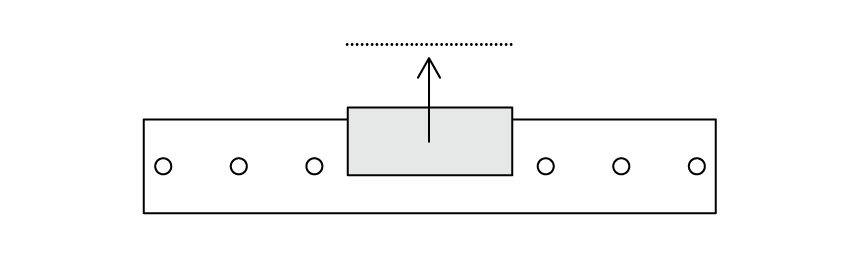
(i) The diagram below shows the glider at rest on the air track.

Complete the diagram to show the forces acting on the glider.

Label the forces. One force arrow has been drawn for you.

Side view of the air track drawn as a long horizontal rectangle with six small circles along it representing the air holes. A grey rectangle representing the glider sits on top of the track, above the middle two holes. A single arrow points vertically upwards from the centre of the glider to a blank dotted label line.

[3]

(ii) Explain what effect the cushion of air has on the movement of the glider.

[2]

3b
4 marks

Two light gates connected to a data logger are placed above the air track so that the card will pass through them.

The glider moves at a constant speed to the right.

Side view of the air track drawn as a long horizontal beam labelled air track. A dark grey glider, labelled glider, sits on the track at the left-hand end. Two light gates straddle the track to the right of the glider, the nearer one numbered 1 and the further one numbered 2, together labelled light gates. A dashed arrow runs from the glider horizontally through light gate 1 and then light gate 2, pointing to the right.

The length of the card is 8.3 cm.

The card takes 314 ms to pass through the first light gate.

(i) State the relationship between average speed, distance moved and time taken.

[1]

(ii) Calculate the average speed of the card as it passes through the first light gate.

[2]

average speed = ............................................. cm/s

(iii) State the time taken for the card to pass through the second light gate.

[1]

time taken = ............................................. ms

4a
2 marks

A student investigates the speed of different toy cars as they roll down a slope.

Side view of a straight slope descending from left to right down to horizontal ground. A toy car sits on the slope near the top. A vertical double-headed arrow runs from the ground up to the car's position on the slope and is labelled starting height.

A student makes this prediction.

'The more weight a toy car has the faster it will roll down the slope.'

(i) What is the independent variable in the student's prediction?

[1]

(ii) What is the dependent variable in the student's prediction?

[1]

4b
2 marks

State two factors that the student should keep constant in their investigation.

4c
2 marks

Put ticks (✓) in the boxes to show which pieces of apparatus the student needs for their investigation.

One has been done for you.

A table with seven rows and two columns. The left column lists, in order, battery, joulemeter, micrometer, newtonmeter, ruler, stopwatch and thermometer. The right column holds one empty box beside each item, except the box beside ruler, which already contains a tick.
4d
5 marks

Describe what the student should do to test their prediction that the more weight the toy car has, the faster it will roll down the slope. 

5
5 marks

A racing cyclist practises by riding around a track.

Black and white photograph of an indoor velodrome. A racing cyclist, crouched low on a track bike, rides along the banked oval track in the foreground, with a second cyclist on the far side of the track. The oval infield is enclosed by railings and holds equipment, and rows of empty spectator seating are visible at the top of the image.

A student wants to find the average speed of the cyclist.

Describe a method that the student could use to find the average speed.

6a
1 mark

The following graphs A to D show the variation of displacement and velocity with time for different objects.

Four graphs labelled A to D drawn on square grids. Graph A: displacement in m against time in s, a horizontal line at a displacement of 2.0 m from 0 to 5 s. Graph B: velocity in m/s against time in s, a horizontal line at a velocity of 2.0 m/s from 0 to 5 s. Graph C: displacement in m against time in s, a straight line falling steadily from 12 m at 0 s to 0 m at 5 s. Graph D: velocity in m/s against time in s, a straight line rising steadily from 0 m/s at 0 s to 12 m/s at 5 s.

Which of the graphs represents an object moving with a velocity of -2.4 m/s after 2 seconds?

  • A

  • B

  • C

  • D

6b
3 marks

Calculate the distance travelled by the object shown in graph D after 5 seconds.  

distance = .............................................................. m

7a
9 marks

A manufacturer tests a new car on a long, flat road.

The car starts from rest at the beginning of the track and accelerates uniformly.

Two speed sensors are positioned 100 m and 500 m from the start. When the car passes the second sensor at 500 m, its speed is 54 m/s.

(i) Calculate the acceleration of the car.

[3]

(ii) Calculate the speed of the car as it passes the first speed sensor at 100 m.

[3]

(iii) Calculate the time taken for the car to travel between the two speed sensors.

[3]

7b
6 marks

The same car is tested on a driving course. It must complete a full lap and, at some point in the journey, perform an emergency stop.

The diagram shows the car's velocity-time graph for the whole journey.

A speed-time graph with time in seconds on the x axis and speed in metres per second on the y axis. Straight line segments connect the points (1, 0), (10, 20), (30, 30), (33, 40) and (40, 0). The line then restarts at (42, 0) and further straight segments connect (42, 0), (50, 10), (55, 10) and (60, 0).

(i) Suggest the time at which the car began its emergency stop.

[1]

(ii) State two factors which affect the braking distance of a car.

[2]

(iii) Using the velocity-time graph, determine the stopping distance of the car during its emergency stop.

[3]