Effect of Temperature on Reaction Rates & the Concept of Activation Energy (Cambridge (CIE) A Level Chemistry): Exam Questions

Exam code: 9701

28 mins16 questions
1a
2 marks

A reversible reaction is shown.

A + B ⇌ C + D

The reaction pathway diagram for this reaction is shown in Fig. 1.1.


Reaction pathway diagram for A + B ⇌ C + D, with products C + D at a higher energy level than reactants A + B; activation energy Ea and enthalpy change ΔH are labelled

Fig. 1.1

Use Fig. 1.1 to deduce whether the forward reaction is exothermic or endothermic. Explain your answer.

1b
2 marks

Define the term activation energy, Ea.

1c
Sme Calculator
2 marks

Use Fig. 1.1 to determine the activation energy for the forward reaction and for the reverse reaction.

activation energy of the forward reaction = .............................. kJ mol-1

activation energy of the reverse reaction = .............................. kJ mol-1

1d
3 marks

Fig. 1.2 shows the reaction pathway diagram for the same reaction in the presence of a catalyst.
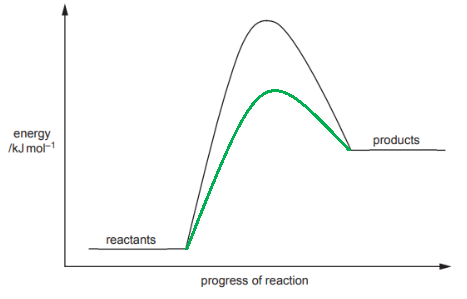
Reaction pathway diagram showing the original reaction profile and a second catalysed reaction pathway with a lower activation energy peak, both curves sharing the same reactant and product energy levels

Fig. 1.2

Use Fig. 1.2 to explain how the addition of a catalyst increases the rate of reaction.

2a
2 marks

This question is about Boltzmann distribution curves.

The Boltzmann distribution curve of molecular energies for a general reaction at a given temperature is shown in Fig. 2.1.

Boltzmann distribution curve showing number of molecules on the y-axis and energy on the x-axis, with the activation energy Ea marked as a vertical dashed line

Fig. 2.1

State what will happen to the curve when the temperature of the reaction is decreased.

2b
1 mark

State how, if at all, the total area under a Boltzmann distribution curve changes with temperature.

2c
1 mark

State the effect of adding a catalyst on the activation energy, Ea, of the reaction.

2d
1 mark

The Boltzmann distribution of energies for a gas is shown in Fig. 2.2.

Boltzmann distribution curve with a shaded region to the left of the activation energy Ea, representing molecules with energy less than or equal to Ea

Fig. 2.2

State what the shaded area of Fig. 2.2 represents.