Proton (1H) NMR Spectroscopy (Cambridge (CIE) A Level Chemistry): Exam Questions

Exam code: 9701

1 hour8 questions
1a
2 marks

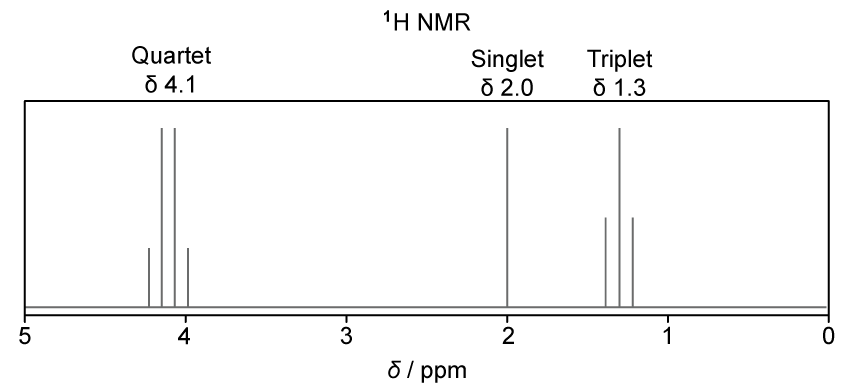
State the name and draw the skeletal formula of the compound commonly used as a reference standard in proton (1H) NMR spectroscopy.

1b
6 marks

Fig. 1.1 shows the skeletal formulae of three isomers of pentane, A, B and C.
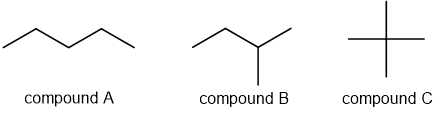
Line drawings of three isomers of pentane labelled: compound A zigzag chain, compound B branched chain, compound C cross-shaped with four equal arms.

Fig. 1.1

Complete Table 1.1 to state the number of peaks that would be present in the low-resolution proton (1H) NMR and carbon-13 (13C) NMR spectra of isomers A, B and C.

Table 1.1

Isomer

Number of peaks in 1H NMR spectrum

Number of peaks in 13C NMR spectrum

A

B

C

1c
3 marks

In the high-resolution 1H NMR spectrum of isomer B, the two methyl groups attached to carbon-2 give a doublet splitting pattern. The methyl groups in isomer C give a singlet splitting pattern.

Explain these splitting patterns in terms of neighbouring protons.

2a
Sme Calculator
4 marks

Compound X contains 62.1% C, 10.3% H and 27.6% O by mass.

i) Show that the empirical formula of compound X is C3H6O.

[3]

ii) The Mr of compound X is 58.0. Deduce the molecular formula of compound X. Explain your reasoning.

[1]

2b
2 marks

There are several possible isomers of compound X.

Draw the skeletal formulae of two structural isomers of compound X that contain a carbonyl group.

2c
3 marks

A sample of a different isomer of compound X is cyclopropanol, which was analysed by NMR spectroscopy.

i) State the number of peaks in the carbon-13 (13C) NMR spectrum of cyclopropanol.

[1]

ii) Cyclopropanol was dissolved in CDCl3 and the proton (1H) NMR spectrum of this solution was recorded as shown in Fig. 2.1.

Proton (1H) NMR spectrum of cyclopropanol dissolved in CDCl3

Fig. 2.1

State the identity of a substance that can be added to the solution to identify the peak due to the –OH proton. State how the 1H NMR spectrum will change.

[2]

1a
2 marks

The proton (1H) NMR spectrum of methyl cinnamate, C10H10O2, recorded using CDCl3 as a solvent is shown in Fig. 1.1.

The proton (1H) NMR spectrum of methyl cinnamate, C10H10O2

Fig. 1.1

i) Explain why CDCl3 is used as the solvent instead of CHCl3.

[1]

ii) State the purpose of adding tetramethylsilane (TMS) to the sample.

[1]

1b
3 marks

The skeletal formula of methyl cinnamate is shown in Fig. 1.2.

The skeletal formula of methyl cinnamate

Fig. 1.2

Use Table 1.1 to deduce the proton environment that gives rise to the peak at δ = 3.8 ppm in Fig. 1.1. Explain your reasoning using the chemical shift, integration, and splitting pattern.

Table 1.1

Environment of proton

Example

Chemical shift range, δ / ppm

alkane

–CH3, –CH2–, >CH

0.9 – 1.7

alkyl next to C=O

CH3–C=O, –CH2–C=O, >CH–C=O

2.2 – 3.0

alkyl next to aromatic ring

CH3–Ar, –CH2–Ar, >CH–Ar

2.3 – 3.0

alkyl next to electronegative atom

CH3–O, –CH2–O, –CH2–Cl

3.2 – 4.0

attached to alkene

=CHR

4.5 – 6.0

attached to aromatic ring

H–Ar

6.0 – 9.0

aldehyde

HCOR

9.3 – 10.5

alcohol

ROH

0.5 – 6.0

phenol

Ar–OH

4.5 – 7.0

carboxylic acid

RCOOH

9.0 – 13.0

alkyl amine

R–NH

1.0 – 5.0

aryl amine

Ar–NH2

3.0 – 6.0

amide

RCONHR

5.0 – 12.0

1c
2 marks

Draw the skeletal formulae of the two ester isomers of C6H12O2 that each produce exactly two peaks, both singlets, in their 1H NMR spectra. The relative peak areas are 3:1 for both esters.

1d
5 marks

The proton (1H) NMR spectrum of another isomer of C6H12O2 is shown in Fig. 1.3.

Proton NMR spectrum of a C6H12O2 ester isomer

Fig. 1.3

The integration values for the peaks are given in Table 1.2.

Table 1.2

Chemical shift, δ / ppm

3.8

3.5

2.6

2.2

1.2

Integration value

0.6

0.6

0.6

0.9

0.9

Splitting pattern

triplet

quartet

triplet

singlet

triplet

i) Deduce the simplest whole-number ratio of the number of protons in each environment.

[1]

ii) Use Table 1.1 to explain the chemical shift and splitting pattern of the peaks at δ = 3.5 and δ = 1.2.

[4]

1e
1 mark

Four isomers of C6H12O2, A, B, C and D, are shown in Fig. 1.4.

Skeletal formulae of four C6H12O2 ester isomers A, B, C and D

Fig. 1.4

The 13C NMR spectrum of one of these four isomers is shown in Fig. 1.5.

Carbon-13 NMR spectrum of one of the C6H12O2 ester isomers

Fig. 1.5

Table 1.3

Hybridisation of the carbon atom

Environment of carbon atom

Example

Chemical shift range δ/ppm

sp3

alkyl

CH3–, CH2–, –CH<, >C<

0 – 50

sp3

next to alkene / arene

C–C=C, –C–Ar

25 – 50

sp3

next to carbonyl / carboxyl

C–COR, C–O2R

30 – 65

sp3

next to halogen

C–X

30 – 60

sp3

next to oxygen

C–O

50 – 70

sp2

alkene or arene

>C=C<

110 – 160

sp2

carboxyl

R−COOH, R−COOR

160 – 185

sp2

carbonyl

R−CHO, R−CO−R

190 – 220

sp

nitrile

R−C≡N

100 – 125

Use Table 1.3 to deduce which of the four isomers A, B, C or D produced the 13C NMR spectrum shown in Fig. 1.5.

2a
2 marks

Ethane-1,2-diol, C2H6O2, and ethanedioic acid, C2H2O4, can be distinguished using mass spectrometry, infrared spectroscopy and proton NMR spectroscopy.

Fig. 2.1 (spectrum A) and Fig. 2.2 (spectrum B) show the mass spectra of ethane-1,2-diol and ethanedioic acid.

Mass spectrum A of ethane-1,2-diol

Fig. 2.1 (spectrum A)

Mass spectrum B of ethanedioic acid

Fig. 2.2 (spectrum B)

Complete Table 2.1. Deduce which compound is responsible for each spectrum and explain your answer.

Table 2.1

Spectrum

Organic compound

Explanation

A

B

2b
2 marks

The IR spectra of ethane-1,2-diol, C2H6O2, and ethanedioic acid dihydrate, C2H2O4.2H2O, are shown in Fig. 2.3 (spectrum C) and Fig. 2.4 (spectrum D).

Infrared spectrum C of ethane-1,2-diol

Fig. 2.3 (spectrum C)

Infrared spectrum D of ethanedioic acid dihydrate

Fig. 2.4 (spectrum D)

Use the Data Booklet to complete Table 2.2. Deduce which compound is responsible for each spectrum and explain your answer.

Table 2.2

Spectrum

Organic compound

Explanation

C

D

2c
3 marks

The proton (1H) NMR spectrum of ethane-1,2-diol is shown in Fig. 2.5.

Proton NMR spectrum of ethane-1,2-diol

Fig. 2.5

Use the spectrum to deduce the two proton environments in ethane-1,2-diol. State the number of peaks, their integration ratio and identify each environment.

2d
2 marks

State the number of peaks and the splitting pattern in the proton (1H) NMR spectrum of ethanedioic acid.

3a
1 mark

Lidocaine is used as a local anaesthetic. The structure of lidocaine is shown in Fig. 3.1.

Skeletal formula of lidocaine

Fig. 3.1

A sample of lidocaine was analysed by carbon-13 NMR spectroscopy.

Deduce the number of peaks in the carbon-13 NMR spectrum of lidocaine.

3b
3 marks

Lidocaine was dissolved in CDCl3 and the proton NMR spectrum of this solution was recorded as shown in Fig. 3.2.

Proton NMR spectrum of lidocaine dissolved in CDCl3

Fig. 3.2

Use the Data Booklet to complete Table 3.1 for the chemical shifts at δ 2.3 ppm, 3.0 ppm and 9.0 ppm.

Table 3.1

δ / ppm

environment of proton

number of 1H atoms responsible for the peak

splitting pattern

1.2

terminal methyl groups next to CH2

6

triplet

2.3

3.0

7.1 - 7.4

attached to the aromatic ring

3

overlapping peaks

9.0

Table 3.2

Environment of proton

Example

chemical shift range, δ / ppm

alkane

–CH3, –CH2–, >CH

0.9 – 1.7

alkyl next to C=O

CH3–C=O, –CH2–C=O, >CH–C=O

2.2 – 3.0

alkyl next to aromatic ring

CH3–Ar, –CH2–Ar, >CH–Ar

2.3 – 3.0

alkyl next to electronegative atom

CH3–O, –CH2–O, –CH2–Cl

3.2 – 4.0

attached to alkene

=CHR

4.5 – 6.0

attached to aromatic ring

H–Ar

6.0 – 9.0

aldehyde

HCOR

9.3 – 10.5

alcohol

ROH

0.5 – 6.0

phenol

Ar–OH

4.5 – 7.0

carboxylic acid

RCOOH

9.0 – 13.0

alkyl amine

R–NH

1.0 – 5.0

aryl amine

Ar–NH2

3.0 – 6.0

amide

RCONHR

5.0 – 12.0

3c
1 mark

Explain why the absorption at δ 1.2 ppm is a triplet.

1a
Sme Calculator
3 marks

Compound P is a naturally occurring chemical found in strawberries, apples and Parmesan cheese.

The percentage by mass is carbon 58.82%, hydrogen 9.80% and oxygen 31.38%.

The mass spectrum of compound P is recorded in Fig. 1.1.

Mass spectrum of compound P

Fig. 1.1

Calculate the molecular formula of compound P. Show your working.

1b
4 marks

Table 1.1 shows the results of qualitative tests performed on compound P.

Table 1.1

Test

Observation

Addition of H2O

Forms separate layers

Na2CO3 (aq)

No visible change

2,4-DNPH

No visible change

Tollens' reagent

No visible change

Deduce the functional groups present in compound P. Explain your answers with reference to Table 1.1.

1c
3 marks

The carbon-13 (13C) NMR spectrum of compound P is shown in Fig. 1.2.

Carbon-13 NMR spectrum of compound P

Fig. 1.2

Deduce the functional group present in compound P, using your answer to (b) and information from Fig. 1.2 and the Data Booklet. Explain your answer.

1d
3 marks

The high-resolution proton (1H) NMR spectrum of compound P is shown in Fig. 1.3.

High-resolution proton NMR spectrum of compound P

Fig. 1.3

Deduce the skeletal formula of compound P, using your answers to (a), (b) and (c) and information from Fig. 1.3 and the Data Booklet. Explain your answer.

2a
1 mark

A chemist prepares and analyses some esters.

The chemist prepares an ester by reacting propan-2-ol with ethanoic anhydride.

Using structural formulae, construct an equation for the reaction of propan-2-ol with ethanoic anhydride.

2b
3 marks

A sample contains a mixture of two esters contaminated with an alkane and an alcohol.

The chemist attempts to separate the four organic compounds in the mixture using gas chromatography. The stationary phase in the gas chromatograph column is a liquid alkane.

i) Explain how a liquid stationary phase separates organic compounds in a mixture.

[1]

ii) Deduce the relative retention times of these four compounds using the alkane stationary phase. Explain your answer.

[2]

2c
8 marks

An ester is isolated from a perfume and analysed.

The percentage by mass of the ester is: carbon 66.63%, hydrogen 11.18% and oxygen 22.19%.

The mass spectrum and proton (1H) NMR spectrum of the ester are shown in Fig. 2.1 and Fig. 2.2 respectively.

Mass spectrum of ester isolated from perfume

Fig. 2.1

Proton NMR spectrum of ester isolated from perfume

Fig. 2.2

Table 2.1

Environment of proton

Example

chemical shift range, δ / ppm

alkane

–CH3, –CH2–, >CH

0.9 – 1.7

alkyl next to C=O

CH3–C=O, –CH2–C=O, >CH–C=O

2.2 – 3.0

alkyl next to aromatic ring

CH3–Ar, –CH2–Ar, >CH–Ar

2.3 – 3.0

alkyl next to electronegative atom

CH3–O, –CH2–O, –CH2–Cl

3.2 – 4.0

attached to alkene

=CHR

4.5 – 6.0

attached to aromatic ring

H–Ar

6.0 – 9.0

aldehyde

HCOR

9.3 – 10.5

alcohol

ROH

0.5 – 6.0

phenol

Ar–OH

4.5 – 7.0

carboxylic acid

RCOOH

9.0 – 13.0

alkyl amine

R–NH

1.0 – 5.0

aryl amine

Ar–NH2

3.0 – 6.0

amide

RCONHR

5.0 – 12.0

i) Calculate the molecular formula of the ester. Show your working.

[3]

ii) Use Fig. 2.1, Fig. 2.2 and the Data Booklet to deduce the skeletal formula of the ester. Explain your reasoning.

[5]

3a
3 marks

Compound X contains carbon, hydrogen and oxygen only. It has a relative molecular mass (Mr) of 88.

The infra-red spectrum of X shows a strong absorption at 1745 cm−1 but no absorption between 3200 cm−1 and 3650 cm−1.

The proton (1H) NMR spectrum of X is shown in Fig 8.1

Proton NMR spectrum with a quartet at 4.1 ppm, a singlet at 2.0 ppm, and a triplet at 1.3 ppm, displayed along a delta scale from 5 to 0 ppm.

Fig 8.1

State the name of the compound used as a reference standard in proton (1H) NMR spectroscopy and state two reasons why it is chosen for this purpose.

3b
6 marks

i) Using the IR data, identify the functional group present in X. Explain your answer.

[2]

ii) Use the proton (1H) NMR spectrum to deduce the structural formula of X.

Explain how you reached your conclusion by referring to the chemical shifts and splitting patterns of the peaks.

[4]

3c
3 marks

A different compound, Y, contains a halogen atom. The mass spectrum of Y shows two molecular ion peaks, M+ and [M+2]+, of approximately equal height (1:1 ratio).

i) State the identity of the halogen present in Y.

[1]

ii) Explain why the M+ and [M+2]+ peaks appear in this ratio.

[2]