Sketching Reciprocal Graphs (Edexcel A Level Maths: Pure): Revision Note
Exam code: 9MA0

Sketching reciprocal curves
What are reciprocal graphs?
Reciprocal graphs involve equations with an term on the denominator e.g.
There are two basic reciprocal graphs to know for A level
and
The second one of these is always positive

More reciprocal graphs
You also need to recognise graphs where the numerator is not one

The sign of a shows which part of the graph the curves are located
The size of a shows how steep the curves are
The closer a is to 0 the more L-shaped the curves are
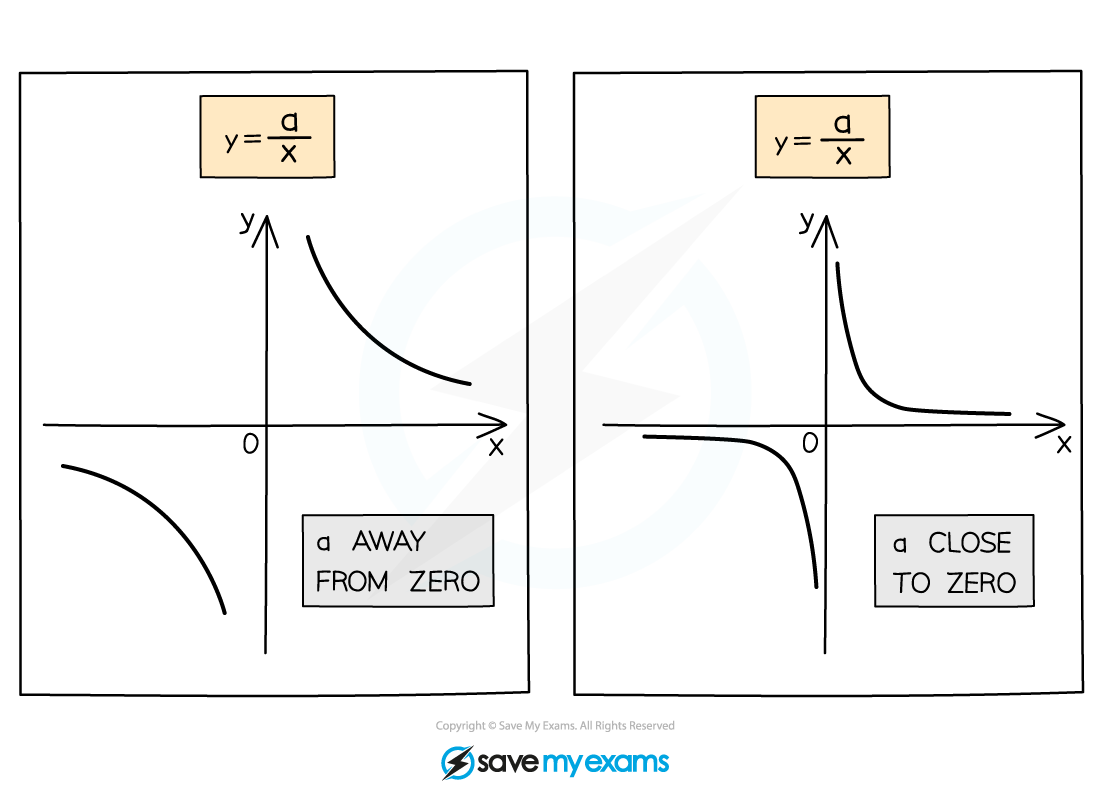
All have two asymptotes
horizontal, y = 0 (x-axis)
vertical, x = 0 (y-axis)
How do I sketch a reciprocal graph?

STEP 1
Use the sign of “a” to locate the curves and use the size of “a” to gauge the steepness of the curveSTEP 2
Sketch the graphSTEP 3
Label the points x = 1 and x = -1 as a guide to the scale of your graphSTEP 4
Draw asymptotes with dotted linesThese graphs do not intercept either axis
Graph transformations of them could cross the axes (see Translations)
Worked Example


Unlock more, it's free!
Join the 100,000+ Students that ❤️ Save My Exams
the (exam) results speak for themselves:

Was this revision note helpful?
Build on this topic
Questions students ask about Sketching Reciprocal Graphs
Real questions from students revising this topic on Save My Exams
What does the graph of y = 1/x³ look like?
y = 1/x³ has the same basic shape and sits in the same areas as y = 1/x: one curve top-right, one curve bottom-left.
- Why: x³ has the same sign as x, so y is positive when x > 0 and negative when x < 0 (odd power)
- Asymptotes: x = 0 (the y-axis) and y = 0 (the x-axis), exactly as for y = 1/x
- No intercepts: it never touches either axis
- Guide points: (1, 1) and (−1, −1)
How it differs from y = 1/x
- It approaches the asymptotes faster, so it looks more sharply L-shaped
- At x = 0.5: 1/x = 2 but 1/x³ = 8, so it climbs the y-axis more steeply
- At x = 2: 1/x = 0.5 but 1/x³ = 0.125, so it hugs the x-axis more closely
Pattern: odd powers (1/x, 1/x³) look like y = 1/x; even powers (1/x², 1/x⁴) look like y = 1/x², with both curves on the same side of the x-axis.
How do you find the vertical and horizontal asymptotes of a reciprocal graph?
For y = a/x and y = a/x² the asymptotes are always the axes: x = 0 and y = 0.
Vertical asymptote
- Find the value of x that makes the denominator zero — you cannot divide by zero, so the curve never reaches it
- As x gets close to that value, y shoots off towards ±∞
Horizontal asymptote
- Ask what y approaches as x gets very large, positive and negative
- a divided by a huge number gets closer and closer to 0, but never equals 0
Page example: y = −3/x²
- x² = 0 when x = 0, so the vertical asymptote is x = 0
- As x becomes very large, −3/x² → 0, so the horizontal asymptote is y = 0
- Draw both as dotted lines (Step 4)
Transformed graphs: ask the same two questions. For y = 3/(x − 2), x − 2 = 0 gives x = 2; for y = 4/x + 5, y approaches 5, so the horizontal asymptote is y = 5.
How does changing the value of a affect the graph of y = a/x?
The sign of a decides where the curves sit; the size of a decides how steep or L-shaped they are.
Sign of a
- a > 0: curves in the top-right and bottom-left areas
- a < 0: the graph is reflected, so the curves are top-left and bottom-right
- For y = a/x², a > 0 puts both curves above the x-axis, a < 0 puts both below it
Size of a
- The closer a is to 0, the more L-shaped the curves — they hug the axes
- The further a is from 0, the less L-shaped, and the curves sit further from the origin
What never changes
- The asymptotes are still x = 0 and y = 0, and the graph crosses neither axis
Page examples
- y = 6/x²: a = 6 > 0, so curves above the x-axis; 6 is large compared with 1, so less L-shaped. Label (1, 6) and (−1, 6)
- y = −3/x²: a negative, so curves below the x-axis, through (1, −3) and (−1, −3)