Trapezium Rule (Numerical Integration) (Edexcel A Level Maths: Pure): Revision Note
Exam code: 9MA0

Trapezium rule (numerical integration)
What is the trapezium rule?
The trapezium rule is a numerical method of integration used to find the approximate area under a curve
It can be used when analytical methods of integration won’t work
It finds an approximation of the area by finding the sum of the areas of trapeziums beneath the curve
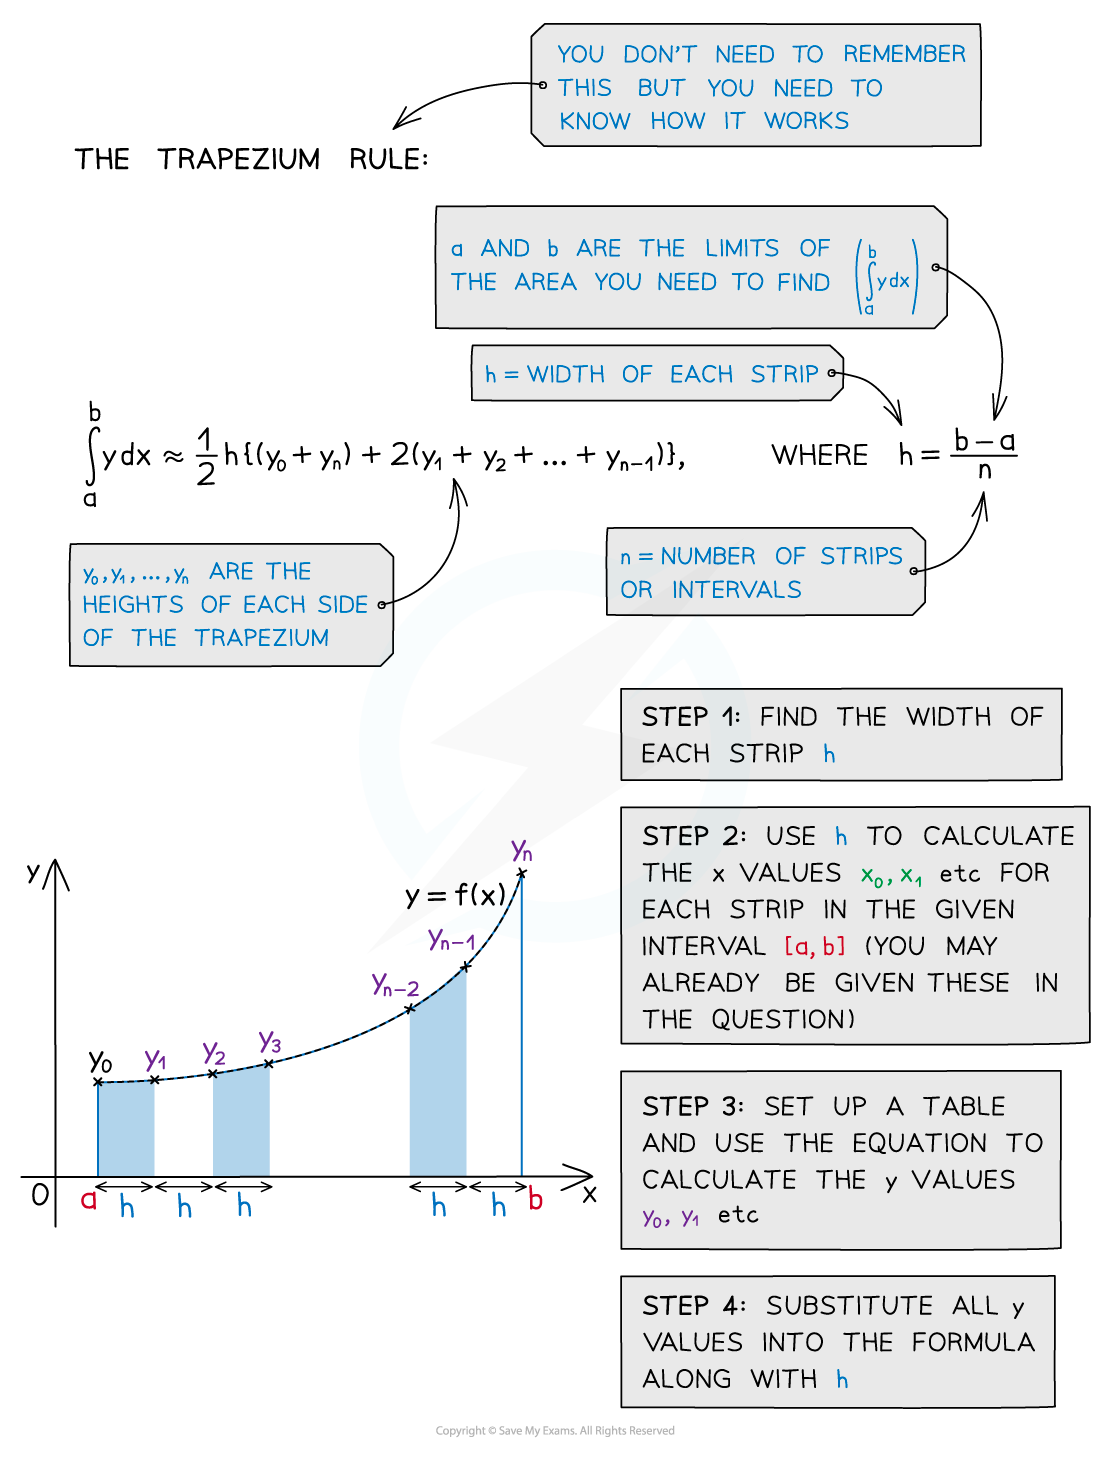
The formula for an estimate of the area when splitting it into n strips (trapeziums) is
where
If you have n strips then you need n + 1 y-values
How do I know if it is an underestimate or an overestimate?
Depending on the shape of the curve, the trapezium rule could be an underestimate or overestimate
The more trapezium strips used the more accurate the estimate
Calculating the percentage error can tell you how accurate your estimate is
Using rectangular strips can find the upper and lower bounds of the interval for the trapezium rule


Examiner Tips and Tricks
The formula for the trapezium rule is given in the formula booklet.
Worked Example


Unlock more, it's free!
Join the 100,000+ Students that ❤️ Save My Exams
the (exam) results speak for themselves:

Was this revision note helpful?
Build on this topic
Questions students ask about Trapezium Rule (Numerical Integration)
Real questions from students revising this topic on Save My Exams
How do you find n in the trapezium rule if it is not given in the question?
n is the number of strips (intervals), so if it is not stated you work it out from the strip width h or from the number of y-values you are given.
- The page's formula h = (b − a)/n rearranges to n = (b − a)/h
- If you are given a table of values, n is the number of gaps between the x-values: n strips always need n + 1 y-values, so n = (number of y-values) − 1
- Wording like "using 4 strips", "4 intervals" or "4 trapeziums" is giving you n directly
Example (the page’s question, ∫₀⁴ 6x²/(x³ + 2) dx): it states n = 4 and works out h = (4 − 0)/4 = 1, but if n had been left out you could recover it two ways.
- If you were instead told h = 1: n = (4 − 0)/1 = 4
- From its table of y-values at x = 0, 1, 2, 3, 4: that is 5 y-values, so n = 5 − 1 = 4
Both routes give n = 4, matching the worked example.
How do you substitute y-values into the trapezium rule formula?
Put the first and last y-values (y₀ and yₙ) in the first bracket, add up all the middle y-values and double them, then multiply everything by ½h.
The formula, which is in your formula booklet, is: ∫ₐᵇ y dx ≈ ½h{(y₀ + yₙ) + 2(y₁ + y₂ + ... + yₙ₋₁)}
- Find h = (b − a)/n
- Set up a table of x-values and use the equation to work out each y-value
- Ends: y₀ + yₙ, used once each
- Middles: add y₁ up to yₙ₋₁, then multiply that sum by 2
- Multiply the total by ½h
Page's example: ∫₀⁴ 6x²/(x³ + 2) dx with n = 4, so h = 1 and the y-values are 0, 2, 2.4, 1.862..., 1.454...
½ × 1 × (0 + 1.454... + 2(2 + 2.4 + 1.862...)) = ½(1.454... + 12.524...) = 6.989 (3 d.p.)
Keep the unrounded y-values in your calculator until the final answer.
How do you calculate the upper and lower bounds using rectangular strips?
Use rectangles of width h instead of trapeziums: for the lower bound every rectangle must sit below the curve, and for the upper bound every one must reach above it.
- Work out h = (b − a)/n and the y-values y₀, y₁, …, yₙ exactly as you would for the trapezium rule.
- In each strip, the lower-bound rectangle takes the smaller of the two y-values at its ends, and the upper-bound rectangle takes the larger.
- For a curve that increases across the whole interval, as in the diagram on this page:
- lower bound: area ≈ h(y₀ + y₁ + … + yₙ₋₁), the left-hand y-values, dropping the last one
- upper bound: area ≈ h(y₁ + y₂ + … + yₙ), the right-hand y-values, dropping the first one
- If the curve decreases across the whole interval, these two swap round.
For an increasing curve with n = 4 and h = 1, that gives a lower bound of 1 × (y₀ + y₁ + y₂ + y₃) and an upper bound of 1 × (y₁ + y₂ + y₃ + y₄), with the trapezium-rule estimate exactly halfway between them. Check the shape first: the curve in the worked example turns at about x = 1.59, so it is not increasing all the way and these two sums are not bounds for it.