Minima, Maxima & Points of Inflection (College Board AP® Precalculus): Study Guide

Local minima and maxima
What are local minima and maxima?
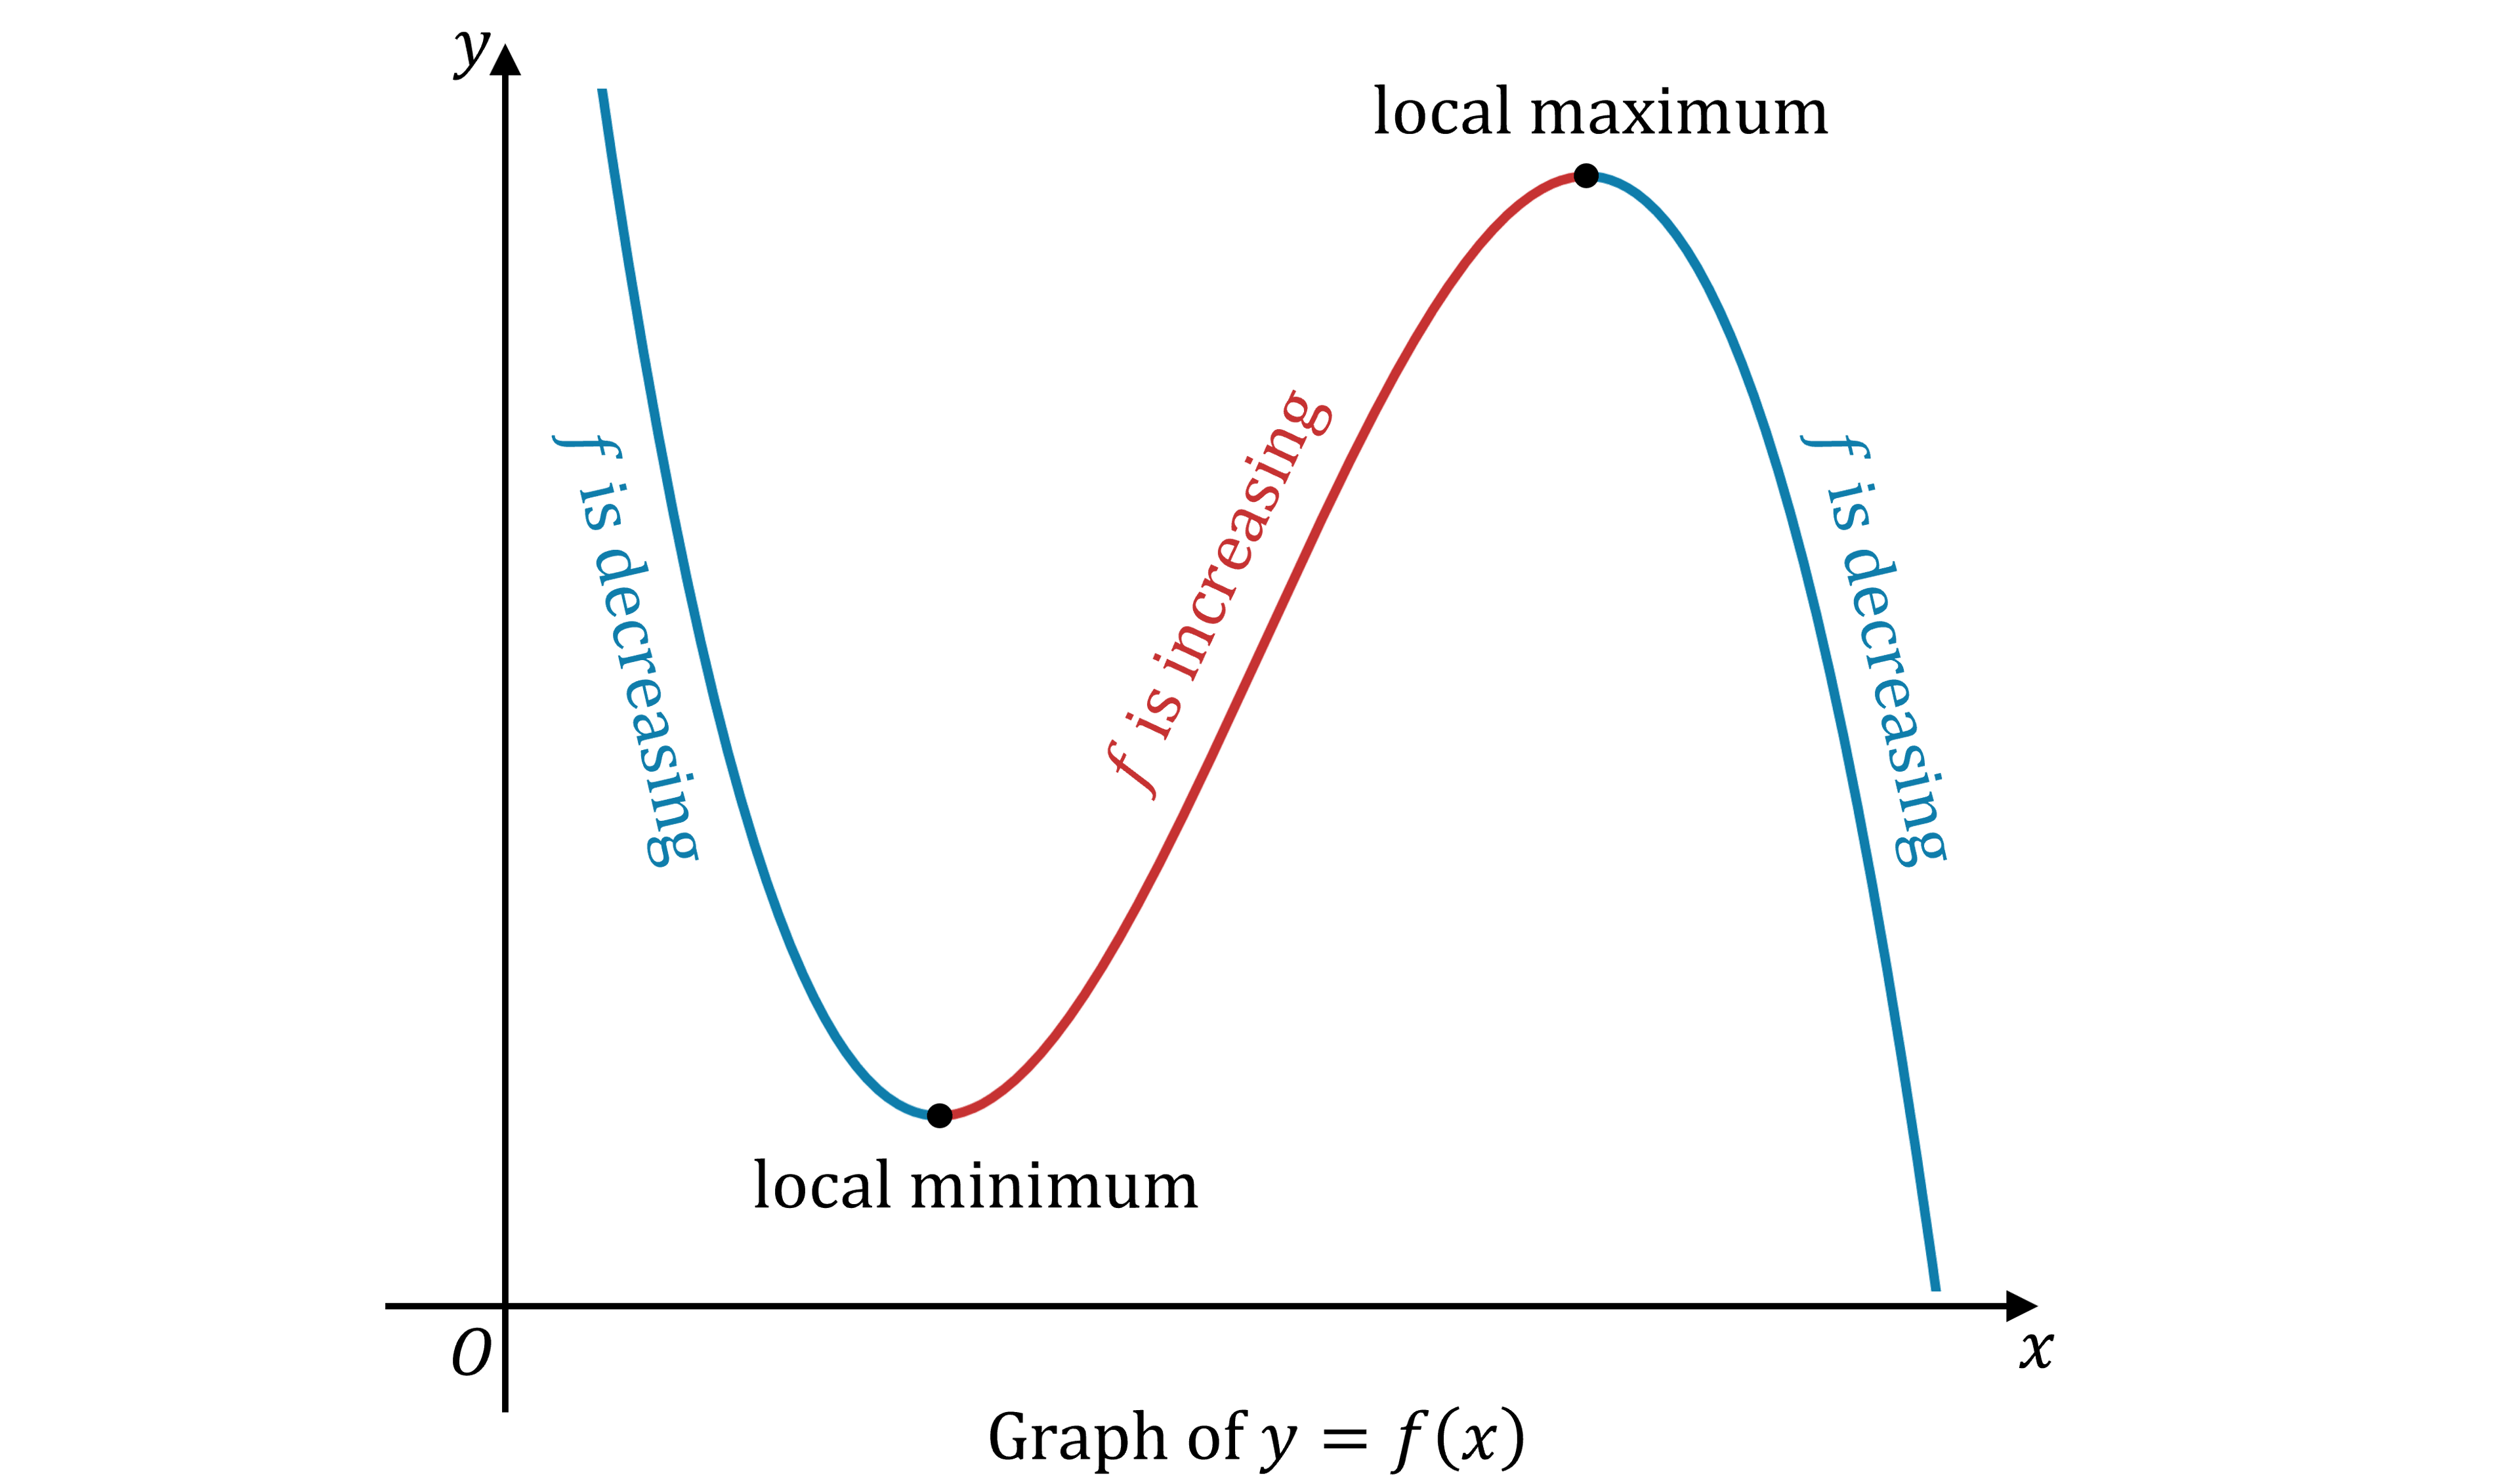
A polynomial function has a local (or relative) maximum at a point where the function switches from increasing to decreasing
The output value at that point is greater than the output values at all nearby points
On the graph, a local maximum appears as the top of a "hill"
A polynomial function has a local (or relative) minimum at a point where the function switches from decreasing to increasing
The output value at that point is less than the output values at all nearby points
On the graph, a local minimum appears as the bottom of a "valley"
Local maxima and minima are collectively called local extrema
A local extremum also occurs at an included endpoint of a polynomial with a restricted domain
I.e. if the domain is restricted to a closed interval
![[a,\, b]](data:image/svg+xml;charset=utf8,%3Csvg%20xmlns%3D%22http%3A%2F%2Fwww.w3.org%2F2000%2Fsvg%22%20xmlns%3Awrs%3D%22http%3A%2F%2Fwww.wiris.com%2Fxml%2Fmathml-extension%22%20height%3D%2222%22%20width%3D%2239%22%20wrs%3Abaseline%3D%2216%22%3E%3C!--MathML%3A%20%3Cmath%20xmlns%3D%22http%3A%2F%2Fwww.w3.org%2F1998%2FMath%2FMathML%22%3E%3Cmo%3E%5B%3C%2Fmo%3E%3Cmi%3Ea%3C%2Fmi%3E%3Cmo%3E%2C%3C%2Fmo%3E%3Cmo%3E%26%23x200A%3B%3C%2Fmo%3E%3Cmi%3Eb%3C%2Fmi%3E%3Cmo%3E%5D%3C%2Fmo%3E%3C%2Fmath%3E--%3E%3Cdefs%3E%3Cstyle%20type%3D%22text%2Fcss%22%3E%40font-face%7Bfont-family%3A'math1f7177163c833dff4b38fc8d287'%3Bsrc%3Aurl(data%3Afont%2Ftruetype%3Bcharset%3Dutf-8%3Bbase64%2CAAEAAAAMAIAAAwBAT1MvMi7iBBMAAADMAAAATmNtYXDEvmKUAAABHAAAADRjdnQgDVUNBwAAAVAAAAA6Z2x5ZoPi2VsAAAGMAAAAUmhlYWQQC2qxAAAB4AAAADZoaGVhCGsXSAAAAhgAAAAkaG10eE2rRkcAAAI8AAAACGxvY2EAHTwYAAACRAAAAAxtYXhwBT0FPgAAAlAAAAAgbmFtZaBxlY4AAAJwAAABn3Bvc3QB9wD6AAAEEAAAACBwcmVwa1uragAABDAAAAAUAAADSwGQAAUAAAQABAAAAAAABAAEAAAAAAAAAQEAAAAAAAAAAAAAAAAAAAAAAAAAAAAAAAAAAAAAACAgICAAAAAg1UADev96AAAD6ACWAAAAAAACAAEAAQAAABQAAwABAAAAFAAEACAAAAAEAAQAAQAAACz%2F%2FwAAACz%2F%2F%2F%2FVAAEAAAAAAAABVAMsAIABAABWACoCWAIeAQ4BLAIsAFoBgAKAAKAA1ACAAAAAAAAAACsAVQCAAKsA1QEAASsABwAAAAIAVQAAAwADqwADAAcAADMRIRElIREhVQKr%2FasCAP4AA6v8VVUDAAABAFX%2FZADVAIAACgAAMzUzFRQGByc%2BATdVgC8vGx4eAYB6PVEUKQ40MQAAAAEAAAABAADVeM5BXw889QADBAD%2F%2F%2F%2F%2F1joTc%2F%2F%2F%2F%2F%2FWOhNzAAD%2FIASAA6sAAAAKAAIAAQAAAAAAAQAAA%2Bj%2FagAAF3AAAP%2B2BIAAAQAAAAAAAAAAAAAAAAAAAAIDUgBVATMAVQAAAAAAAAAoAAAAUgABAAAAAgBeAAUAAAAAAAIAgAQAAAAAAAQAAN4AAAAAAAAAFQECAAAAAAAAAAEAEgAAAAAAAAAAAAIADgASAAAAAAAAAAMAMAAgAAAAAAAAAAQAEgBQAAAAAAAAAAUAFgBiAAAAAAAAAAYACQB4AAAAAAAAAAgAHACBAAEAAAAAAAEAEgAAAAEAAAAAAAIADgASAAEAAAAAAAMAMAAgAAEAAAAAAAQAEgBQAAEAAAAAAAUAFgBiAAEAAAAAAAYACQB4AAEAAAAAAAgAHACBAAMAAQQJAAEAEgAAAAMAAQQJAAIADgASAAMAAQQJAAMAMAAgAAMAAQQJAAQAEgBQAAMAAQQJAAUAFgBiAAMAAQQJAAYACQB4AAMAAQQJAAgAHACBAE0AYQB0AGgAIABGAG8AbgB0AFIAZQBnAHUAbABhAHIATQBhAHQAaABzACAARgBvAHIAIABNAG8AcgBlACAATQBhAHQAaAAgAEYAbwBuAHQATQBhAHQAaAAgAEYAbwBuAHQAVgBlAHIAcwBpAG8AbgAgADEALgAwTWF0aF9Gb250AE0AYQB0AGgAcwAgAEYAbwByACAATQBvAHIAZQAAAwAAAAAAAAH0APoAAAAAAAAAAAAAAAAAAAAAAAAAALkHEQAAjYUYALIAAAAVFBOxAAE%2F)format('truetype')%3Bfont-weight%3Anormal%3Bfont-style%3Anormal%3B%7D%3C%2Fstyle%3E%3C%2Fdefs%3E%3Ctext%20font-family%3D%22Times%20New%20Roman%22%20font-size%3D%2218%22%20text-anchor%3D%22middle%22%20x%3D%223.5%22%20y%3D%2216%22%3E%5B%3C%2Ftext%3E%3Ctext%20font-family%3D%22Times%20New%20Roman%22%20font-size%3D%2218%22%20font-style%3D%22italic%22%20text-anchor%3D%22middle%22%20x%3D%2210.5%22%20y%3D%2216%22%3Ea%3C%2Ftext%3E%3Ctext%20font-family%3D%22math1f7177163c833dff4b38fc8d287%22%20font-size%3D%2216%22%20text-anchor%3D%22middle%22%20x%3D%2217.5%22%20y%3D%2216%22%3E%2C%3C%2Ftext%3E%3Ctext%20font-family%3D%22Times%20New%20Roman%22%20font-size%3D%2218%22%20font-style%3D%22italic%22%20text-anchor%3D%22middle%22%20x%3D%2226.5%22%20y%3D%2216%22%3Eb%3C%2Ftext%3E%3Ctext%20font-family%3D%22Times%20New%20Roman%22%20font-size%3D%2218%22%20text-anchor%3D%22middle%22%20x%3D%2235.5%22%20y%3D%2216%22%3E%5D%3C%2Ftext%3E%3C%2Fsvg%3E) , then the function values at
, then the function values at format('truetype')%3Bfont-weight%3Anormal%3Bfont-style%3Anormal%3B%7D%3C%2Fstyle%3E%3C%2Fdefs%3E%3Ctext%20font-family%3D%22Times%20New%20Roman%22%20font-size%3D%2218%22%20font-style%3D%22italic%22%20text-anchor%3D%22middle%22%20x%3D%224.5%22%20y%3D%2216%22%3Ex%3C%2Ftext%3E%3Ctext%20font-family%3D%22math17f39f8317fbdb1988ef4c628eb%22%20font-size%3D%2216%22%20text-anchor%3D%22middle%22%20x%3D%2218.5%22%20y%3D%2216%22%3E%3D%3C%2Ftext%3E%3Ctext%20font-family%3D%22Times%20New%20Roman%22%20font-size%3D%2218%22%20font-style%3D%22italic%22%20text-anchor%3D%22middle%22%20x%3D%2231.5%22%20y%3D%2216%22%3Ea%3C%2Ftext%3E%3C%2Fsvg%3E) or
or format('truetype')%3Bfont-weight%3Anormal%3Bfont-style%3Anormal%3B%7D%3C%2Fstyle%3E%3C%2Fdefs%3E%3Ctext%20font-family%3D%22Times%20New%20Roman%22%20font-size%3D%2218%22%20font-style%3D%22italic%22%20text-anchor%3D%22middle%22%20x%3D%224.5%22%20y%3D%2216%22%3Ex%3C%2Ftext%3E%3Ctext%20font-family%3D%22math17f39f8317fbdb1988ef4c628eb%22%20font-size%3D%2216%22%20text-anchor%3D%22middle%22%20x%3D%2218.5%22%20y%3D%2216%22%3E%3D%3C%2Ftext%3E%3Ctext%20font-family%3D%22Times%20New%20Roman%22%20font-size%3D%2218%22%20font-style%3D%22italic%22%20text-anchor%3D%22middle%22%20x%3D%2231.5%22%20y%3D%2216%22%3Eb%3C%2Ftext%3E%3C%2Fsvg%3E) will be local extrema
will be local extrema
Examiner Tips and Tricks
Note that 'minimum', 'maximum' and 'extremum' are the singular forms. 'Minima', 'maxima' and 'extrema' are the plural forms.
What are global minima and maxima?
Global minima and maxima are defined as follows:
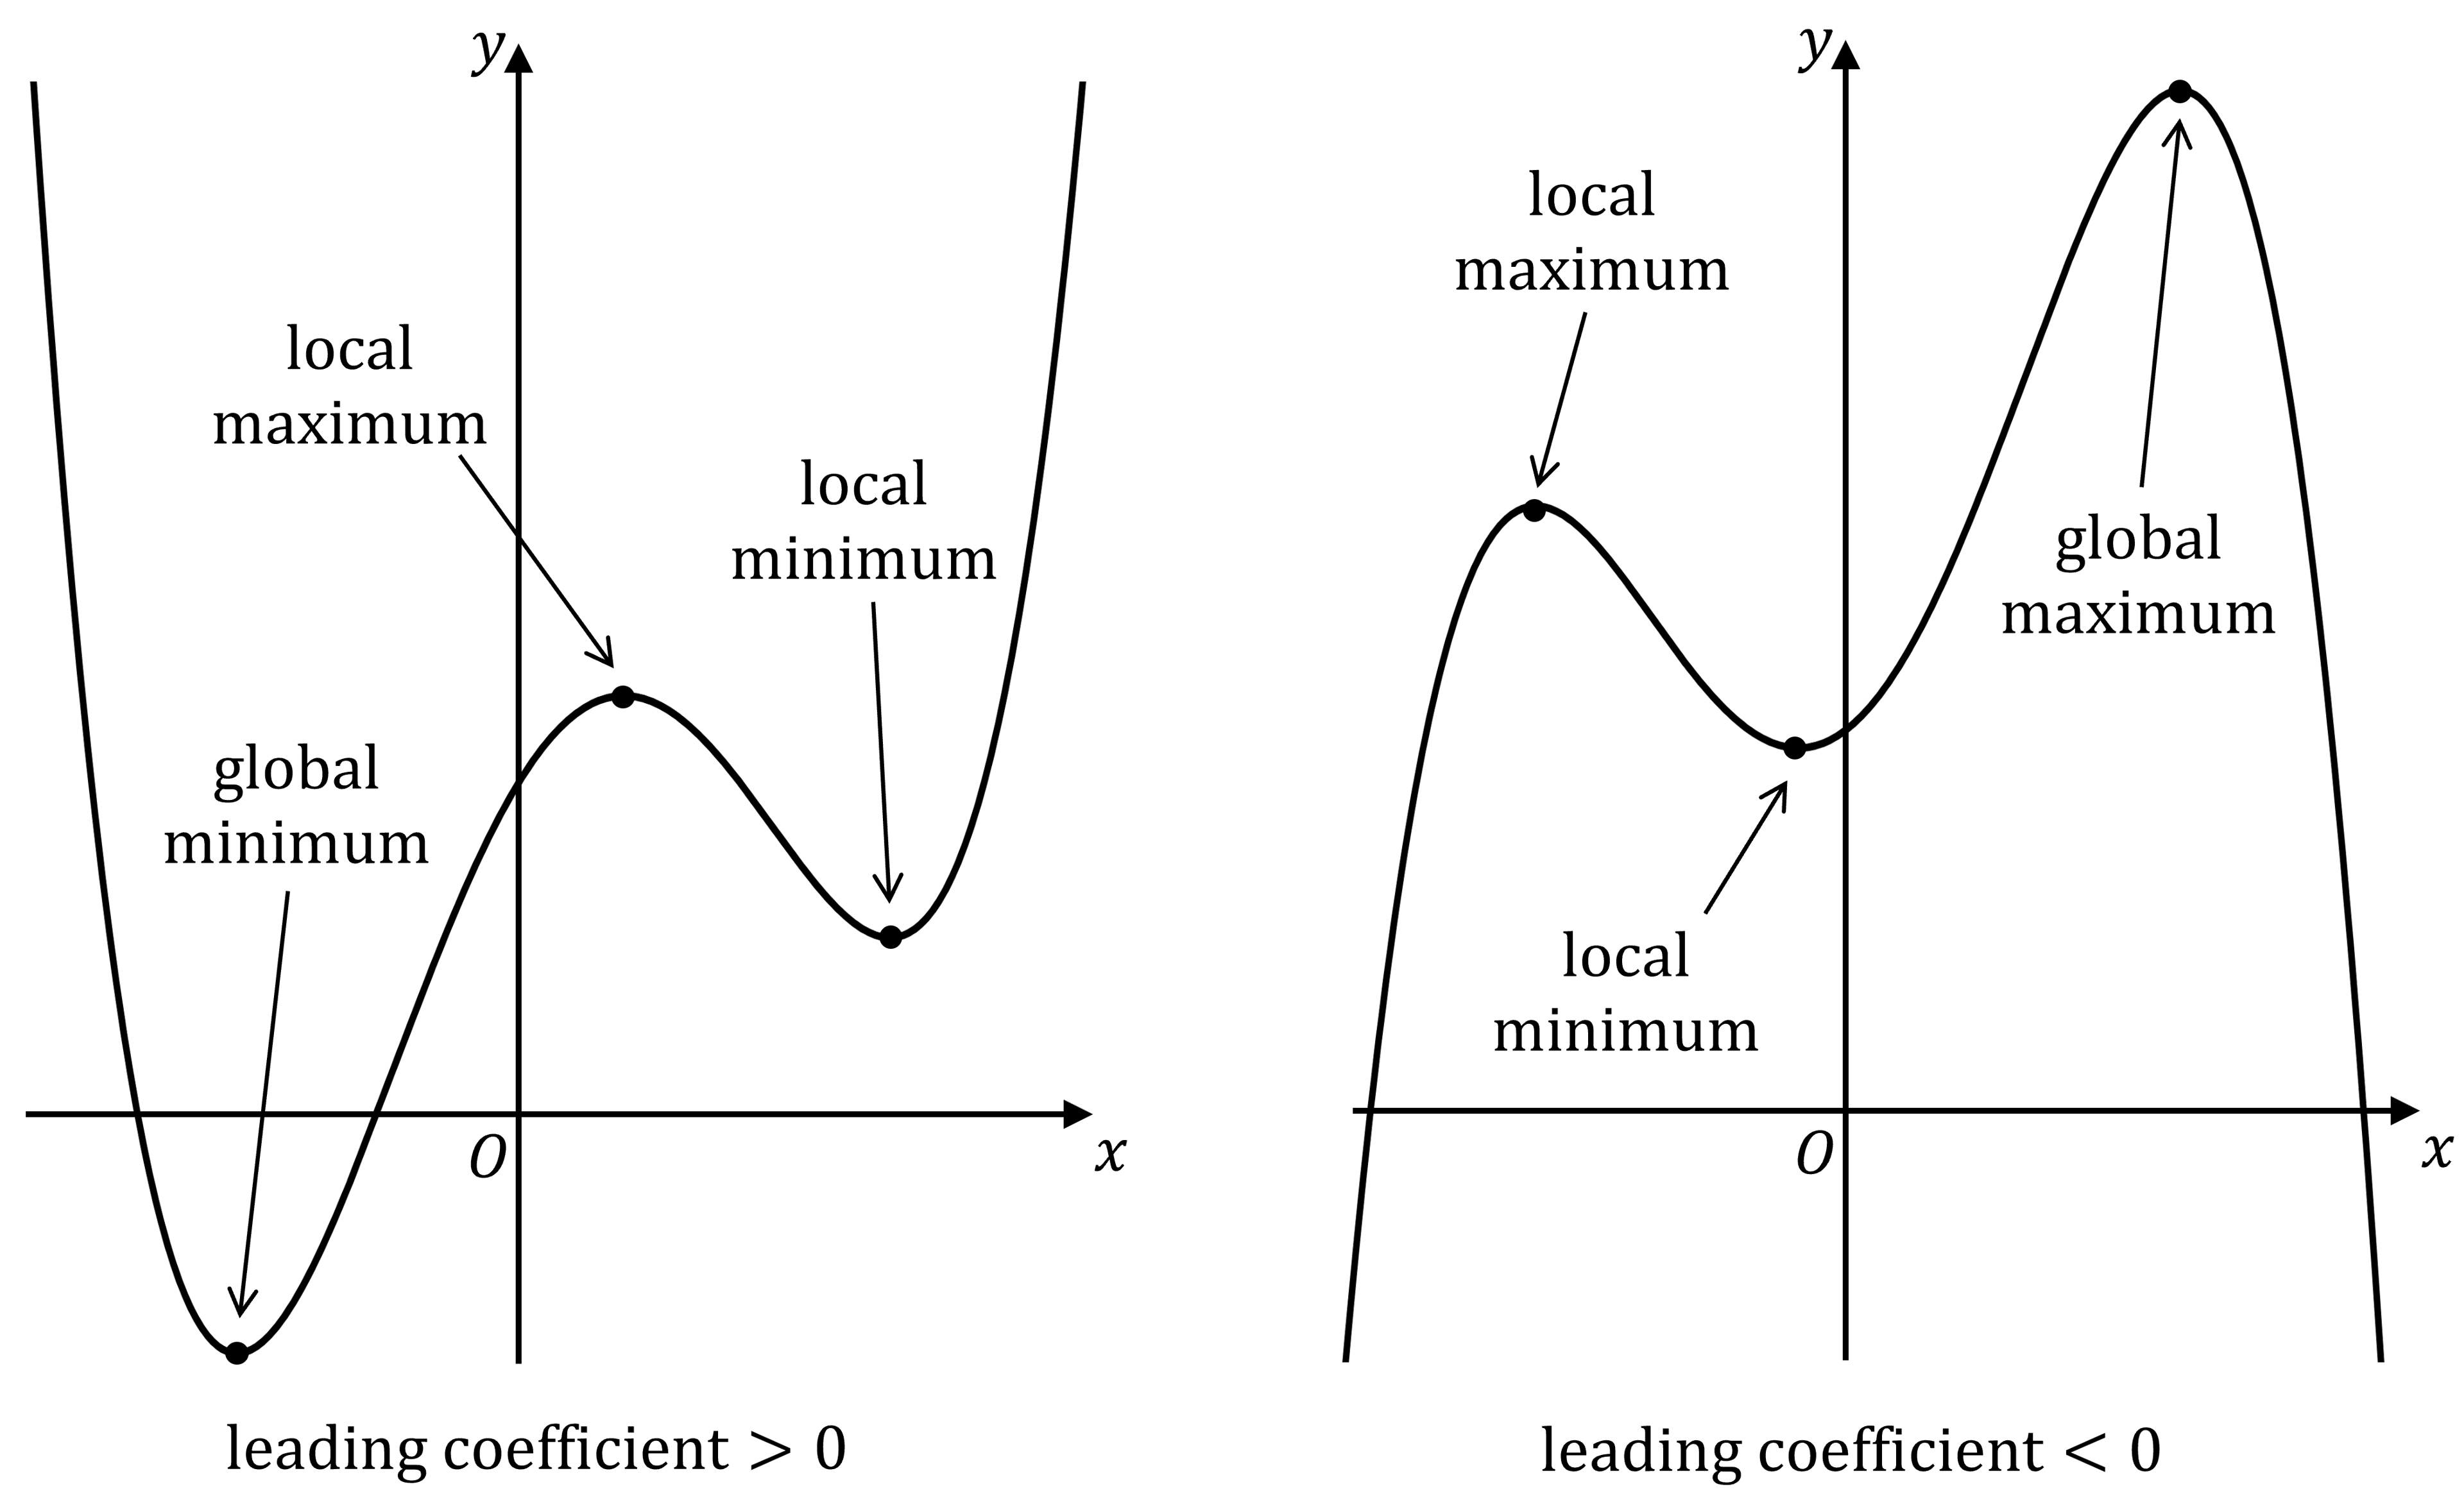
A global (or absolute) maximum is a local maximum whose output value is greater than every other output value of the function
A global (or absolute) minimum is a local minimum whose output value is less than every other output value of the function
Note that not every polynomial function has a global maximum or global minimum
E.g. a cubic function (or other odd degree polynomial) extends to
format('truetype')%3Bfont-weight%3Anormal%3Bfont-style%3Anormal%3B%7D%3C%2Fstyle%3E%3C%2Fdefs%3E%3Ctext%20font-family%3D%22math113932401f86416e52c77b91ea2%22%20font-size%3D%2216%22%20text-anchor%3D%22middle%22%20x%3D%226.5%22%20y%3D%2216%22%3E%2B%3C%2Ftext%3E%3Ctext%20font-family%3D%22math113932401f86416e52c77b91ea2%22%20font-size%3D%2216%22%20text-anchor%3D%22middle%22%20x%3D%2222.5%22%20y%3D%2216%22%3E%26%23x221E%3B%3C%2Ftext%3E%3C%2Fsvg%3E) in one direction and
in one direction and format('truetype')%3Bfont-weight%3Anormal%3Bfont-style%3Anormal%3B%7D%3C%2Fstyle%3E%3C%2Fdefs%3E%3Ctext%20font-family%3D%22math11c7de139cdcfeb650a17967e57%22%20font-size%3D%2216%22%20text-anchor%3D%22middle%22%20x%3D%226.5%22%20y%3D%2216%22%3E%26%23x2212%3B%3C%2Ftext%3E%3Ctext%20font-family%3D%22math11c7de139cdcfeb650a17967e57%22%20font-size%3D%2216%22%20text-anchor%3D%22middle%22%20x%3D%2222.5%22%20y%3D%2216%22%3E%26%23x221E%3B%3C%2Ftext%3E%3C%2Fsvg%3E) in the other, so it has no global maximum or minimum
in the other, so it has no global maximum or minimum
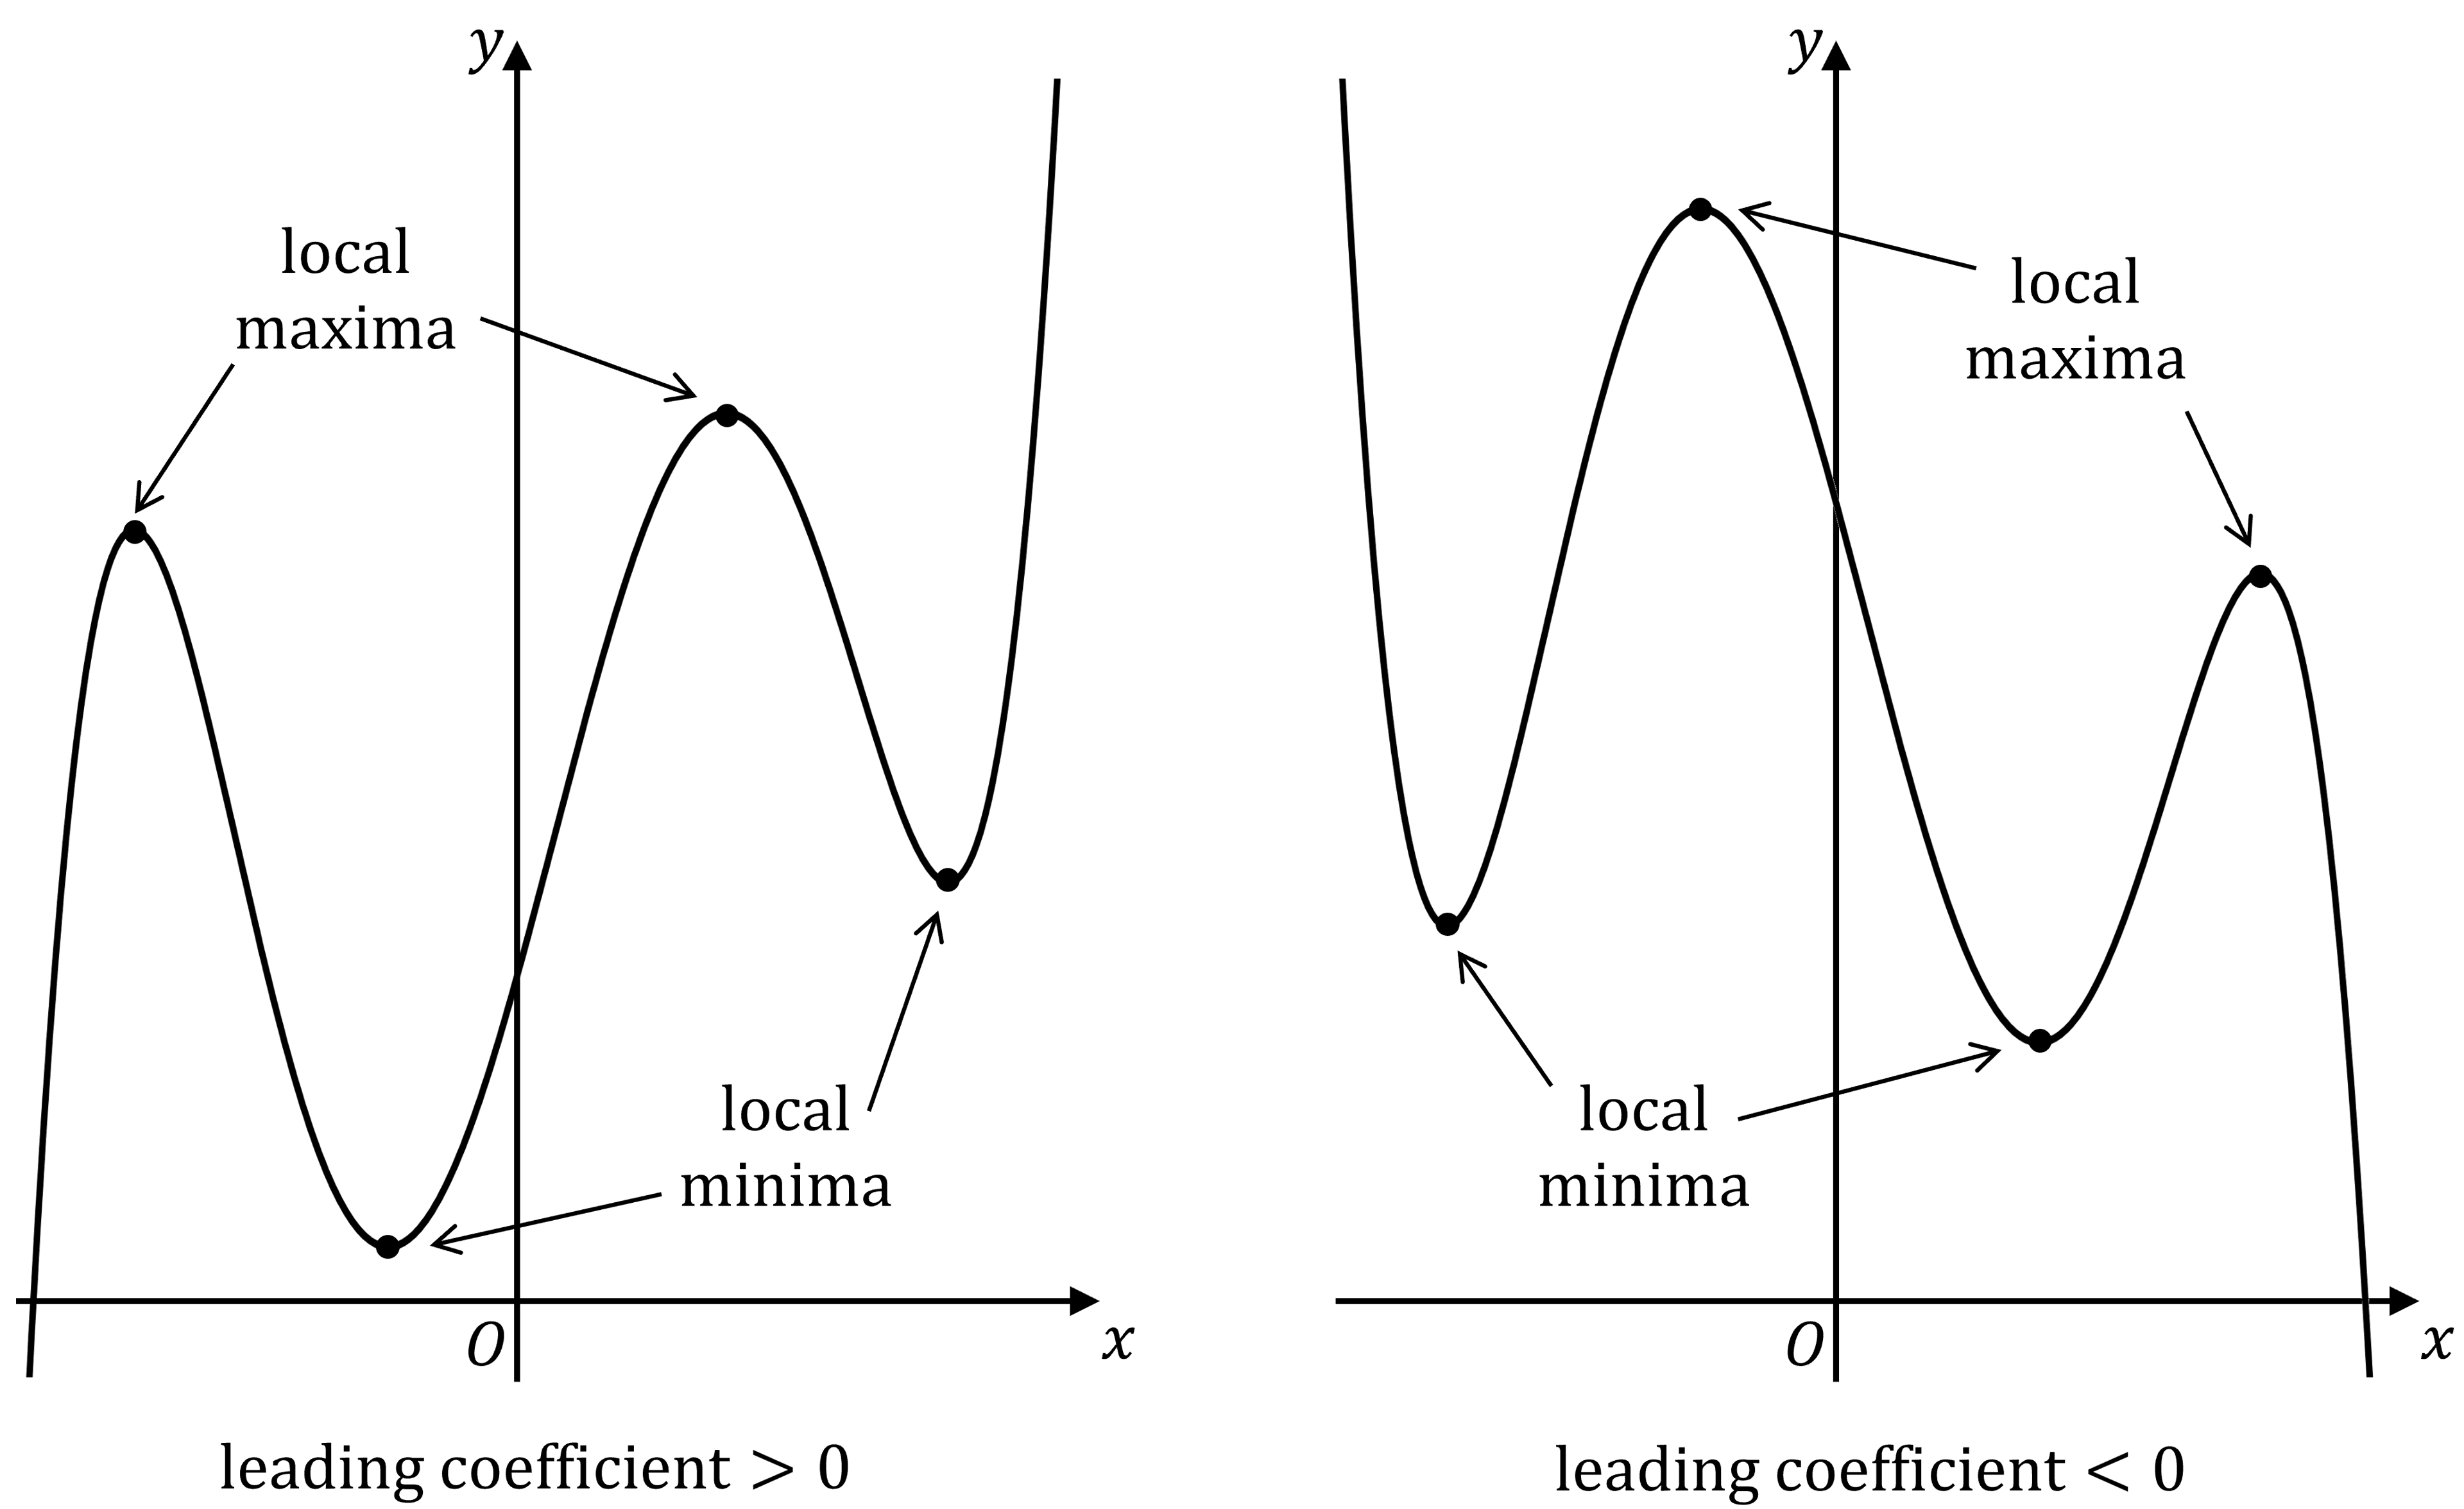
However, polynomial functions of even degree will always have either a global maximum or a global minimum
If the leading coefficient is positive (parabola opens upward, or similar shape for higher even degrees), the function has a global minimum
If the leading coefficient is negative (parabola opens downward, or similar shape for higher even degrees), the function has a global maximum
What is the relationship between zeros and local extrema?
Between every two distinct real zeros of a nonconstant polynomial function
there must be at least one input value corresponding to a local maximum or local minimum
This makes sense graphically
If the graph crosses (or touches) the
 -axis at two different points, it must turn around at least once between them
This is a useful fact for sketching and reasoning about polynomial graphs
E.g. if a polynomial has zeros at
format('truetype')%3Bfont-weight%3Anormal%3Bfont-style%3Anormal%3B%7D%3C%2Fstyle%3E%3C%2Fdefs%3E%3Ctext%20font-family%3D%22Times%20New%20Roman%22%20font-size%3D%2218%22%20font-style%3D%22italic%22%20text-anchor%3D%22middle%22%20x%3D%224.5%22%20y%3D%2216%22%3Ex%3C%2Ftext%3E%3Ctext%20font-family%3D%22math143f4d31b04031e49f5eb18baba%22%20font-size%3D%2216%22%20text-anchor%3D%22middle%22%20x%3D%2218.5%22%20y%3D%2216%22%3E%3D%3C%2Ftext%3E%3Ctext%20font-family%3D%22math143f4d31b04031e49f5eb18baba%22%20font-size%3D%2216%22%20text-anchor%3D%22middle%22%20x%3D%2235.5%22%20y%3D%2216%22%3E%26%23x2212%3B%3C%2Ftext%3E%3Ctext%20font-family%3D%22Times%20New%20Roman%22%20font-size%3D%2218%22%20text-anchor%3D%22middle%22%20x%3D%2248.5%22%20y%3D%2216%22%3E2%3C%2Ftext%3E%3C%2Fsvg%3E) and
and format('truetype')%3Bfont-weight%3Anormal%3Bfont-style%3Anormal%3B%7D%3C%2Fstyle%3E%3C%2Fdefs%3E%3Ctext%20font-family%3D%22Times%20New%20Roman%22%20font-size%3D%2218%22%20font-style%3D%22italic%22%20text-anchor%3D%22middle%22%20x%3D%224.5%22%20y%3D%2216%22%3Ex%3C%2Ftext%3E%3Ctext%20font-family%3D%22math17f39f8317fbdb1988ef4c628eb%22%20font-size%3D%2216%22%20text-anchor%3D%22middle%22%20x%3D%2218.5%22%20y%3D%2216%22%3E%3D%3C%2Ftext%3E%3Ctext%20font-family%3D%22Times%20New%20Roman%22%20font-size%3D%2218%22%20text-anchor%3D%22middle%22%20x%3D%2231.5%22%20y%3D%2216%22%3E3%3C%2Ftext%3E%3C%2Fsvg%3E)
then there must be at least one local maximum or local minimum for some value of
between format('truetype')%3Bfont-weight%3Anormal%3Bfont-style%3Anormal%3B%7D%3C%2Fstyle%3E%3C%2Fdefs%3E%3Ctext%20font-family%3D%22math1da40657c9fece7e48d30af42d3%22%20font-size%3D%2216%22%20text-anchor%3D%22middle%22%20x%3D%226.5%22%20y%3D%2216%22%3E%26%23x2212%3B%3C%2Ftext%3E%3Ctext%20font-family%3D%22Times%20New%20Roman%22%20font-size%3D%2218%22%20text-anchor%3D%22middle%22%20x%3D%2217.5%22%20y%3D%2216%22%3E2%3C%2Ftext%3E%3C%2Fsvg%3E) and
and 
Worked Example
The rate of people entering a train station on a particular day is modeled by the function ![]() , where
, where ![]() for
for ![]() .
. ![]() is measured in people per hour, and
is measured in people per hour, and ![]() is measured in hours since the train station opened for the day. Based on the model, at what value of
is measured in hours since the train station opened for the day. Based on the model, at what value of ![]() does the rate of people entering the train station change from decreasing to increasing?
does the rate of people entering the train station change from decreasing to increasing?
(A) ![]()
(B) ![]()
(C) ![]()
(D) ![]()
Answer:
A change from decreasing to increasing occurs at a local minimum point of a function
Use your graphing calculator to draw the graph of the function
and identify the input value at the local minimum point
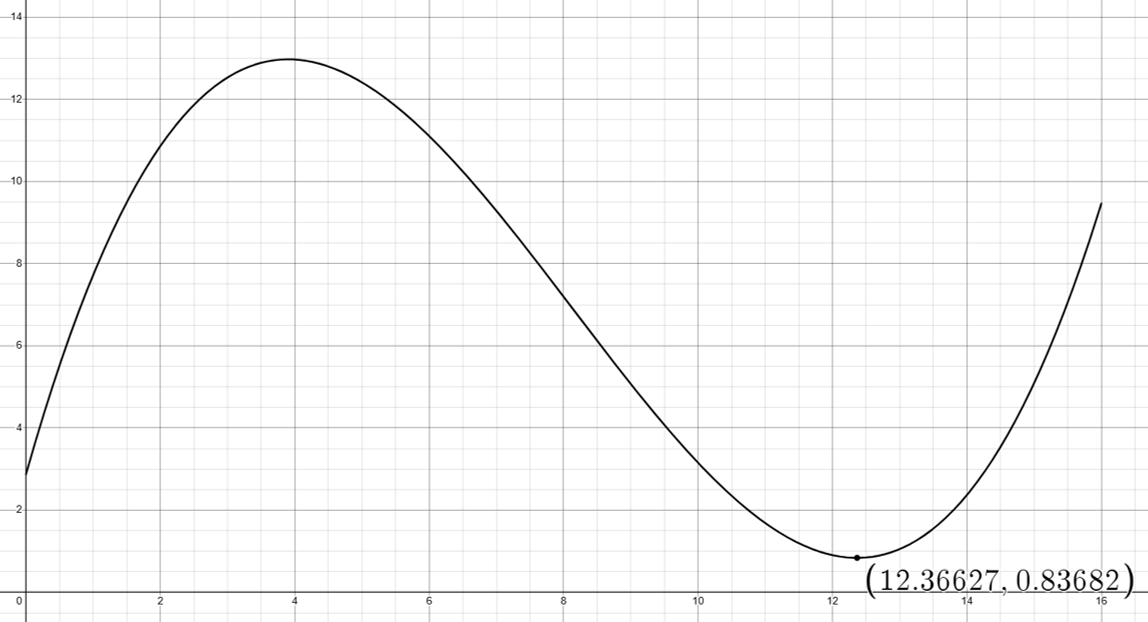
To 3 decimal places, the local minimum occurs when
format('truetype')%3Bfont-weight%3Anormal%3Bfont-style%3Anormal%3B%7D%3C%2Fstyle%3E%3C%2Fdefs%3E%3Ctext%20font-family%3D%22Times%20New%20Roman%22%20font-size%3D%2218%22%20font-style%3D%22italic%22%20text-anchor%3D%22middle%22%20x%3D%222.5%22%20y%3D%2216%22%3Et%3C%2Ftext%3E%3Ctext%20font-family%3D%22math11824c643d1feb4da18b28ed527%22%20font-size%3D%2216%22%20text-anchor%3D%22middle%22%20x%3D%2214.5%22%20y%3D%2216%22%3E%3D%3C%2Ftext%3E%3Ctext%20font-family%3D%22Times%20New%20Roman%22%20font-size%3D%2218%22%20text-anchor%3D%22middle%22%20x%3D%2232.5%22%20y%3D%2216%22%3E12%3C%2Ftext%3E%3Ctext%20font-family%3D%22math11824c643d1feb4da18b28ed527%22%20font-size%3D%2216%22%20text-anchor%3D%22middle%22%20x%3D%2243.5%22%20y%3D%2216%22%3E.%3C%2Ftext%3E%3Ctext%20font-family%3D%22Times%20New%20Roman%22%20font-size%3D%2218%22%20text-anchor%3D%22middle%22%20x%3D%2259.5%22%20y%3D%2216%22%3E366%3C%2Ftext%3E%3C%2Fsvg%3E)
(B) ![]()
Points of inflection
What is a point of inflection?
A polynomial function has a point of inflection at an input value where
the rate of change of the function
changes from increasing to decreasing or from decreasing to increasing
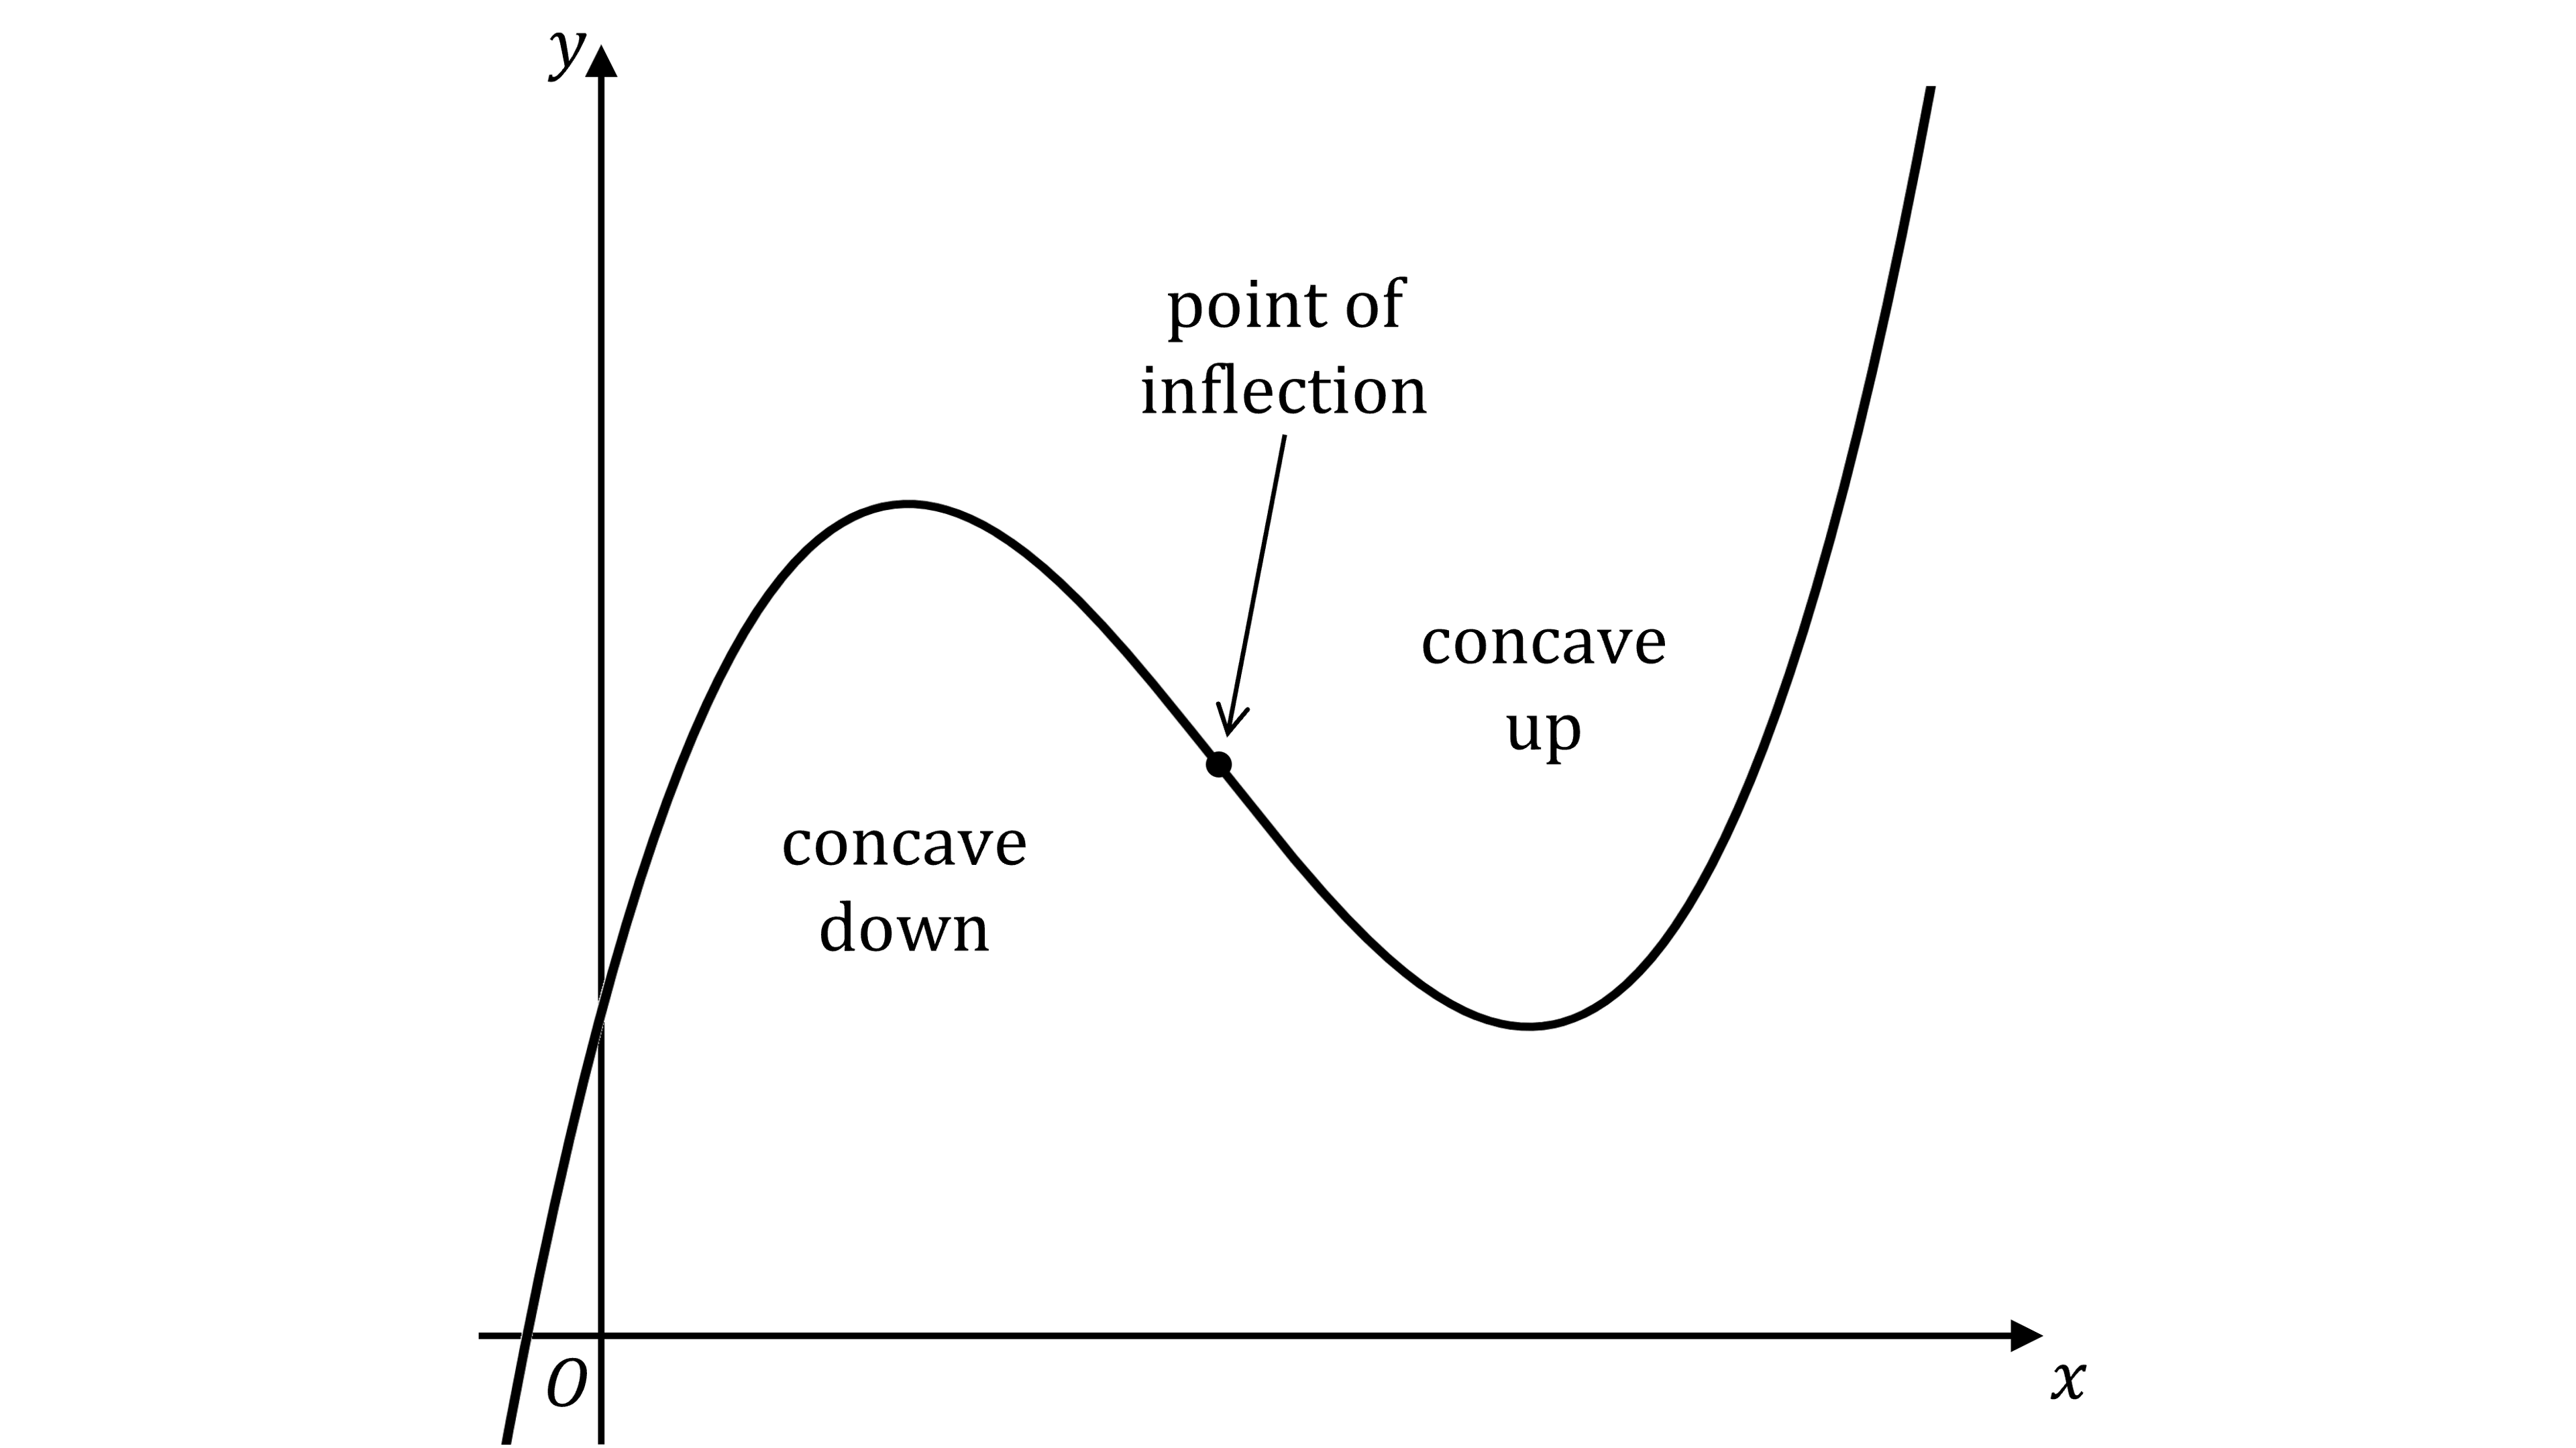
In terms of the function's graph, this is where the graph changes from concave up to concave down, or from concave down to concave up
Recall from the Concavity study guide that
Concave up means the rate of change is increasing (the graph curves upward)
Concave down means the rate of change is decreasing (the graph curves downward)
At a point of inflection, the direction of the curvature changes
The graph changes from "holding water" to "spilling water", or vice versa
How can I identify a point of inflection on a graph?
Look for where the curvature of the graph changes direction
The graph changes from bending one way to bending the other way
A point of inflection is not a maximum or minimum
The function does not need to switch between increasing and decreasing at a point of inflection
The function can be increasing (or decreasing) on both sides of a point of inflection
What changes is how quickly it is increasing or decreasing
I.e. whether the rate of change is speeding up or slowing down
How do points of inflection relate to local extrema?
Points of inflection and local extrema describe different features of a polynomial's graph
Local extrema occur where the function switches between increasing and decreasing
Points of inflection occur where the rate of change of the function switches between increasing and decreasing (i.e. where concavity changes)
For higher-degree polynomials, points of inflection often occur between local maxima and local minima
E.g. for a cubic polynomial with one local maximum and one local minimum, there is a point of inflection between them where the concavity changes
Worked Example
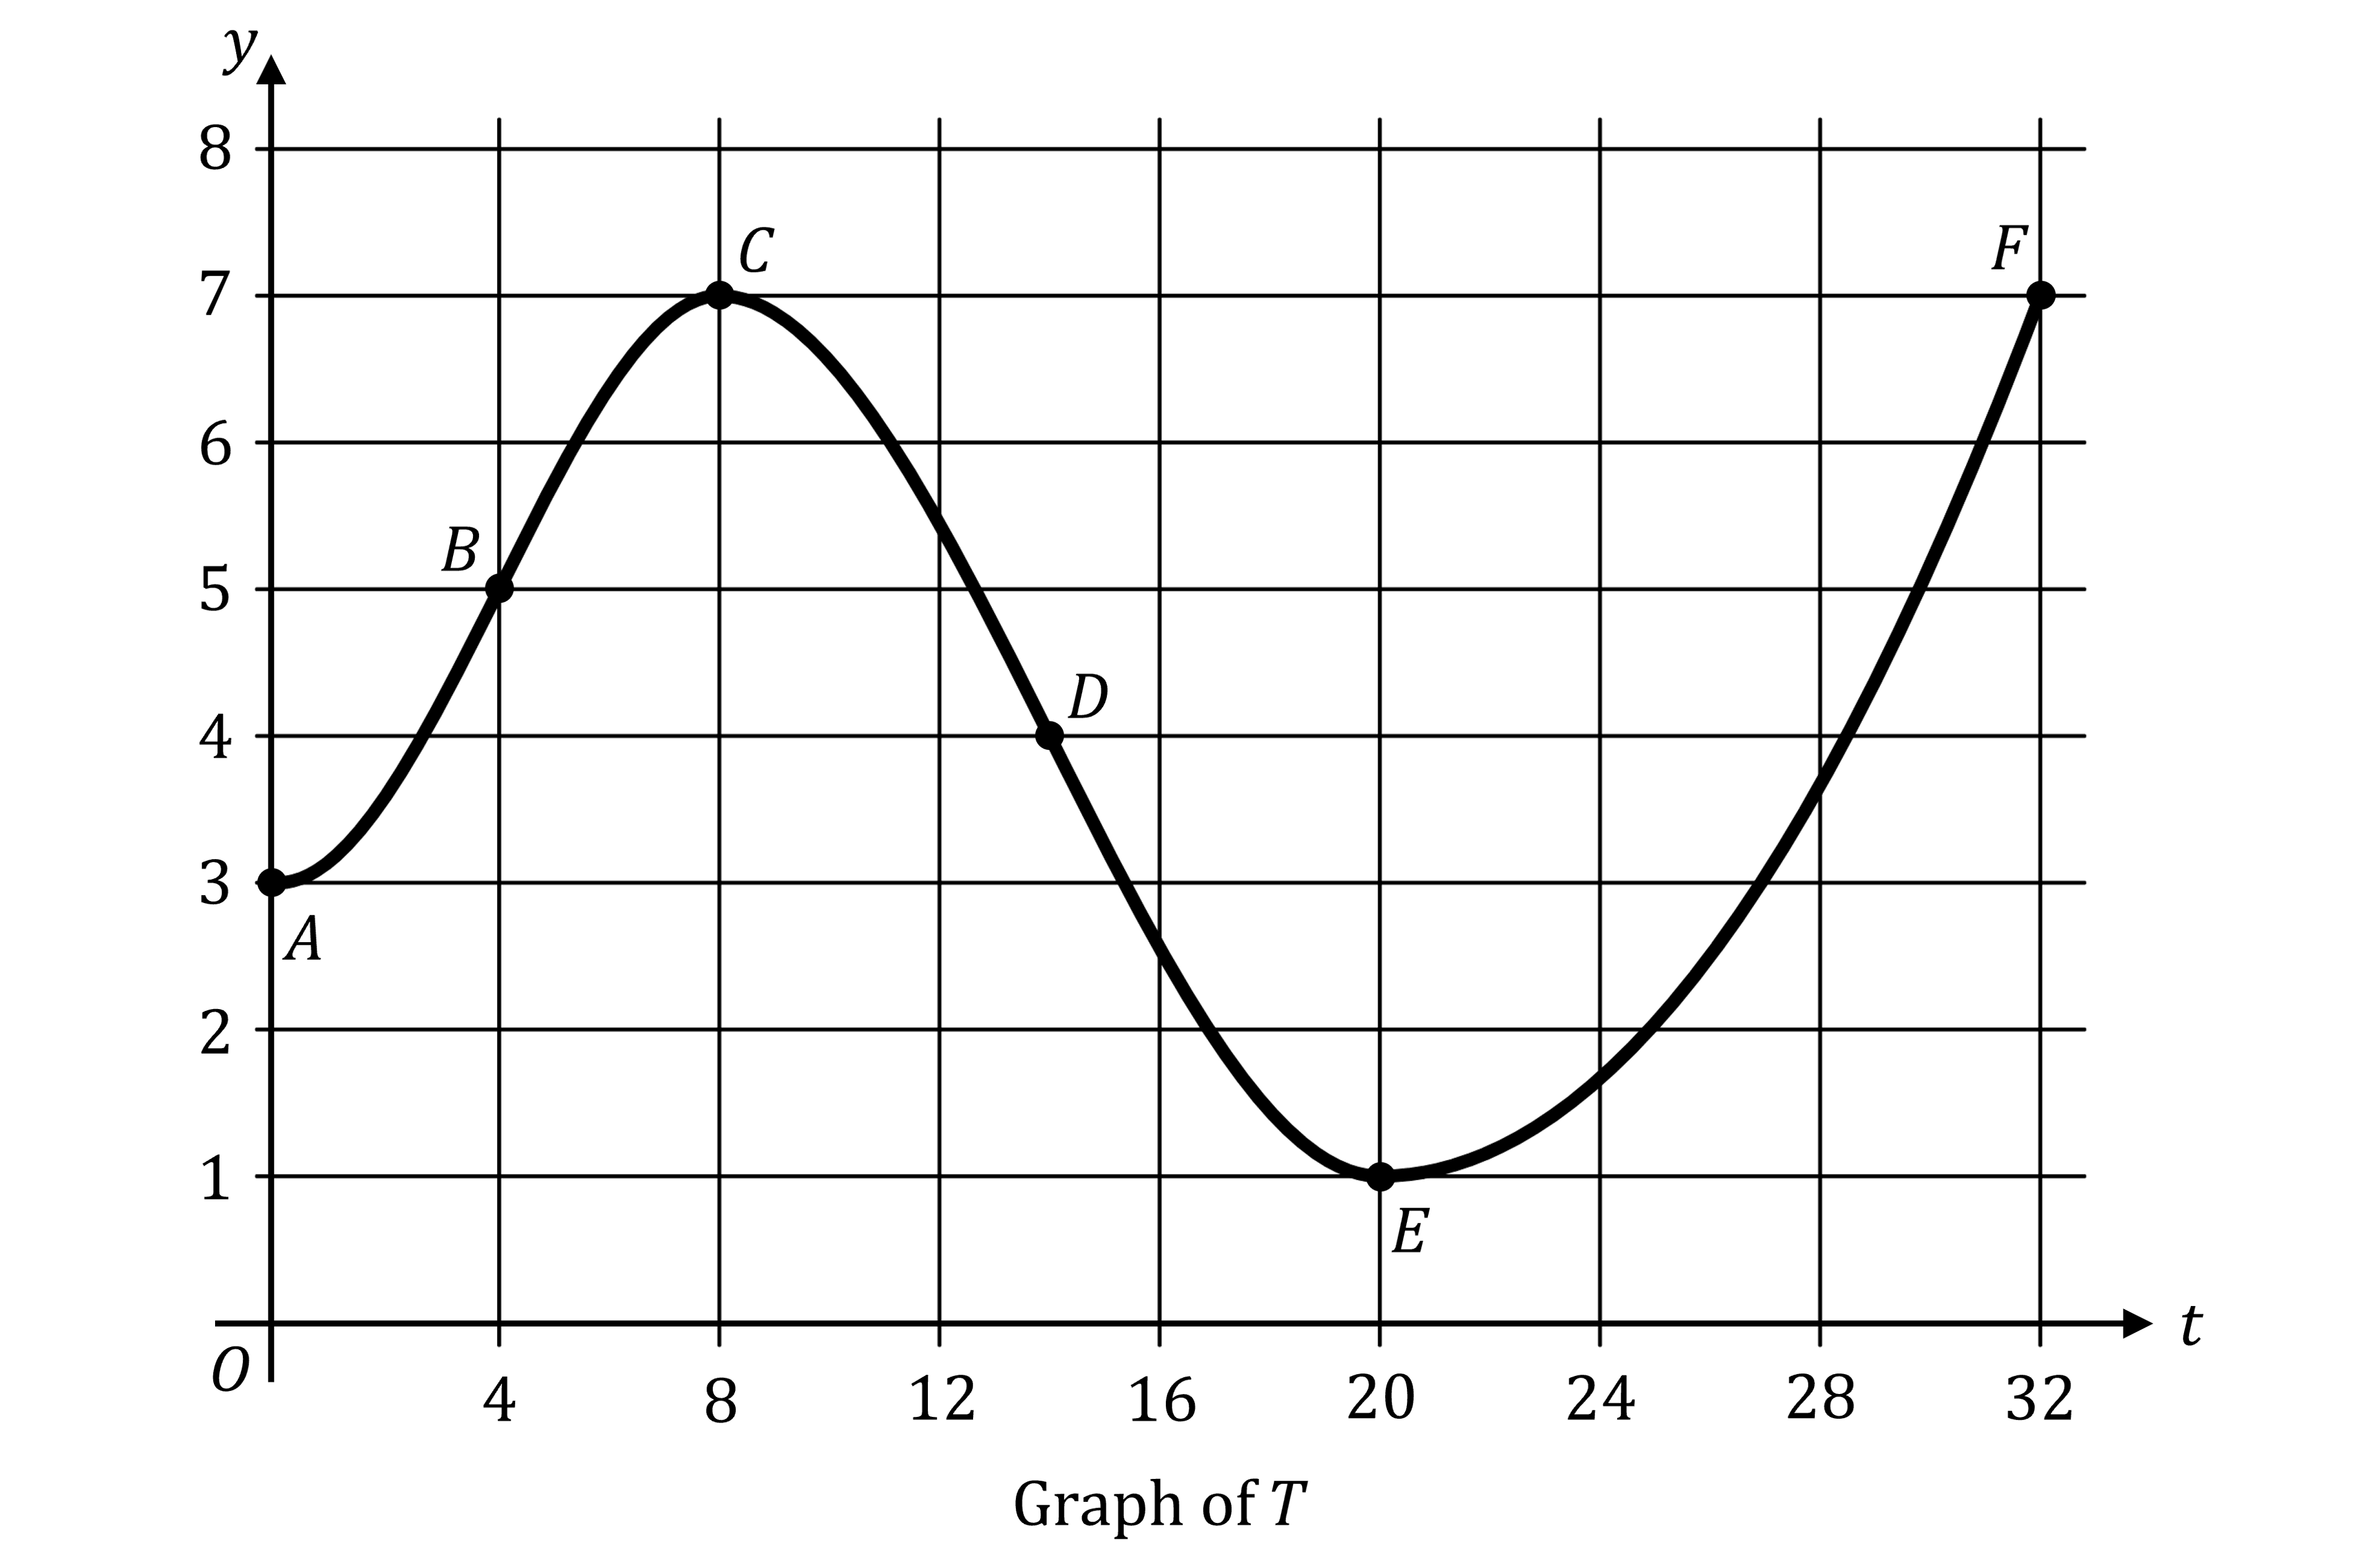
The temperature, in degrees Celsius, at a weather station is modeled by a function ![]() . The graph of
. The graph of ![]() is shown for
is shown for ![]() , where
, where ![]() is the number of hours since midnight.
is the number of hours since midnight.
Which points on the graph represent points of inflection?
(A) ![]() only
only
(B) ![]() and
and ![]()
(C) ![]() and
and ![]()
(D) ![]() ,
, ![]() ,
, ![]() and
and ![]()
Answer:
Look for places where the concavity of the graph changes
The graph is concave up between
 and
and 
concave down between
and 
and it is concave up between
and 
So the concavity changes at points ![]() and
and ![]()
(B) ![]() and
and ![]()

Unlock more, it's free!
Join the 100,000+ Students that ❤️ Save My Exams
the (exam) results speak for themselves:

Was this revision note helpful?
