Vertical & Horizontal Translations (College Board AP® Precalculus): Study Guide

Vertical translations
What are graph translations?
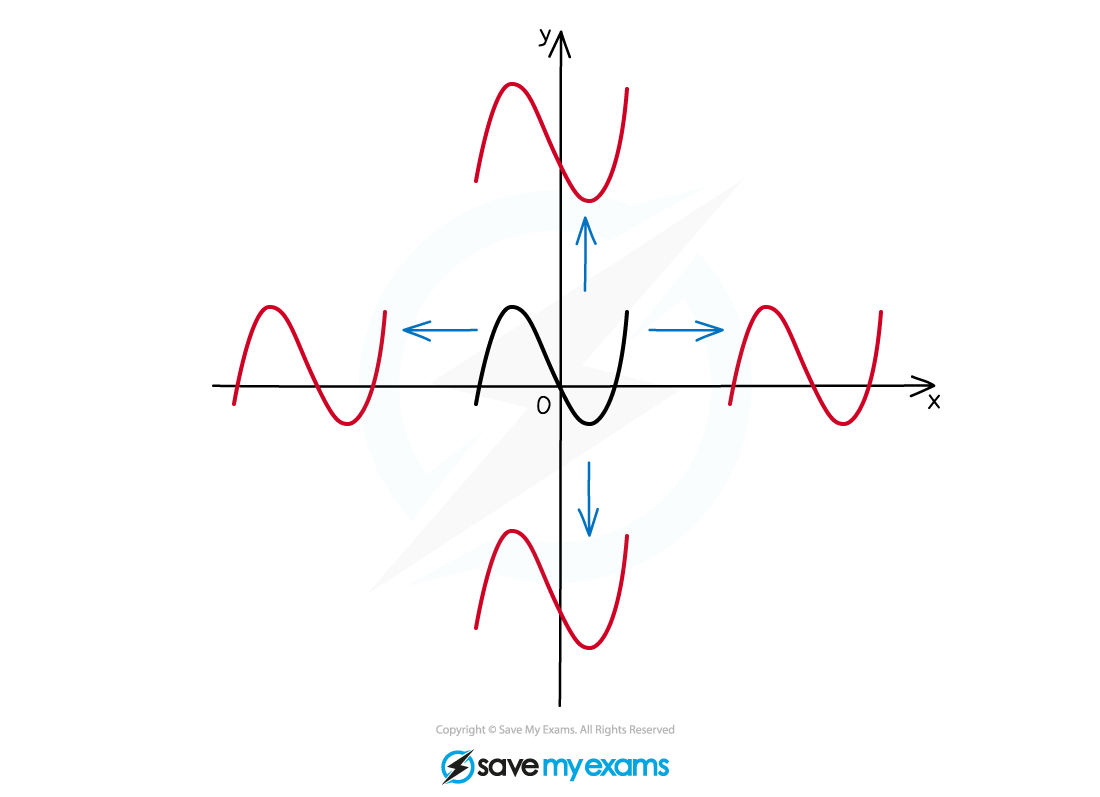
When you alter a function in certain ways, the effects on the graph of the function can be described by geometrical transformations
With a translation the shape, size, and orientation of the graph remain unchanged
the graph is merely shifted (up or down, left or right) in the xy plane
What is a vertical translation?
If you start with a function and add a constant to the output
the new function is called an additive transformation of
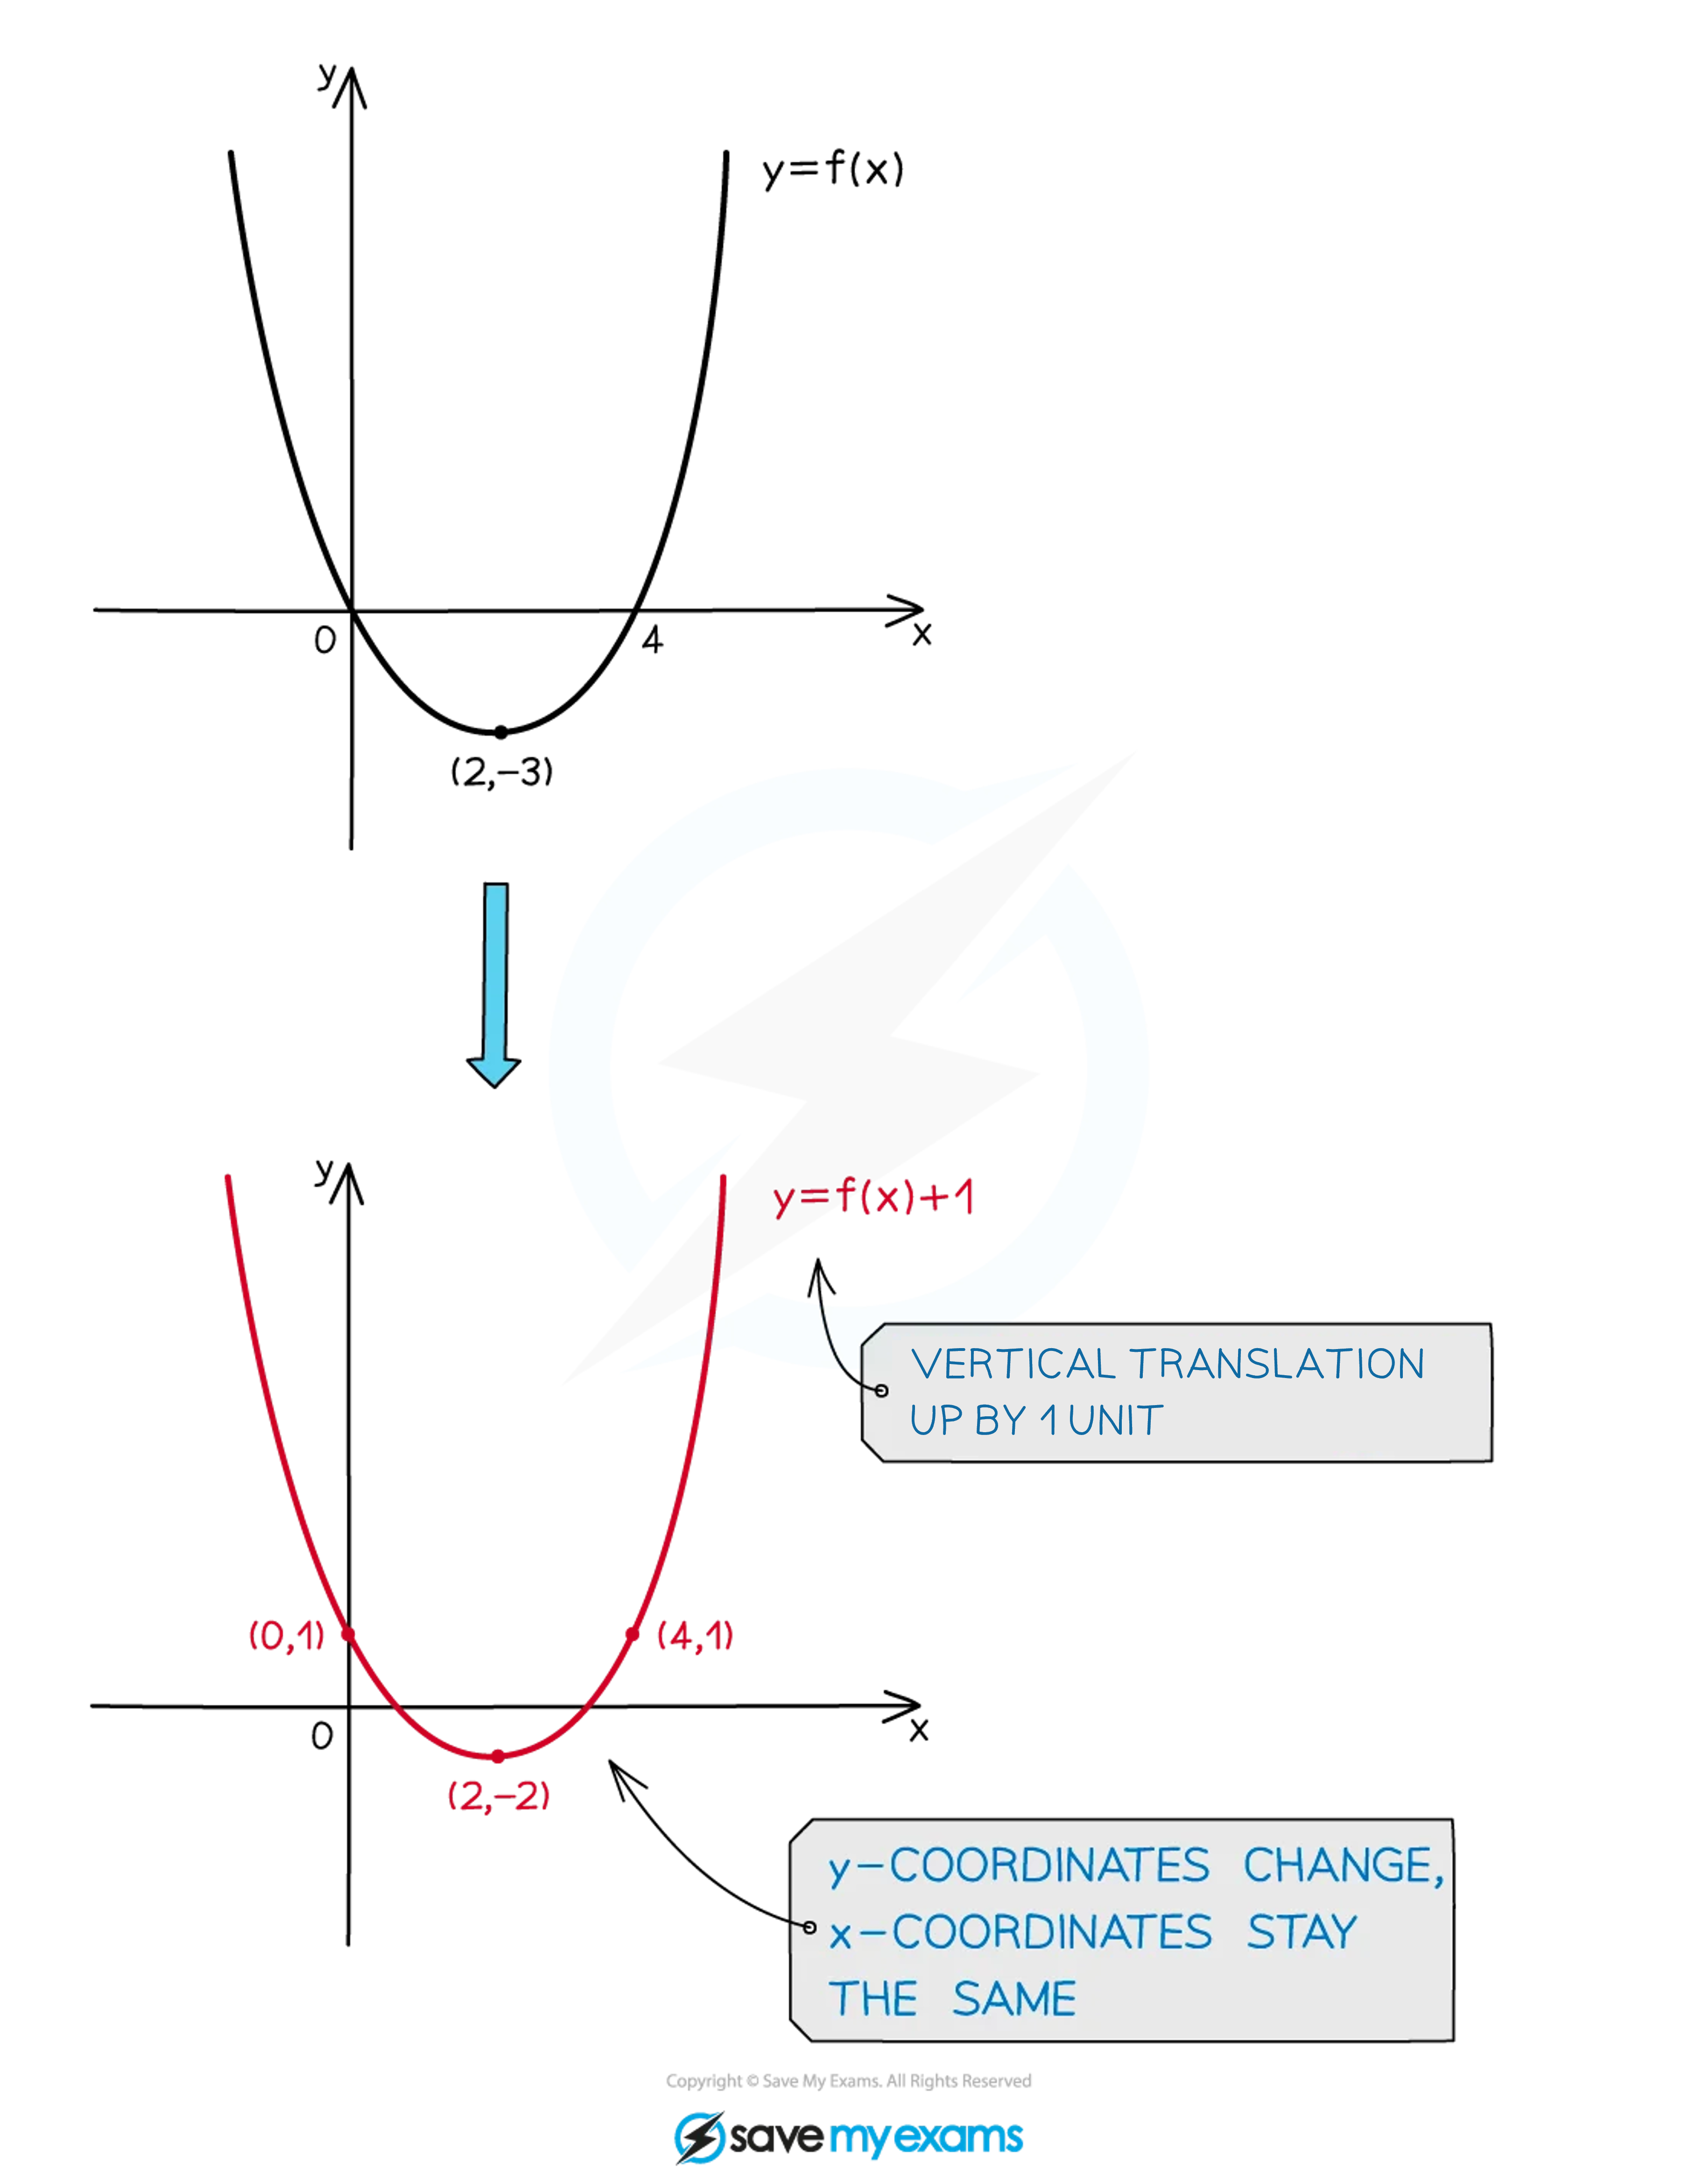
The effect on the graph is a vertical translation (shift)
every point on the graph moves up or down by units
If , the graph shifts up by units
If , the graph shifts down by units
The shape of the graph does not change
it is simply moved vertically
E.g. for a function
shifts the entire graph of up by 1 unit
shifts it down by 4 units
How does a vertical translation affect key features?
Every output value changes by , so
-intercept
changes by
Local maxima and minima
their -values shift by
but the -values where they occur stay the same
Horizontal asymptotes
shift by
e.g. if the original asymptote is , the new one is
Zeros (-intercepts)
generally change, because the outputs for each value are different
Features that depend only on -values are not affected:
Vertical asymptotes stay in the same place
Intervals of increase/decrease stay the same
Concavity intervals (and the concavity on them) stay the same
How do I find the analytical form of a vertical translation?
means 'add to the entire function'
So if you have an expression for , simply add to it to get the analytical form of the transformed function
Simplify if necessary
E.g. if
Then to find
Horizontal translations
What is a horizontal translation?
If you start with a function and add a constant to the input before the function is applied
the new function is also called an additive transformation of
i.e., vertical and horizontal translations are both types of additive transformation
The effect on the graph is a horizontal translation (shift)
every point on the graph moves left or right
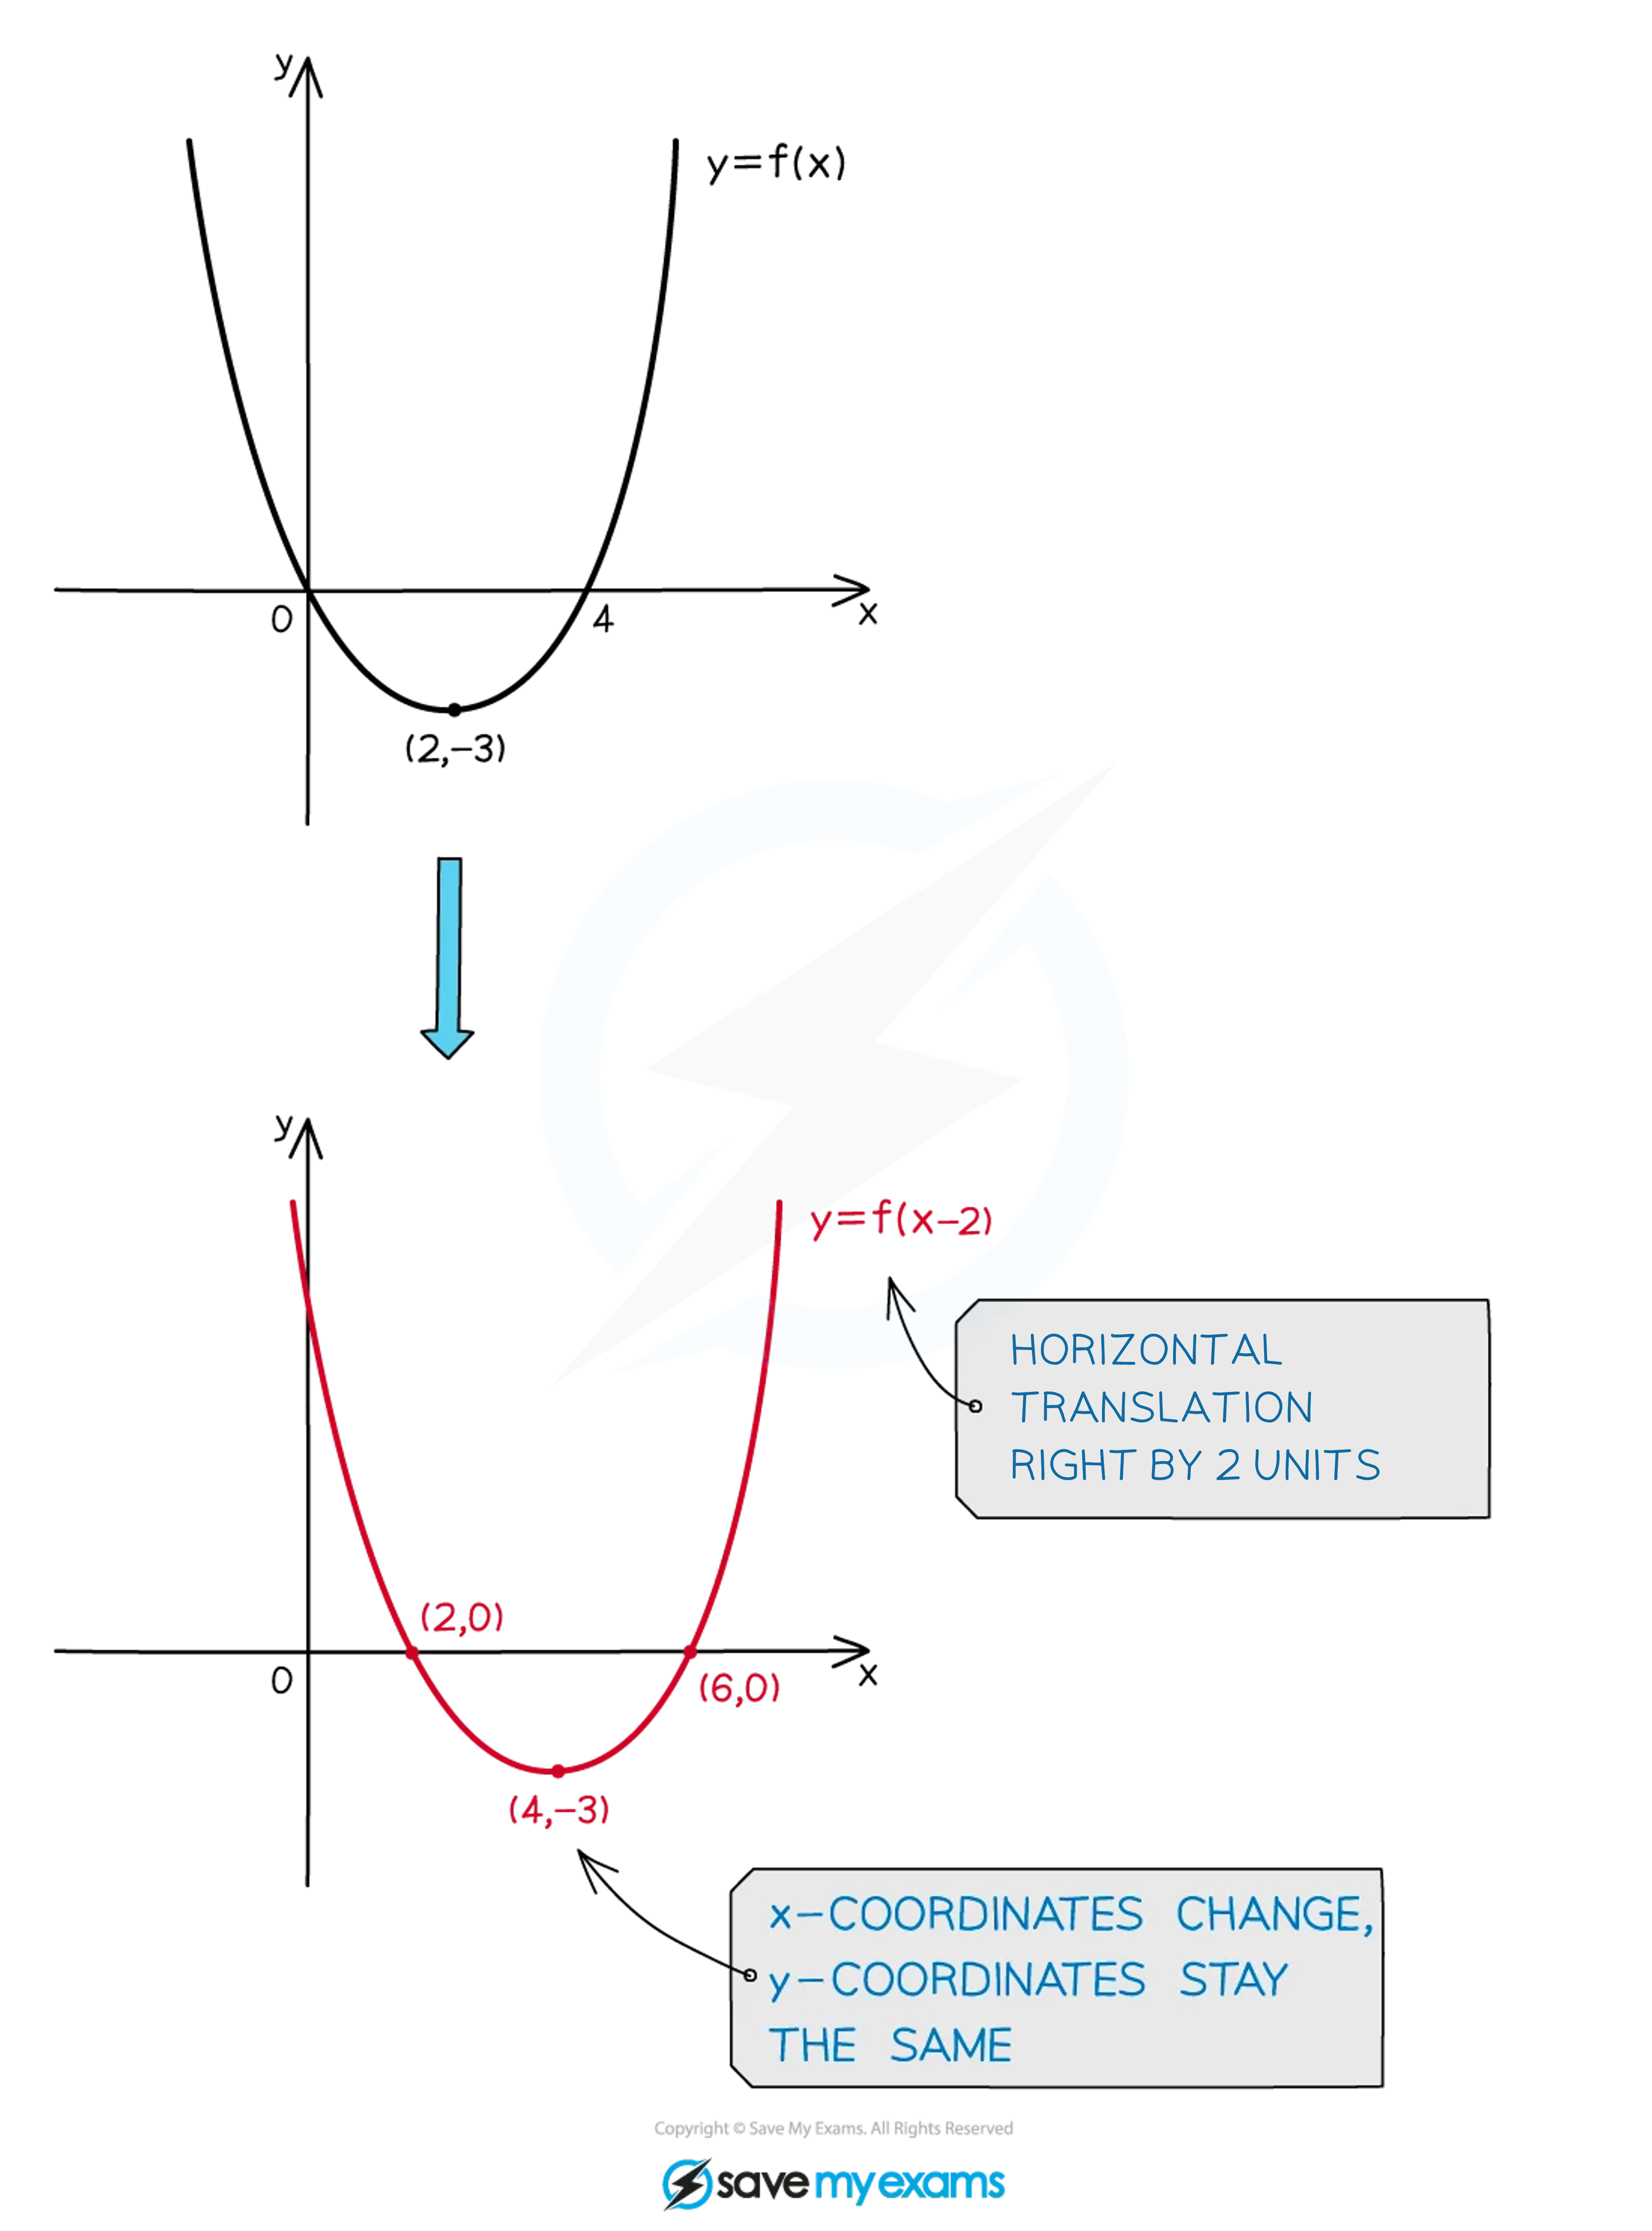
If , the graph shifts to the left by units
If , the graph shifts to the right by units
Note the counterintuitive direction
adding a positive number inside the function moves the graph to the left, not the right
The shape of the graph does not change
it is simply moved horizontally
E.g. for a function
shifts the entire graph of left by 3 units
shifts it right by 2 units
Examiner Tips and Tricks
The most common error with horizontal translations is getting the direction wrong. Remember: shifts the graph by units (i.e. in the opposite direction to the sign of ). So shifts left by 3, and shifts right by 2.
How does a horizontal translation affect key features?
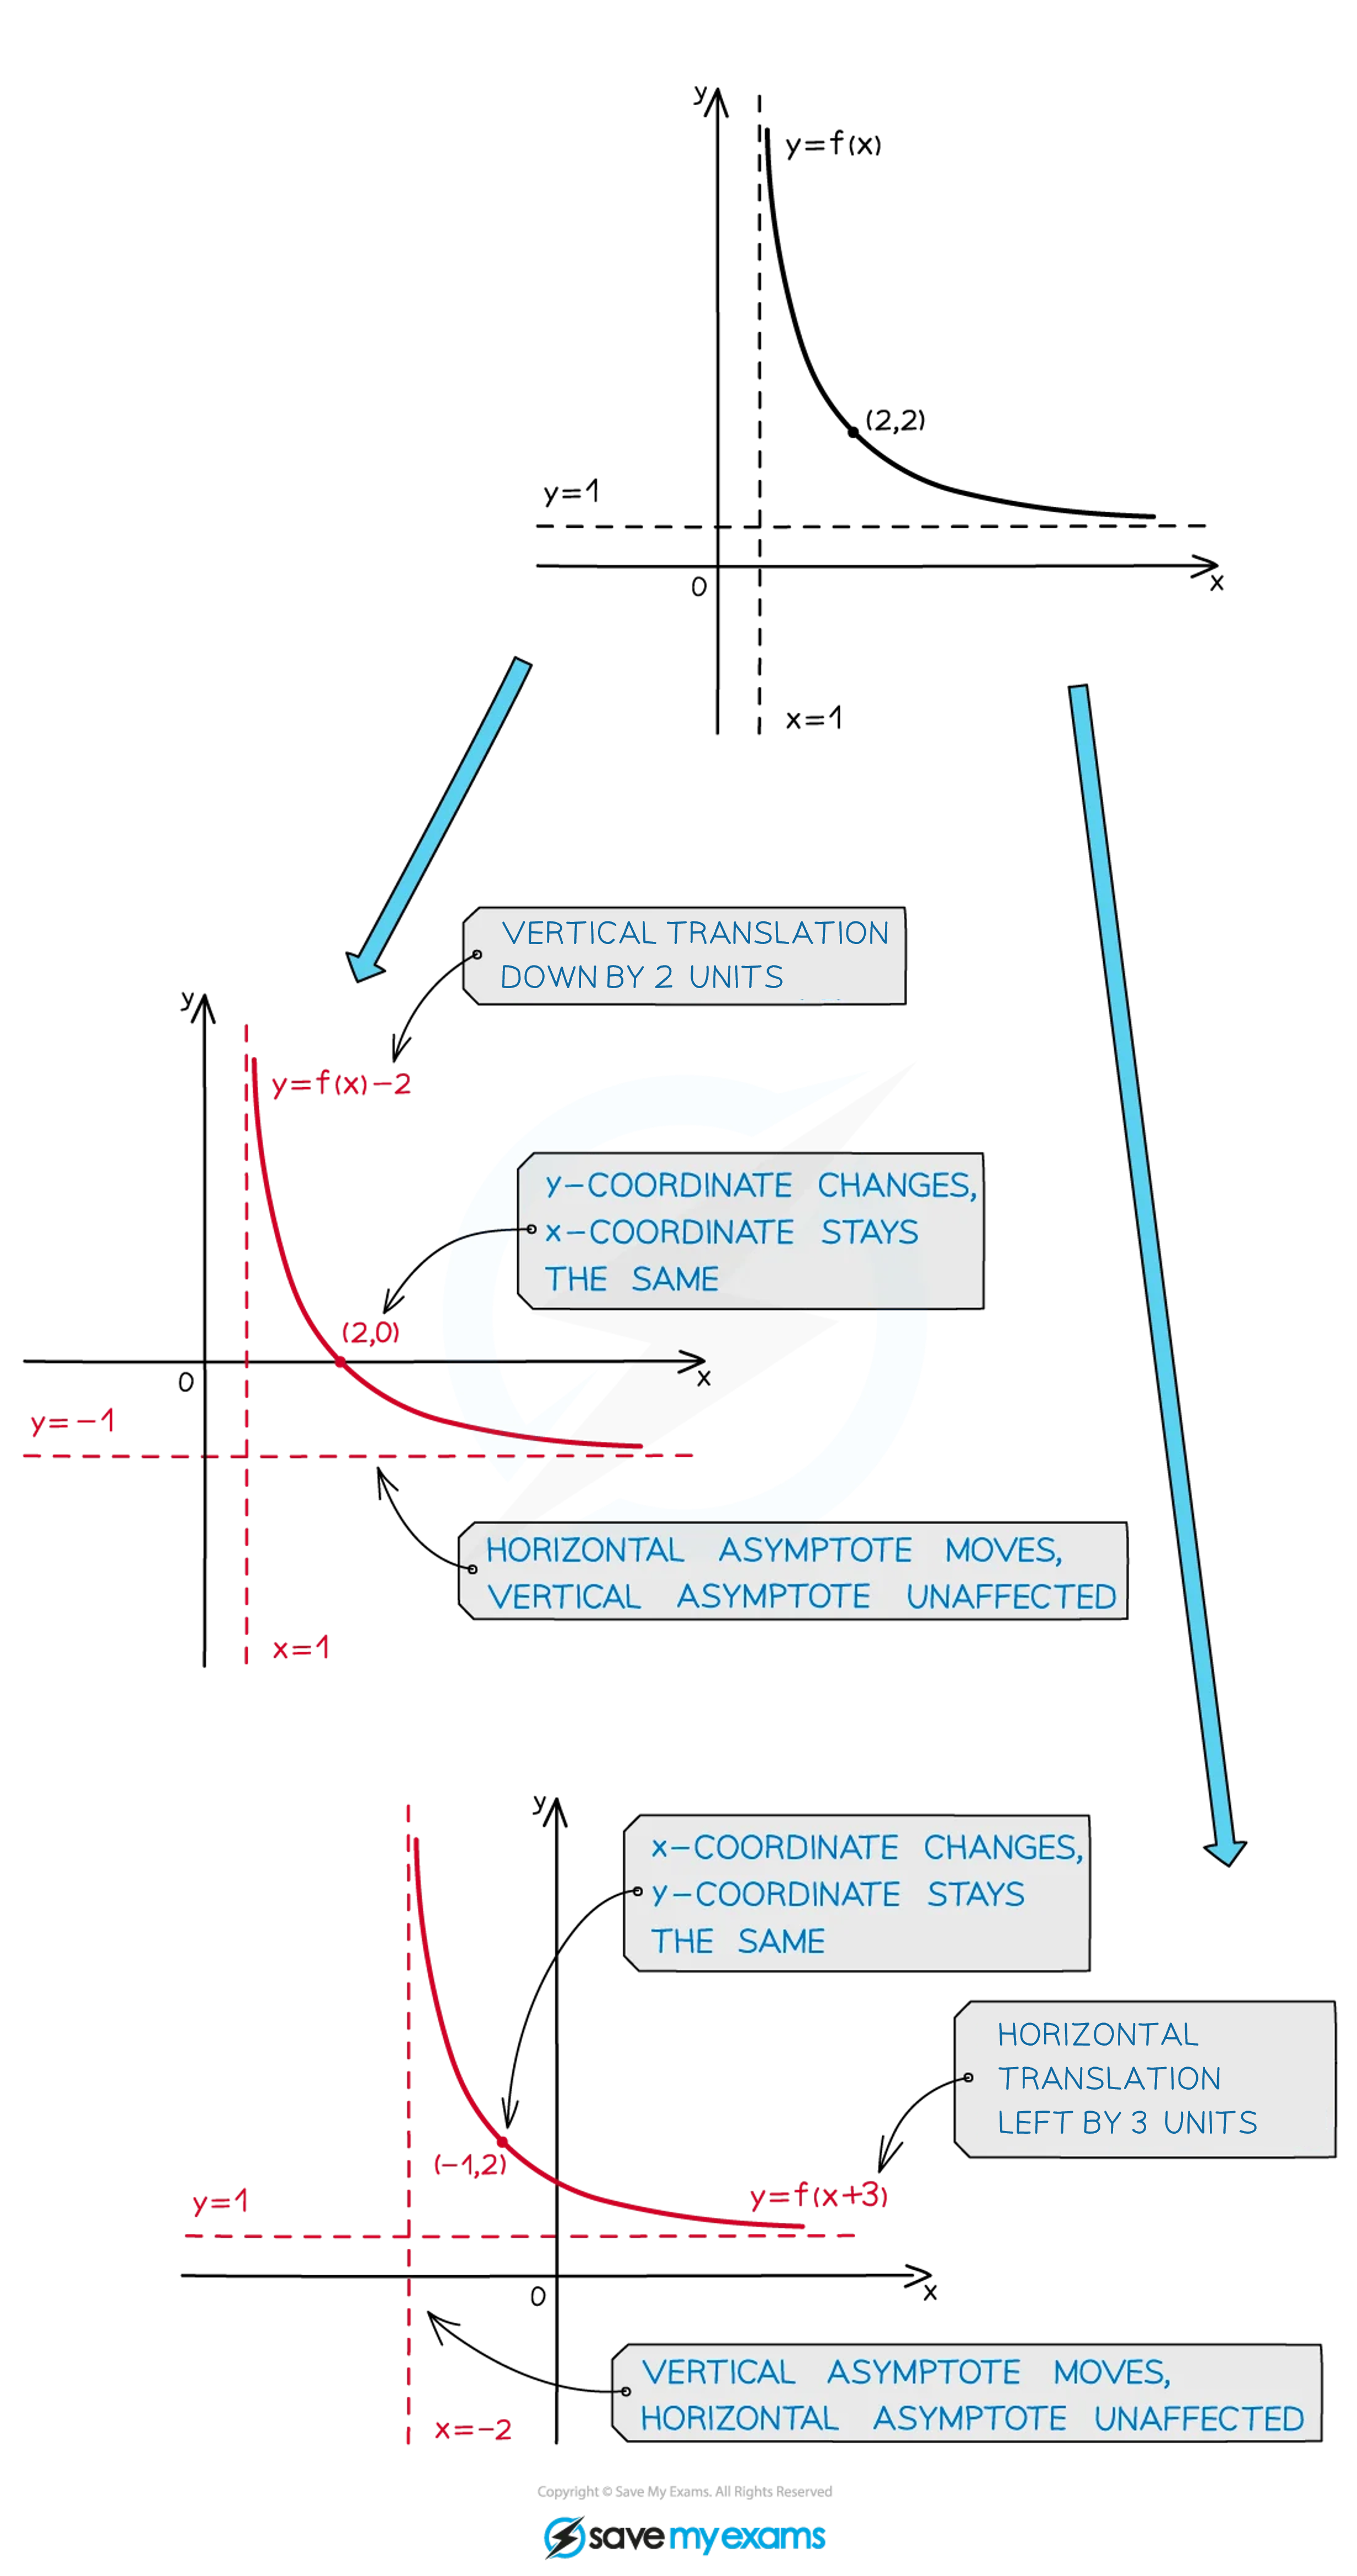
Every input value is shifted, so features that depend on -values move:
Zeros (-intercepts)
shift left or right by the same amount as the graph
Local maxima and minima
their -values shift, but the -values stay the same
Vertical asymptotes
shift horizontally the same way as the rest of the graph
e.g. if the original asymptote is , the new one is
Intervals of increase/decrease
shift horizontally (same pattern, different -values)
Concavity intervals
shift horizontally (same pattern, different -values)
though the concavity on those intervals stays the same
Features that depend only on the overall shape or on the -values are not affected:
Horizontal asymptotes stay at the same -value
How do I find the analytical form of a horizontal translation?
means 'replace everywhere in with '
So if you have an expression for , simply put everywhere that is to get the analytical form of the transformed function
Simplify if necessary
E.g. if
Then to find
How can you tell vertical and horizontal translations apart?
Vertical translation
the constant is added outside the function
it changes the output
Horizontal translation
the constant is added inside the function (to the input)
it changes which input produces each output
A common mistake is to confuse the two
If you see a constant being added to , that's vertical
If you see a constant being added to inside , that's horizontal
Worked Example
The function is given by . The graph of which of the following functions is the image of the graph of after a horizontal translation of the graph of by 2 units?
(A) , because this is an additive transformation of that results from adding 2 to .
(B) , because this is an additive transformation of that results from adding 2 to each input value .
(C) , because this is an additive transformation of that results from subtracting 2 from .
(D) , because this is an additive transformation of that results from subtracting 2 from each input value .
Answer:
'A horizontal translation of the graph of by 2 units' means a translation in the positive direction; i.e., 'to the right'
Adding or subtracting a constant from causes a vertical translation, not a horizontal one
So you can rule out (A), which is a vertical translation up by 2 units
and also (C), which is a vertical translation down by 2 units
Adding 2 to each input value gives
That is function in option (B)
But adding 2 to each input value causes a horizontal translation by -2 units (i.e., to the left)
Subtracting 2 from each input value gives
That is function in option (D)
And indeed subtracting 2 from each input value (i.e., adding -2) causes a horizontal translation by units
(D) , because this is an additive transformation
of that results from subtracting 2 from each input value
Examiner Tips and Tricks
On the exam, you may be given a function and asked which of several expressions represents a particular translation. Be careful to distinguish between adding a constant to the output (vertical shift) versus adding it to the input (horizontal shift).
The incorrect answer options are often designed to test exactly this confusion

Unlock more, it's free!
Join the 100,000+ Students that ❤️ Save My Exams
the (exam) results speak for themselves:

Was this revision note helpful?
Build on this topic