Rates of Change in Polar Functions (College Board AP® Precalculus): Study Guide

Increasing & decreasing polar functions
How is the distance from the origin related to a polar function?
For a polar function , the point on the graph corresponding to input has polar coordinates
The distance from the origin to this point is
the absolute value is needed, as output values can be signed
i.e. can be positive or negative
As changes, this distance can increase or decrease
depending on both the sign of
and whether is increasing or decreasing
When is the distance from the origin increasing or decreasing?
The distance from the origin to the point is increasing on an interval when either of the following is true
is positive and increasing on the interval
is moving further from in the positive direction
so grows
is negative and decreasing on the interval
is moving further from in the negative direction
so also grows
E.g. if goes from to as increases
is decreasing
but the distance from the origin has grown from to
The distance from the origin to the point is decreasing on an interval when either of the following is true
is positive and decreasing on the interval
is moving toward from the positive side
so shrinks
is negative and increasing on the interval
is moving toward from the negative side
so shrinks
E.g. if goes from to as increases
is increasing
but the distance from the origin has shrunk from to
Examiner Tips and Tricks
A useful way to keep track of all four cases is the rule:
Distance from origin increases when and its direction of change have the same sign (both positive, or both negative)
Distance from origin decreases when and its direction of change have opposite signs (one positive, the other negative)
Another way to think about it is that the distance from the origin is , so it is increasing whenever is increasing
Because in that case the signed value is moving away from zero
Worked Example
Consider the graph of the polar function , where , in the polar coordinate system for . Which of the following statements is true about the distance between the point with polar coordinates and the origin?
(A) The distance is increasing for , because is positive and increasing on the interval.
(B) The distance is increasing for , because is negative and increasing on the interval.
(C) The distance is decreasing for , because is positive and decreasing on the interval.
(D) The distance is decreasing for , because is negative and decreasing on the interval.
Answer:
First check where is positive or negative
when
i.e. or
when
so is positive on
elsewhere
so is negative on
Now check where is increasing or decreasing
Since
increases when decreases, i.e. on
and it decreases when increases, i.e. on .
This lets you divide into four regions
is negative and increasing on
sign () and direction of change () don't match, so distance is decreasing
is positive and increasing on
sign () and direction of change () match, so distance is increasing
is positive and decreasing on
sign () and direction of change () don't match, so distance is decreasing
is negative and decreasing on
sign () and direction of change () match, so distance is increasing
The only answer option which contains both a correct behavior (increasing or decreasing) and a correct explanation is (A)
(A) The distance is increasing for , because is positive and increasing on the interval
Relative extrema of polar functions
What does a relative extremum of a polar function mean?
A polar function has
a relative maximum at a value of
where changes from increasing to decreasing
and a relative minimum at a value of
where changes from decreasing to increasing
These relative extrema correspond to points on the polar graph that are relatively closest to or relatively farthest from the origin
compared with nearby points on the graph
Because the distance from the origin is rather than itself
the link between extrema of and extrema of the distance depends on the sign of
At a relative maximum of where is positive
reaches a local peak in the positive direction
so the point is relatively farthest from the origin compared to nearby points
At a relative minimum of where is positive
reaches a local low point (still positive)
so the point is relatively closest to the origin compared to nearby points
At a relative maximum of where is negative
reaches a local peak (still negative)
the value is closest to zero, so the point is relatively closest to the origin
At a relative minimum of where is negative
reaches a local low point (most negative)
the value is furthest from zero, so the point is relatively farthest from the origin
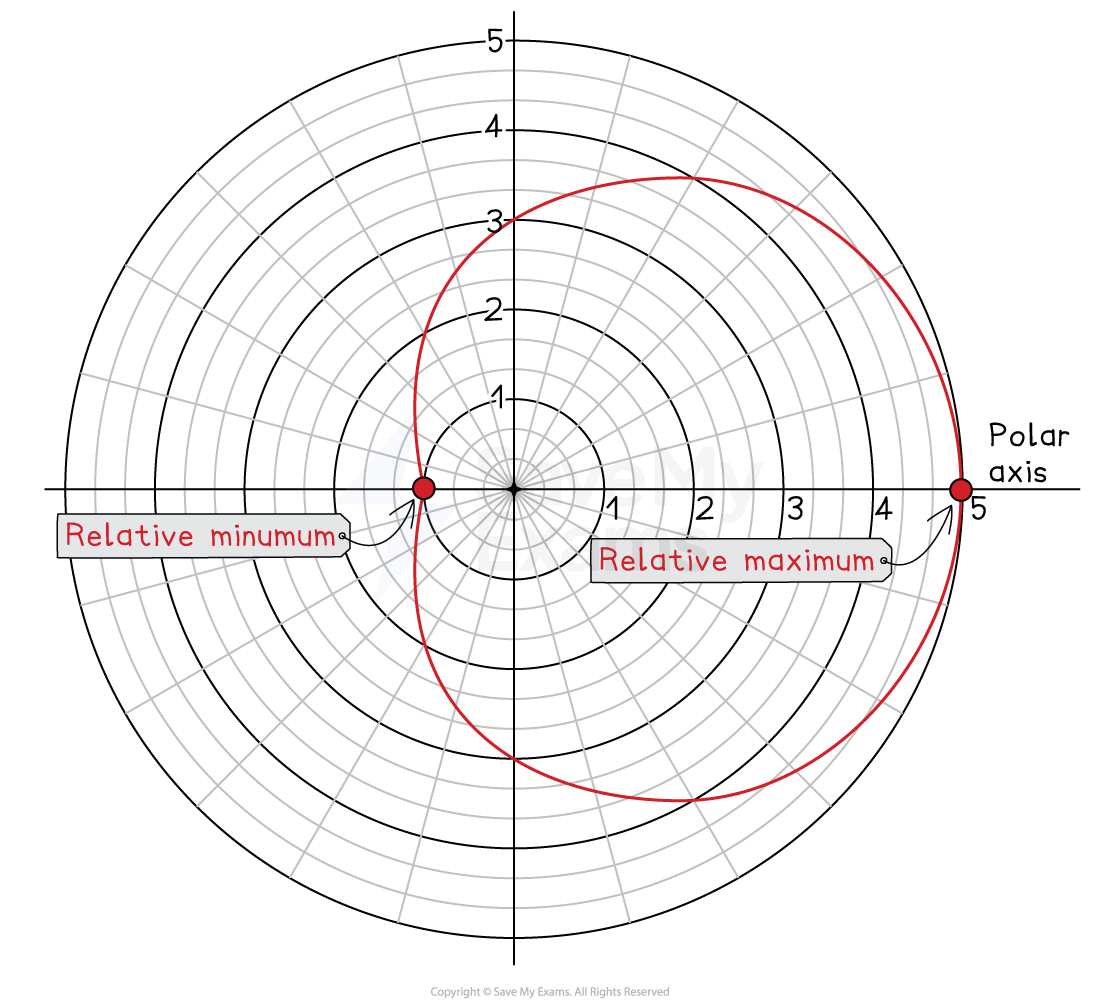
Examiner Tips and Tricks
Don't forget to consider the sign of when analyzing a polar function for relative extrema.
When all the values of under consideration are positive, then there is a convenient shortcut:
relative maxima of give farthest points
relative minima of give closest points
Average rate of change of polar functions
How is the average rate of change of a polar function defined?
The average rate of change of a polar function over an interval is defined in the usual way
This is the ratio of
the change in the signed radius values
to the change in the angle over the interval
Graphically, it represents the rate at which the signed radius is changing per radian (assuming is measured in radians)
The units are therefore "units of per radian"
How can the average rate of change be used to estimate values of a polar function?
The average rate of change over an interval can be used
to estimate the value of at any between and
using a linear approximation
This approximation treats as though it changes at a constant rate across the interval
It will be most accurate
when the interval is small
and when does not change behavior drastically within the interval
The linear approximation formula can also be written starting from the right endpoint
Worked Example
A polar function is defined on the interval , and the table above gives selected values of . Assume that is continuous and has no relative extrema between the values of listed in the table.
(a) Based on the information in the table, on which interval between consecutive table values does have a relative maximum at the right endpoint, and on which interval does have a relative minimum at the right endpoint? For each relative maximum or minimum point, state whether the corresponding point on the polar graph is relatively closest to or relatively farthest from the origin.
(b) Find the average rate of change of with respect to on the interval . Give an exact value and include the appropriate units.
(c) Use the average rate of change found in part (b) to estimate the value of .
Answer:
(a)
Reading across the table
From to , increases from to
From to , decreases from to
From to , decreases from to
From to , increases from to
So changes from increasing to decreasing at , which is the right endpoint of the interval
This is a relative maximum of
and since is positive at this value, this means the point on the graph at is relatively farthest from the origin compared with nearby points
changes from decreasing to increasing at , which is the right endpoint of the interval
This is a relative minimum of
and since is positive at this value, this means the point on the graph at is relatively closest to the origin compared with nearby points
has a relative maximum at the right endpoint of , and at
the point on the polar graph is relatively farthest from the origin
has a relative minimum at the right endpoint of , and at
the point on the polar graph is relatively closest to the origin
(b)
Apply the average rate of change formula:
So the average rate of change is
units of per radian
(c)
Use the average rate of change to estimate by linear approximation starting from
First simplify the angle difference
Then
So

Unlock more, it's free!
Join the 100,000+ Students that ❤️ Save My Exams
the (exam) results speak for themselves:

Was this revision note helpful?
Build on this topic