Periodic Phenomena (College Board AP® Precalculus): Study Guide

Graphs of periodic relationships
What is a periodic relationship?
A periodic relationship exists between two quantities when
as the input values increase
the output values repeat in a pattern over successive equal-length intervals
For example, the height of a point on a spinning wheel varies periodically with time
the height goes up, comes back down, and then repeats this same pattern over and over
Other examples of periodic phenomena include
ocean tides
daily temperature cycles
the motion of a vibrating guitar string
the voltage in an alternating current (AC) electrical circuit
The key feature that makes a relationship periodic is that
the same pattern of output values
occurs again and again
across equal-length intervals of the input
How can a graph of a periodic relationship be constructed?
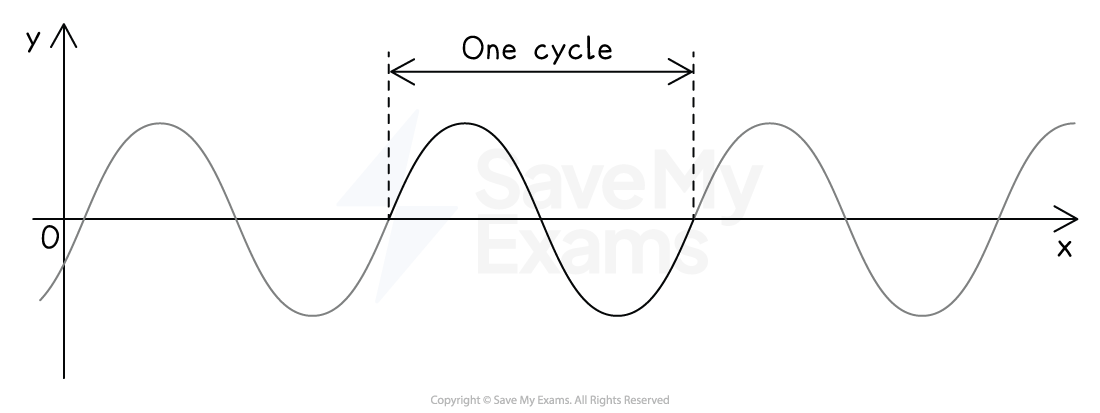
The graph of a periodic relationship can be built from the graph of a single cycle of the relationship
One cycle captures the complete pattern of output values before the pattern starts repeating
To construct the full graph, this single cycle is copied and placed end to end, extending in both directions along the input axis
In real-world contexts, the graph can be constructed from a verbal description of how a quantity changes
Identify the repeating pattern in the description
Sketch one complete cycle based on the described behavior
Repeat the cycle to extend the graph over the desired input interval
Key characteristics of periodic relationships
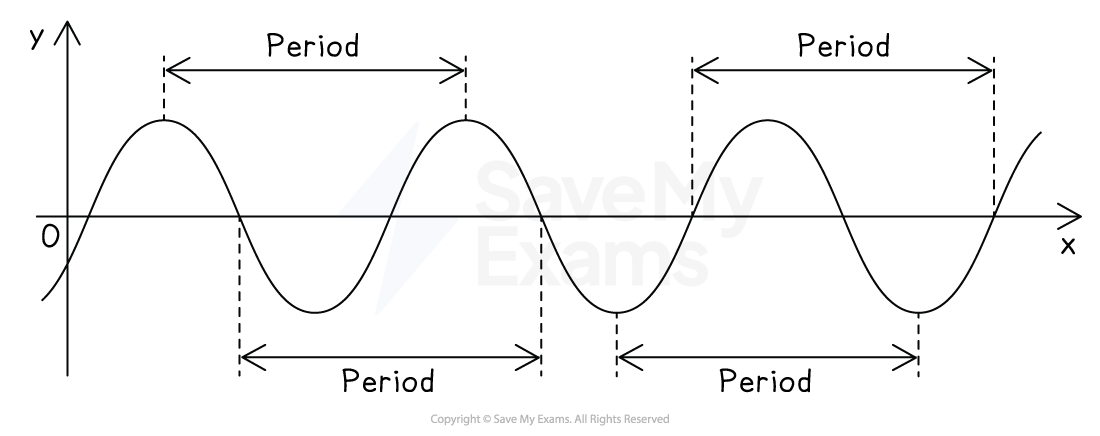
What is the period of a periodic function?
The period of a periodic function is the smallest positive value such that for all in the domain
I.e. if you shift any input value by exactly one period, the output value stays the same
The period represents the length of one complete cycle of the function
Because the function repeats every units
the behavior of a periodic function is completely determined by any interval of width
If you know what the function does on one full period, you know what it does everywhere
How can the period be estimated?
The period can be estimated by looking at successive output values at equally spaced input values and finding where the pattern begins to repeat
For example, given a table of values
look for the point where the output values start cycling through the same sequence again
The distance along the input axis between the start of one cycle and the start of the next cycle is the period
On a graph, the period can be estimated by identifying two consecutive points where the same behavior begins
e.g. two consecutive peaks, two consecutive troughs, or two consecutive points where the graph crosses the midline in the same direction
What other characteristics do periodic functions have?
Periodic functions share many of the same characteristics as other types of functions, including:
Intervals of increase and decrease
Different concavities (concave up and concave down)
Various rates of change
The important difference with periodic functions is that all characteristics found in one period are repeated in every period of the function
For example, if the function is increasing on a certain sub-interval within one period, it will be increasing on the corresponding sub-interval in every other period
Similarly, any maximum value, minimum value, or rate of change pattern within one period will appear in exactly the same way in every period

Unlock more, it's free!
Join the 100,000+ Students that ❤️ Save My Exams
the (exam) results speak for themselves:

Was this revision note helpful?
Build on this topic
