Graphs of Polar Functions (College Board AP® Precalculus): Study Guide

Roger B

Written by: Roger B

Reviewed by: Mark Curtis

Updated on

Graphs of polar functions

How is a polar function defined?

  • A polar function is a function of the form r equals f left parenthesis theta right parenthesis

    • The input is an angle theta (usually in radians)

    • The output is a value r that represents a signed radius

      • Remember that 'signed radius' means r can be positive or negative

  • The graph of a polar function consists of all the points whose polar coordinates left parenthesis r comma   theta right parenthesis satisfy the equation r equals f left parenthesis theta right parenthesis

    • For each input angle \theta in the domain, the point with polar coordinates left parenthesis f left parenthesis theta right parenthesis comma   theta right parenthesis is plotted

    • As theta varies over the domain, these points trace out a curve in the polar coordinate system

  • E.g. consider the following table of values for the polar function r equals 2 plus 2 cos theta

    • Note that when theta equals 2 pi, the values go 'back to the beginning'

      • i.e. because 0 and 2 pi represent the same angle in a polar coordinate system

bold italic theta

bold italic r bold equals bold 2 bold plus bold 2 bold cos bold italic theta

0

4

pi over 6

2 plus square root of 3 space open parentheses almost equal to 3.732 close parentheses

pi over 3

3

pi over 2

2

fraction numerator 2 pi over denominator 3 end fraction

1

fraction numerator 5 pi over denominator 6 end fraction

2 minus square root of 3 space open parentheses almost equal to 0.268 close parentheses

pi

0

fraction numerator 7 pi over denominator 6 end fraction

2 minus square root of 3 space open parentheses almost equal to 0.268 close parentheses

fraction numerator 4 pi over denominator 3 end fraction

1

fraction numerator 3 pi over denominator 2 end fraction

2

fraction numerator 5 pi over denominator 3 end fraction

3

fraction numerator 11 pi over denominator 6 end fraction

2 plus square root of 3 space open parentheses almost equal to 3.732 close parentheses

2 pi

4

  • Plotting those points on a polar grid looks like this:

Polar graph with concentric circles and radial lines marked 1 to 5. Red dots are plotted at various coordinates across the grid.
The points from the table plotted on a polar coordinates grid
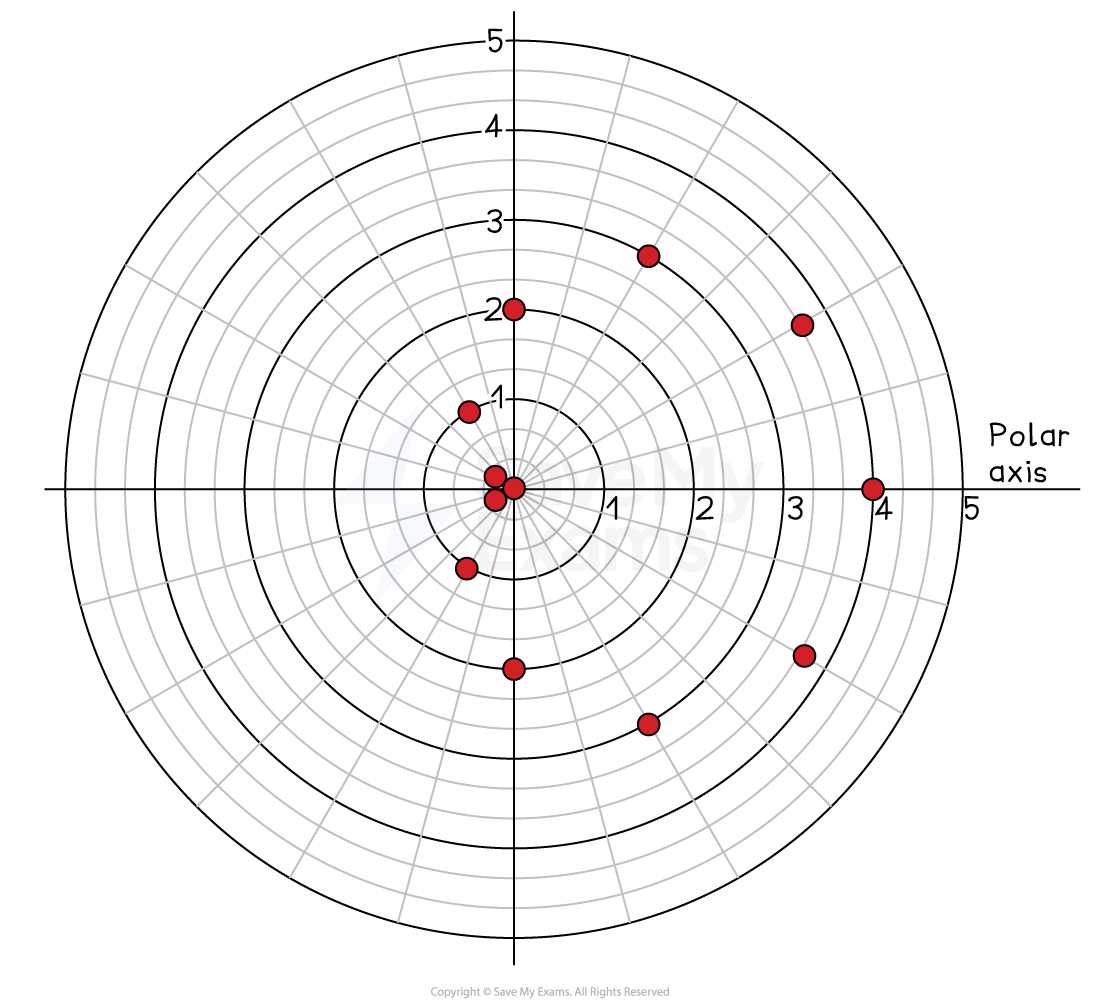
  • And connecting them with a smooth curve gives the graph of the polar function

Polar graph with a red cardioid curve. Concentric circles and radial lines form a grid. The polar axis is labelled, ranging from zero to five.
Complete graph of r=2+2cosθ

How do I interpret output values on a polar graph?

  • On the graph of r equals f left parenthesis theta right parenthesis, the behavior is different from what you are used to from a regular rectangular (Cartesian) coordinate system

  • Changes in the input \theta

    • correspond to changes in angle measure from the positive x-axis

      • Remember that the positive x-axis is called the polar axis in the polar coordinate system

  • Changes in the output r

    • correspond to changes in signed distance from the origin

      • along the terminal ray of that angle theta

  • Because r can be negative, the output values of a polar function are signed radius values, not just distances

    • When bold italic r bold greater than bold 0, the point lies on the terminal ray of the angle theta

      • at distance r from the origin

    • When bold italic r bold less than bold 0, the point lies on the opposite ray (direction reversed)

      • at distance vertical line r vertical line from the origin

    • When bold italic r bold equals bold 0, the point is at the origin

  • This means that as bold italic theta changes

    • the point on the graph can cross through the origin whenever space f left parenthesis theta right parenthesis equals 0

    • and the graph can appear in a quadrant that is "opposite" to the direction of the terminal ray if space f open parentheses theta close parentheses becomes negative

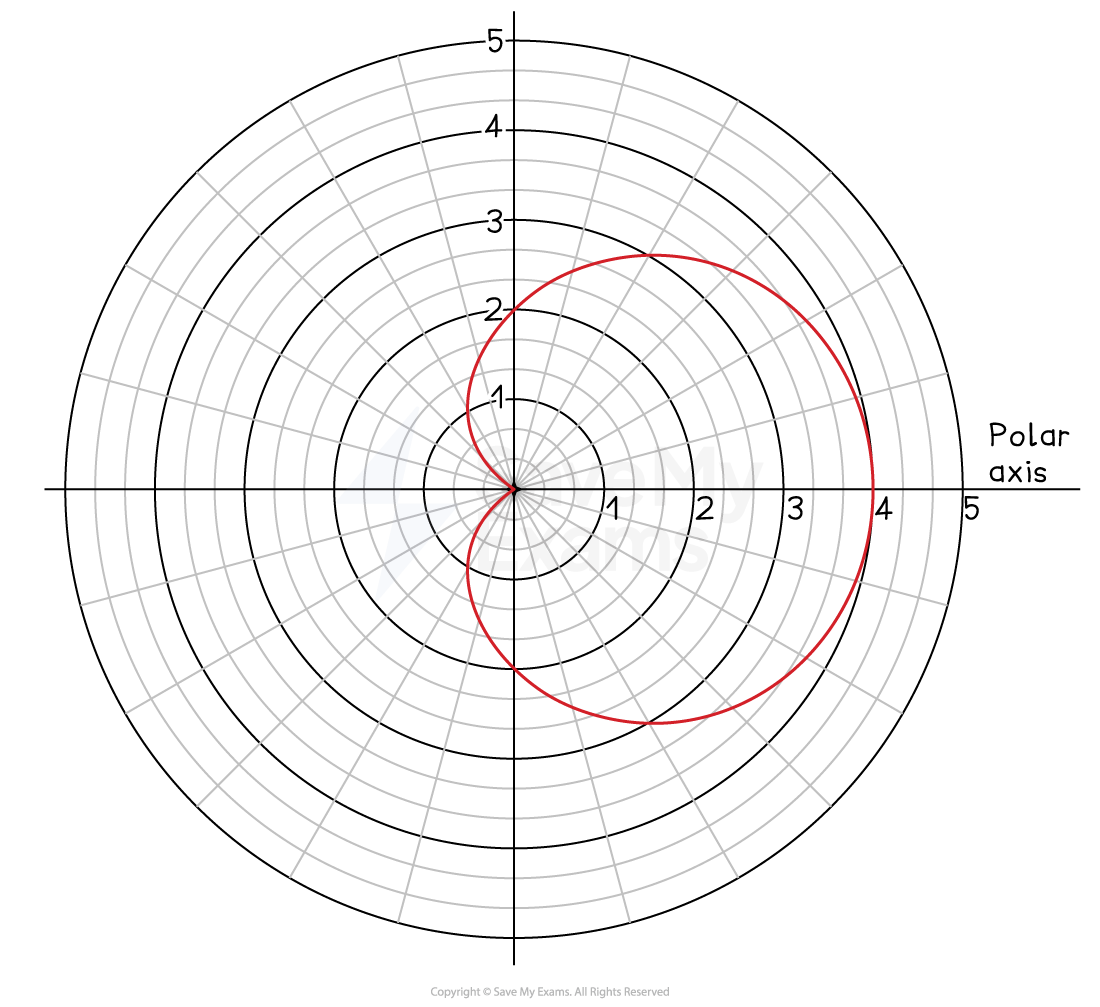
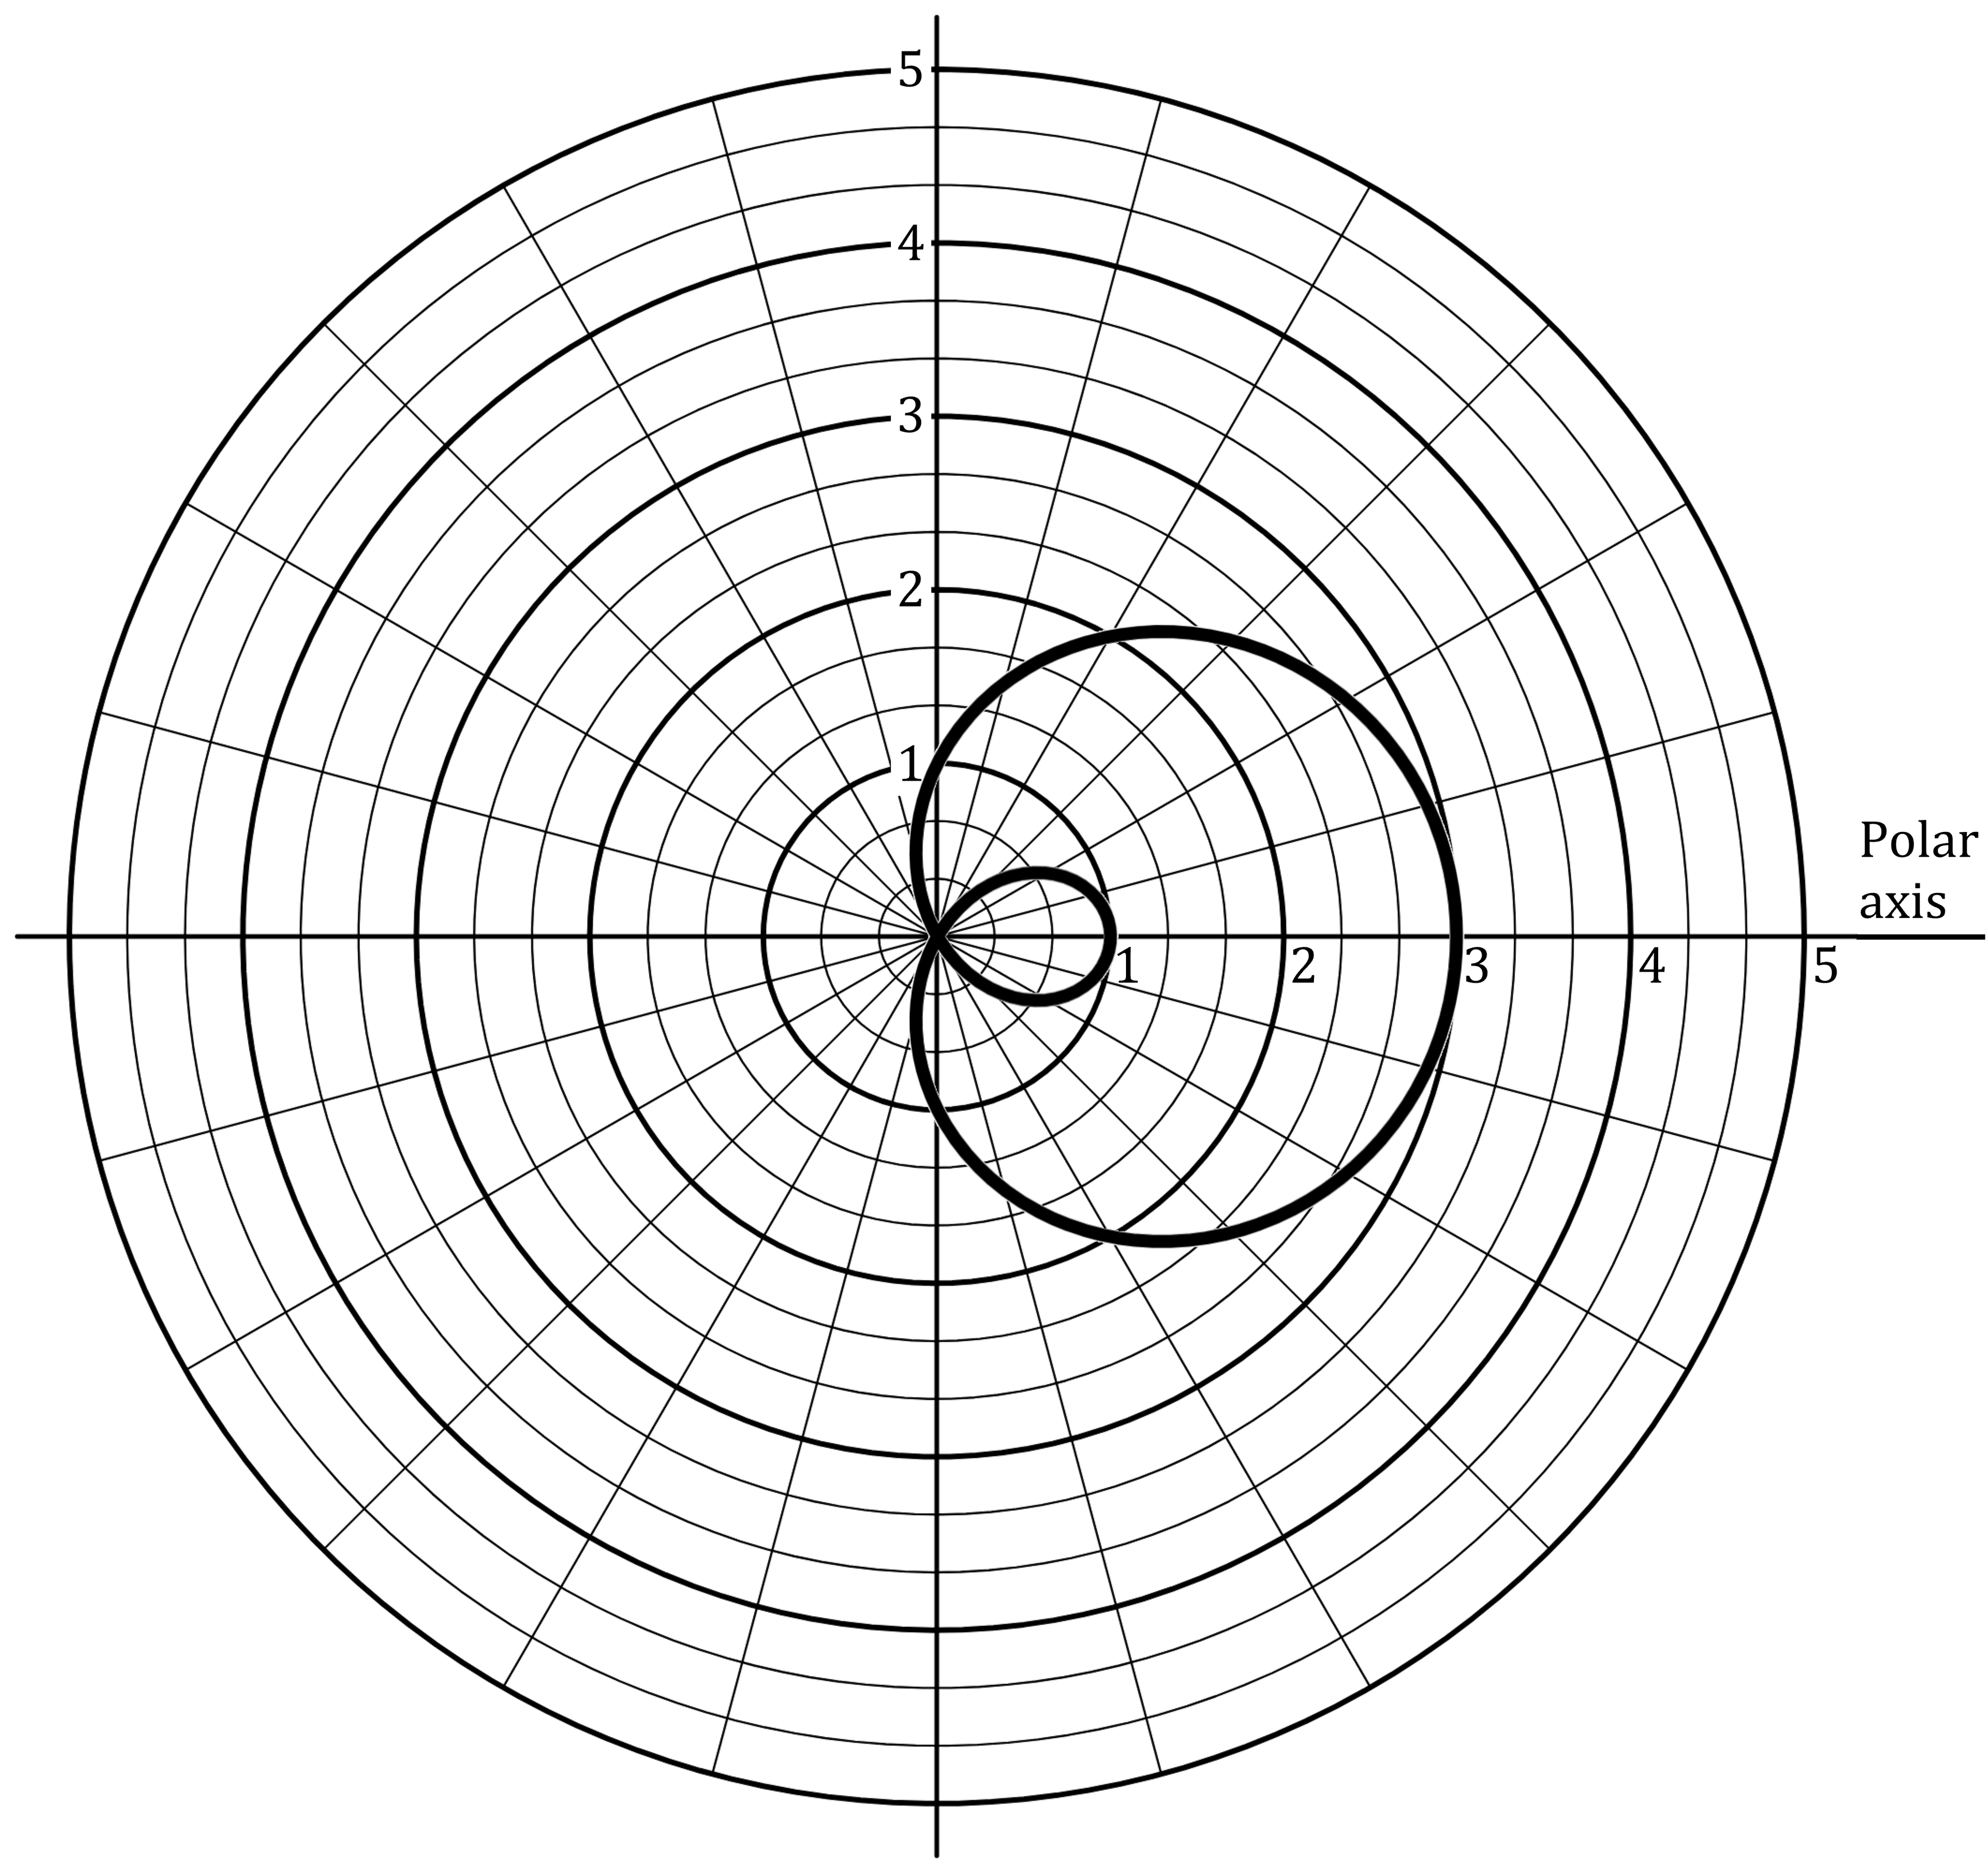
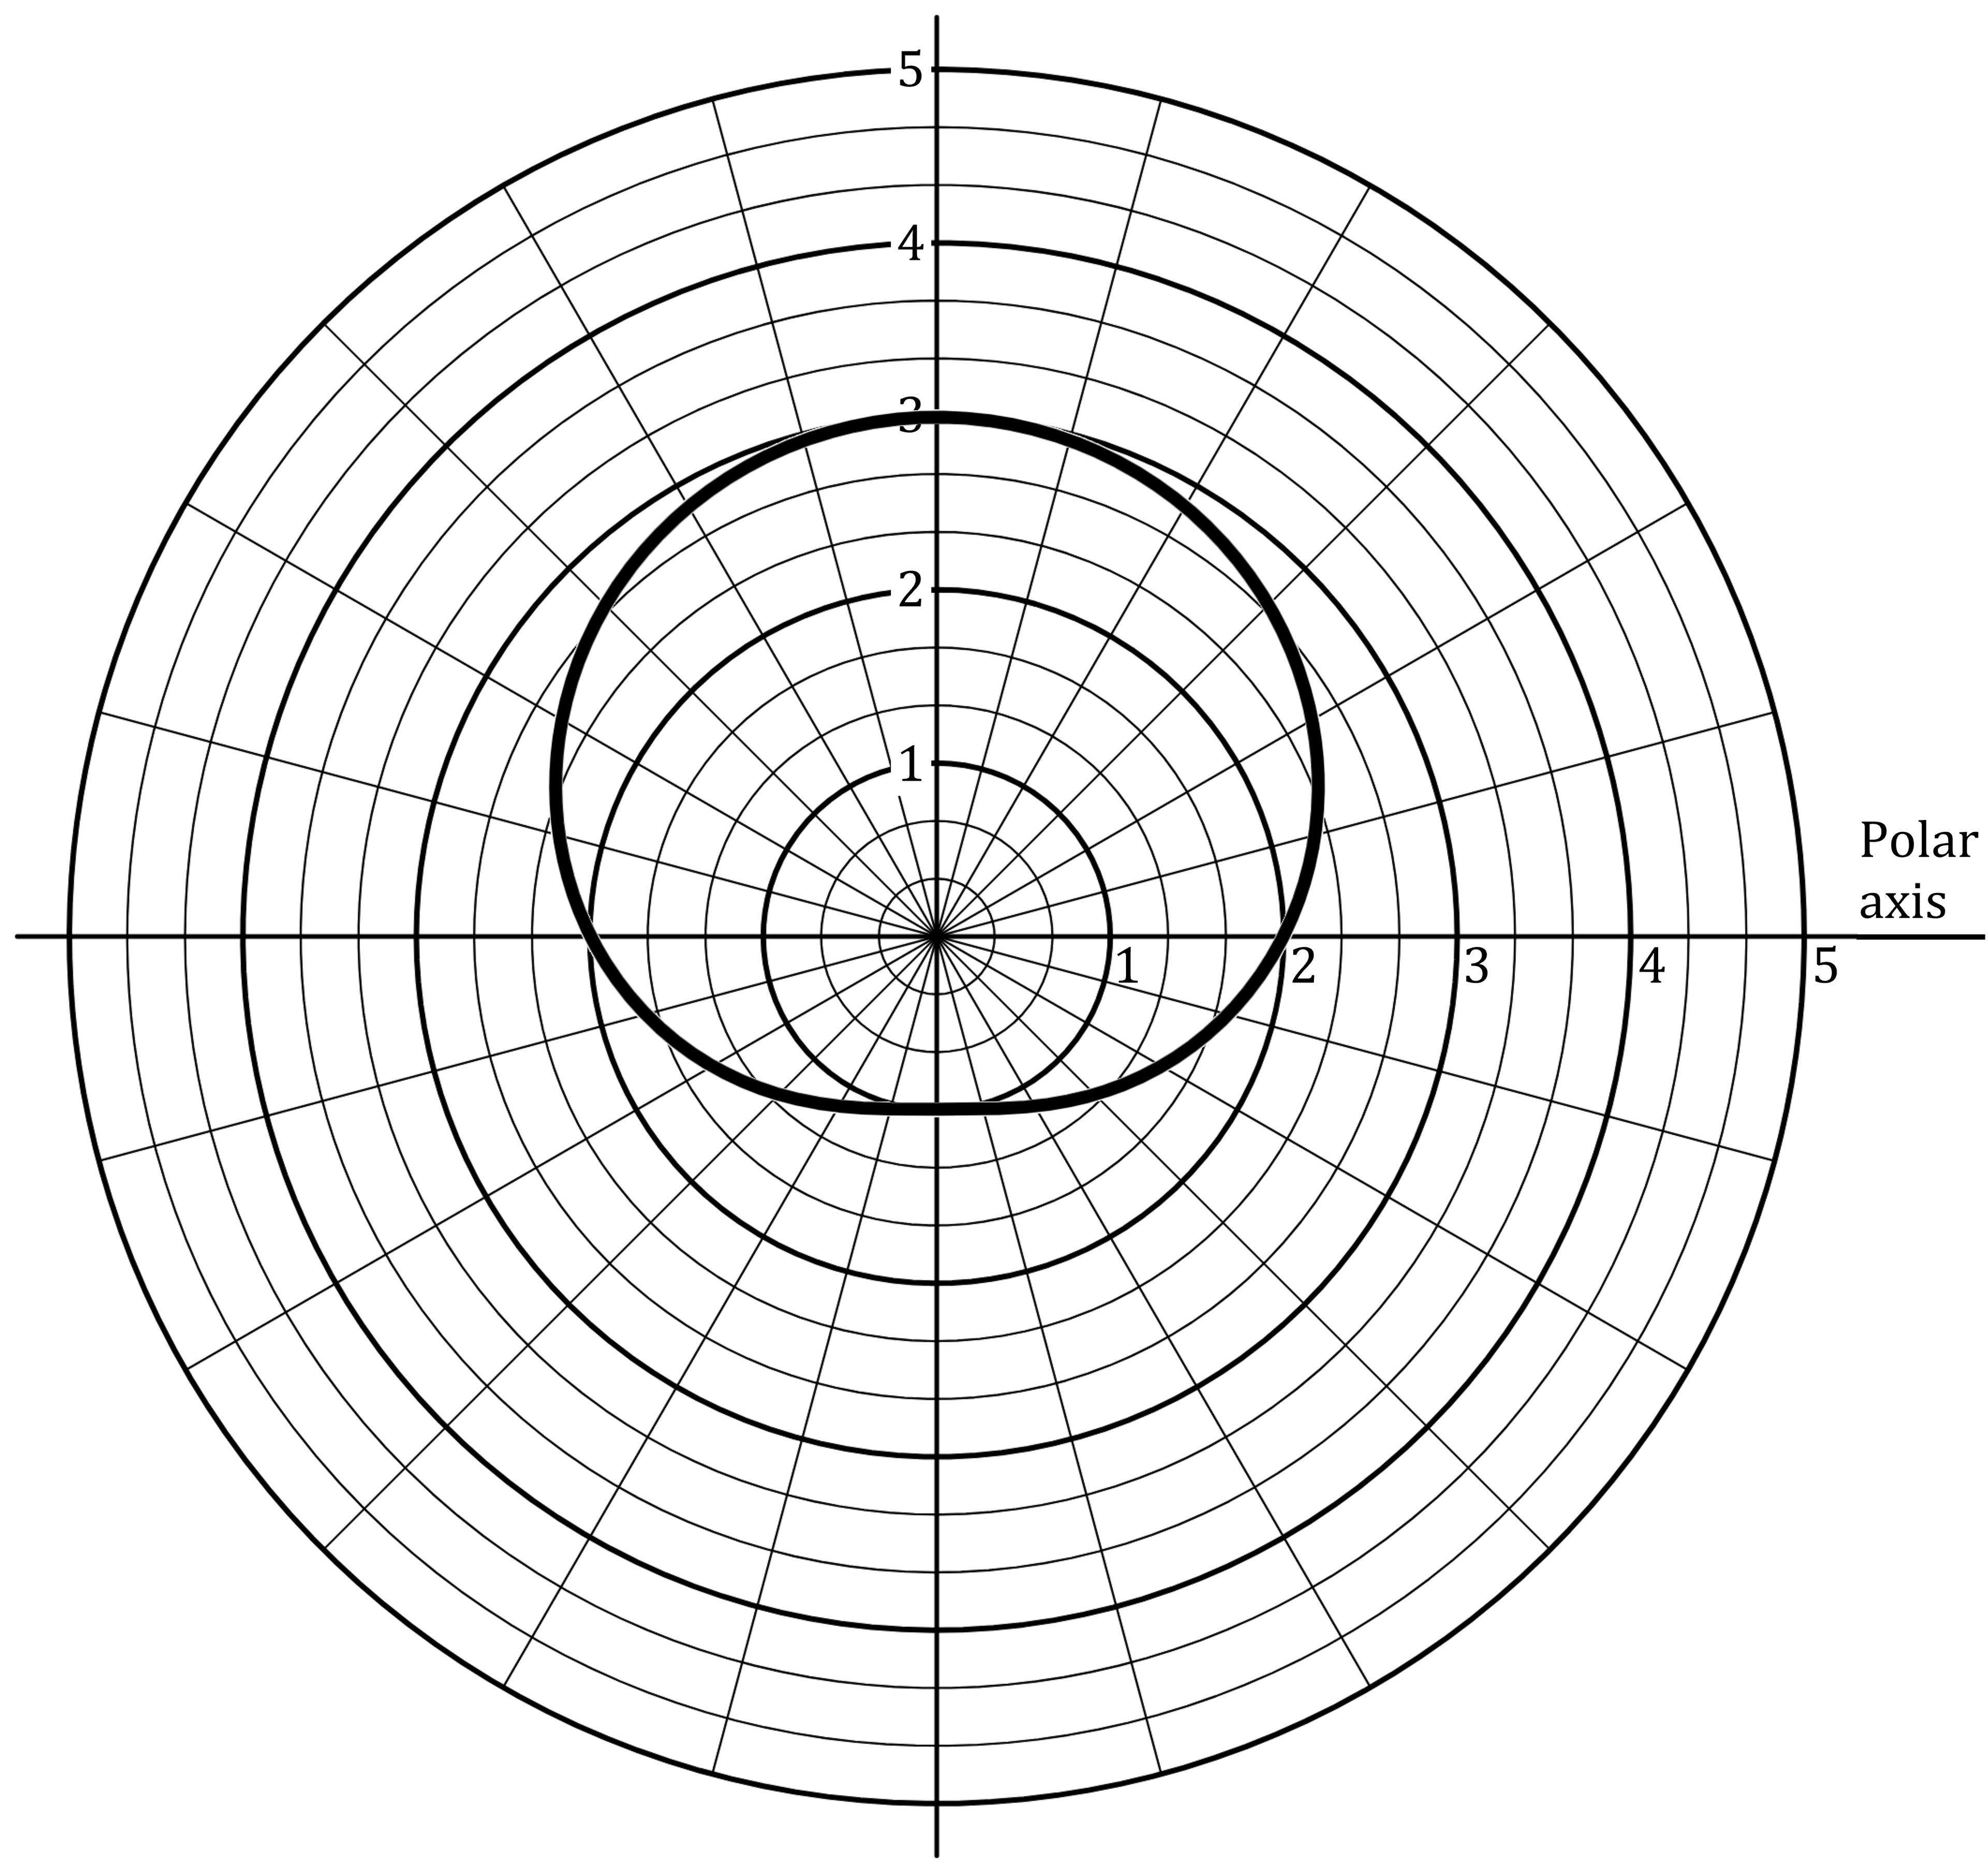
  • Compare the following two graphs of polar functions

    • In the first case, r equals 3 plus 2 cos theta is positive for all values of theta

      • So all the points occur on their terminal rays, in the same quadrants as their terminal rays
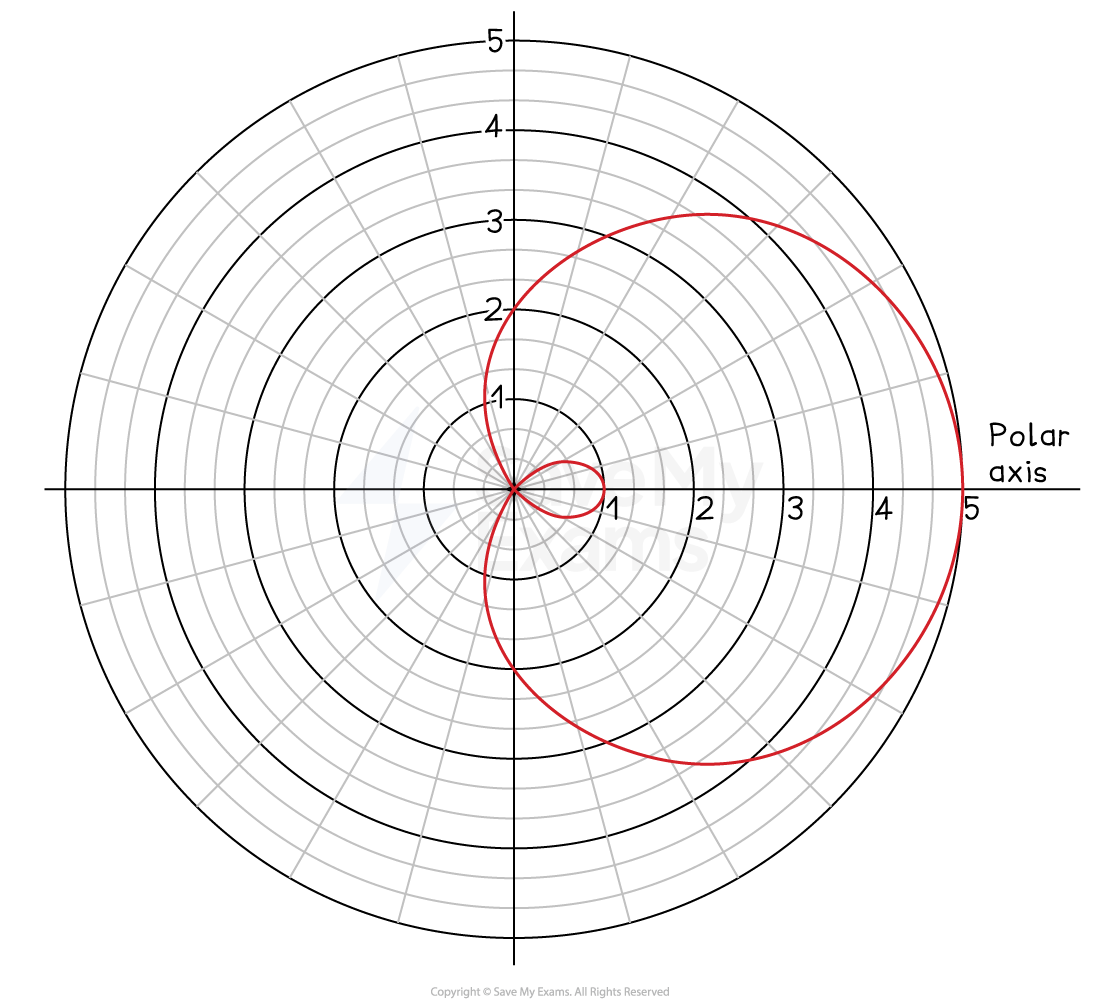
    • In the second case, r equals 2 plus 3 cos theta becomes negative when cos theta less than negative 2 over 3 (or in the approximate range 2.301 less than theta less than 3.983, in the second and third quadrants)

      • For points with those theta values, the points occur on the opposite rays to their terminal rays (and in the opposite quadrants to their terminal rays)

      • This is what creates the 'inner loop' on the graph

A polar graph featuring a grid of concentric circles, radial lines, and a red closed loop resembling a cardioid (sideways heart shape), with polar axes labelled from 1 to 5.
Graph of 3+2cosθ
A polar graph featuring a grid of concentric circles, radial lines, and a red outer loop resembling a cardioid (sideways heart shape) and a red inner loop, with polar axes labelled from 1 to 5.
Graph of 2+3cosθ

Examiner Tips and Tricks

On exam questions, keep an eye out for graphs showing curves with 'inner loops' like in the second graph above.

  • This is a clear sign that the function being graphed, r equals f open parentheses theta close parentheses, outputs negative values of r for some values of theta

  • In a multiple choice question this may allow you immediately to rule out certain of the answer options

  • It is also possible for the output of a polar function to change while the distance of the point from the origin stays the same

    • E.g. if space f left parenthesis theta right parenthesis changes from -2 to 2

      • the distance from the origin is 2 in both cases

      • even though the output has changed

    • This is similar to how, in the rectangular coordinate system

      • a change in space y-value from -2 to 2

      • does not change the distance from the x-axis

How can the domain of a polar function be restricted?

  • A polar function is often given with a specified domain

    • e.g. 0 less or equal than theta less or equal than 2 pi

      • For polar functions that appear in your exam, the full graph of the function will generally be traced out over the domain 0 less or equal than theta less or equal than 2 pi

  • If the domain is restricted to a smaller interval

    • only the portion of the graph corresponding to angles in that interval remains

  • To identify what portion remains

    • Find the endpoints of the restricted domain

      • These give the starting and ending points of the curve

    • Trace out the curve between those endpoints

      • following the points left parenthesis f left parenthesis theta right parenthesis comma   theta right parenthesis

      • as theta increases across the interval

  • Pay special attention to angles

    • where space f left parenthesis theta right parenthesis equals 0

      • the curve passes through the origin at such points

    • and to where space f left parenthesis theta right parenthesis changes sign

      • the curve may jump to the opposite side of the origin at such points

  • The remaining portion may consist of more than one visible piece

    • if the curve passes through the origin within the restricted interval

Examiner Tips and Tricks

When sketching or identifying a polar graph, always make a small table of values first.

  • Pick several angles in the domain (e.g. 0 comma   pi over 4 comma   pi over 2 comma   fraction numerator 3 pi over denominator 4 end fraction comma   pi comma horizontal ellipsis)

  • and compute r for each

Be especially careful with values of theta where space f left parenthesis theta right parenthesis is negative

  • The resulting point appears on the opposite side of the origin from the terminal ray, not on the terminal ray itself

  • Forgetting this is one of the most common errors in identifying polar graphs

Worked Example

A polar function is defined by space f left parenthesis theta right parenthesis equals 2 sin theta plus 1. Which of the following is the graph of the polar function space r equals f left parenthesis theta right parenthesis in the polar coordinate system for 0 less or equal than theta less or equal than 2 pi?

(A)

Polar graph with a spiral line starting at the centre and looping outward, crossing concentric circles and radial lines numbered 1 to 5.


(B)

Polar graph with concentric circles from 1 to 5, lines at regular angles, and a thick, uneven graph tracing between 1 and 3. Labelled polar axis.


(C)

Polar graph with concentric circular grid lines centred on the origin and a plotted curve resembling a heart shape with an internal loop.


(D)

Polar graph with concentric circles centred at the origin and radial lines, displaying a thickly outlined curve, exhibiting one inner loop.


Answer:

Start examining the value of r equals f open parentheses theta close parentheses for different values of theta

When theta equals 0

space f left parenthesis 0 right parenthesis equals 2 sin 0 plus 1 equals 1

  • This rules out option (B), which doesn't go through open parentheses r comma theta close parentheses equals open parentheses 1 comma 0 close parentheses

  • Note as well that the inner loop on the option (A) graph does not make it immediately clear whether the point at r equals 1 on the polar axis actually corresponds to theta equals 0

    • It could also come from theta equals pi with a negative r value

When theta equals pi over 2

space f open parentheses pi over 2 close parentheses equals 2 sin pi over 2 plus 1 equals 3

  • This rules out options (A) and (D), neither of which goes through open parentheses r comma theta close parentheses equals open parentheses 3 comma pi over 2 close parentheses

  • Option (B) goes through that point, but that option was already ruled out in the previous step

That only leaves option (C), which must be the correct answer

  • If in doubt you could confirm this by computing r equals f open parentheses theta close parentheses for other values of theta

  • If you did that you would find that r less than 0 for fraction numerator 7 pi over denominator 6 end fraction less than theta less than fraction numerator 11 pi over denominator 6 end fraction, which is what creates the inner loop on the graph of (C)

The correct answer is (C)

Worked Example

Polar graph with concentric circles and radial lines, displaying a four-petaled rose curve centred at the origin.

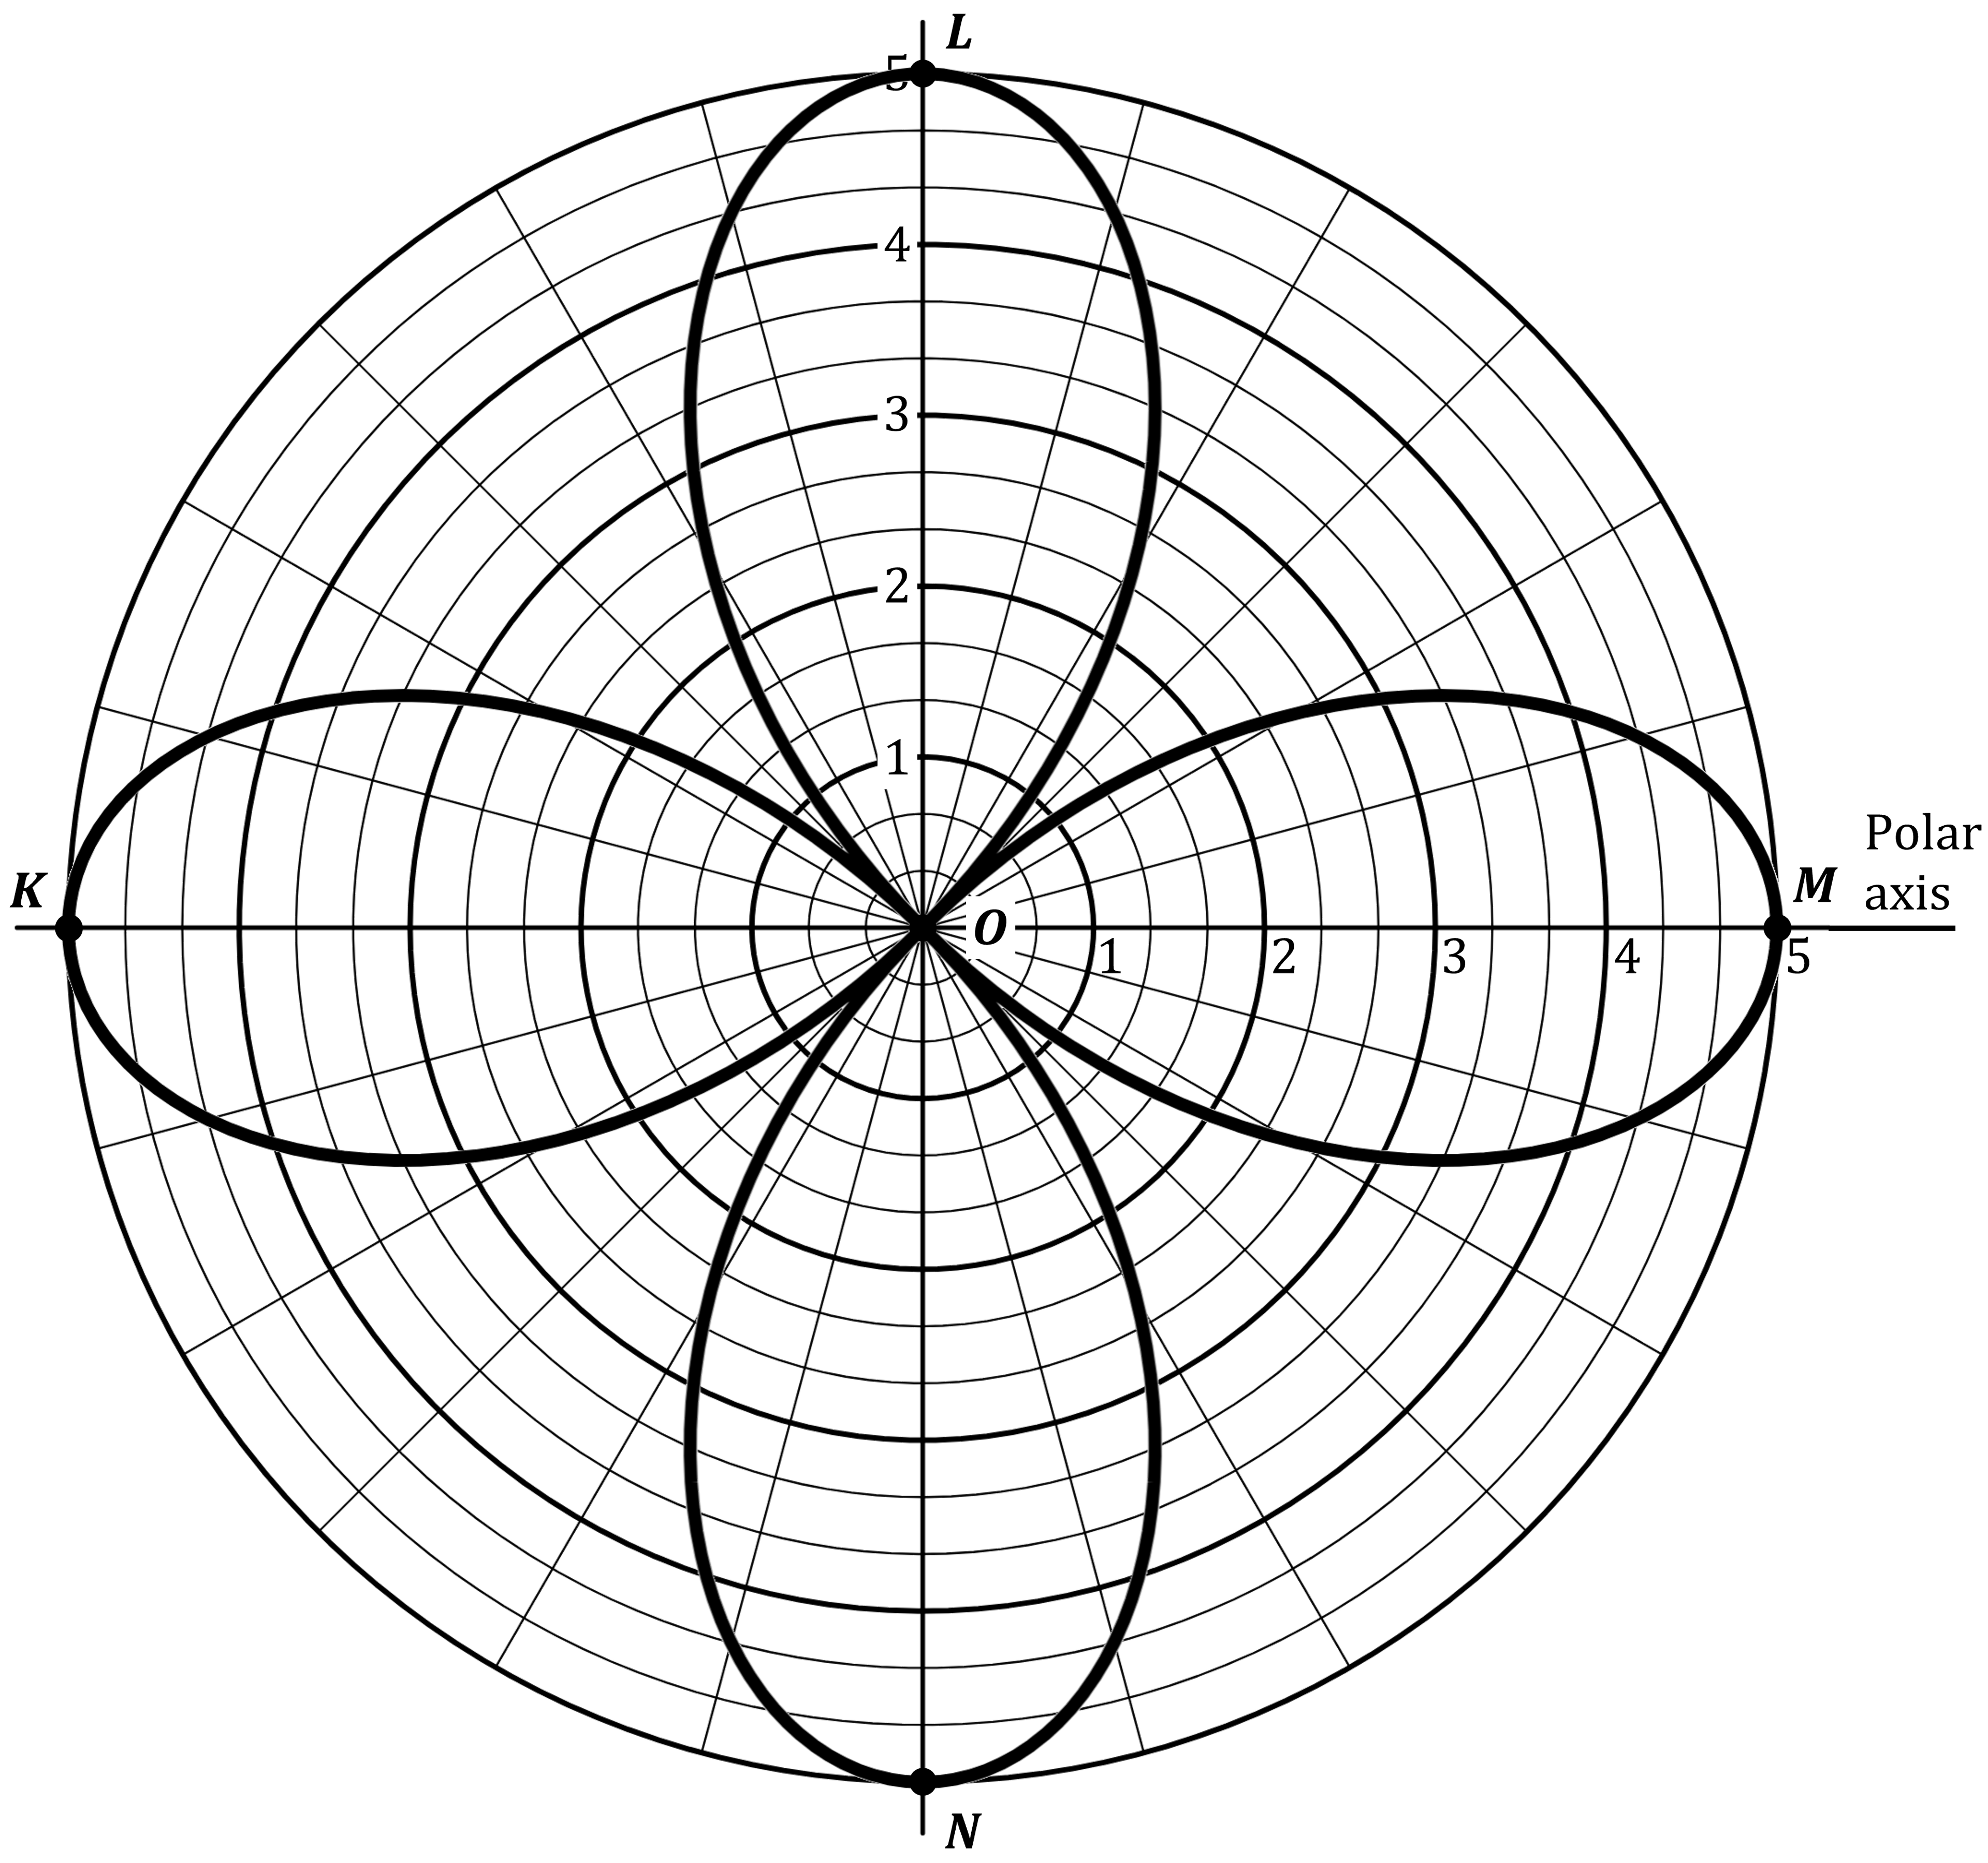
The figure shows the graph of the polar function r equals f left parenthesis theta right parenthesis, where space f left parenthesis theta right parenthesis equals 5 cos left parenthesis 2 theta right parenthesis, in the polar coordinate system for 0 less or equal than theta less or equal than 2 pi. There are five points labeled K comma   L comma   M comma   N, and O, where O is the origin. If the domain of space f is restricted to pi less or equal than theta less or equal than fraction numerator 3 pi over denominator 2 end fraction, the portion of the given graph that remains consists of two pieces. One of those pieces is the portion of the graph in Quadrant III from K to O. Which of the following describes the other remaining piece?

(A) The portion of the graph in Quadrant I from O to L

(B) The portion of the graph in Quadrant I from O to M

(C) The portion of the graph in Quadrant III from O to N

(D) The portion of the graph in Quadrant IV from O to M

Answer:

Note at the start that the terminal rays for pi less or equal than theta less or equal than fraction numerator 3 pi over denominator 2 end fraction are all in Quadrant III

  • So points corresponding to those theta values can only lie in Quadrant III (if values of r equals f open parentheses theta close parentheses are positive) or Quadrant I (if values of r equals f open parentheses theta close parentheses are negative)

  • This instantly rules out answer option (D)
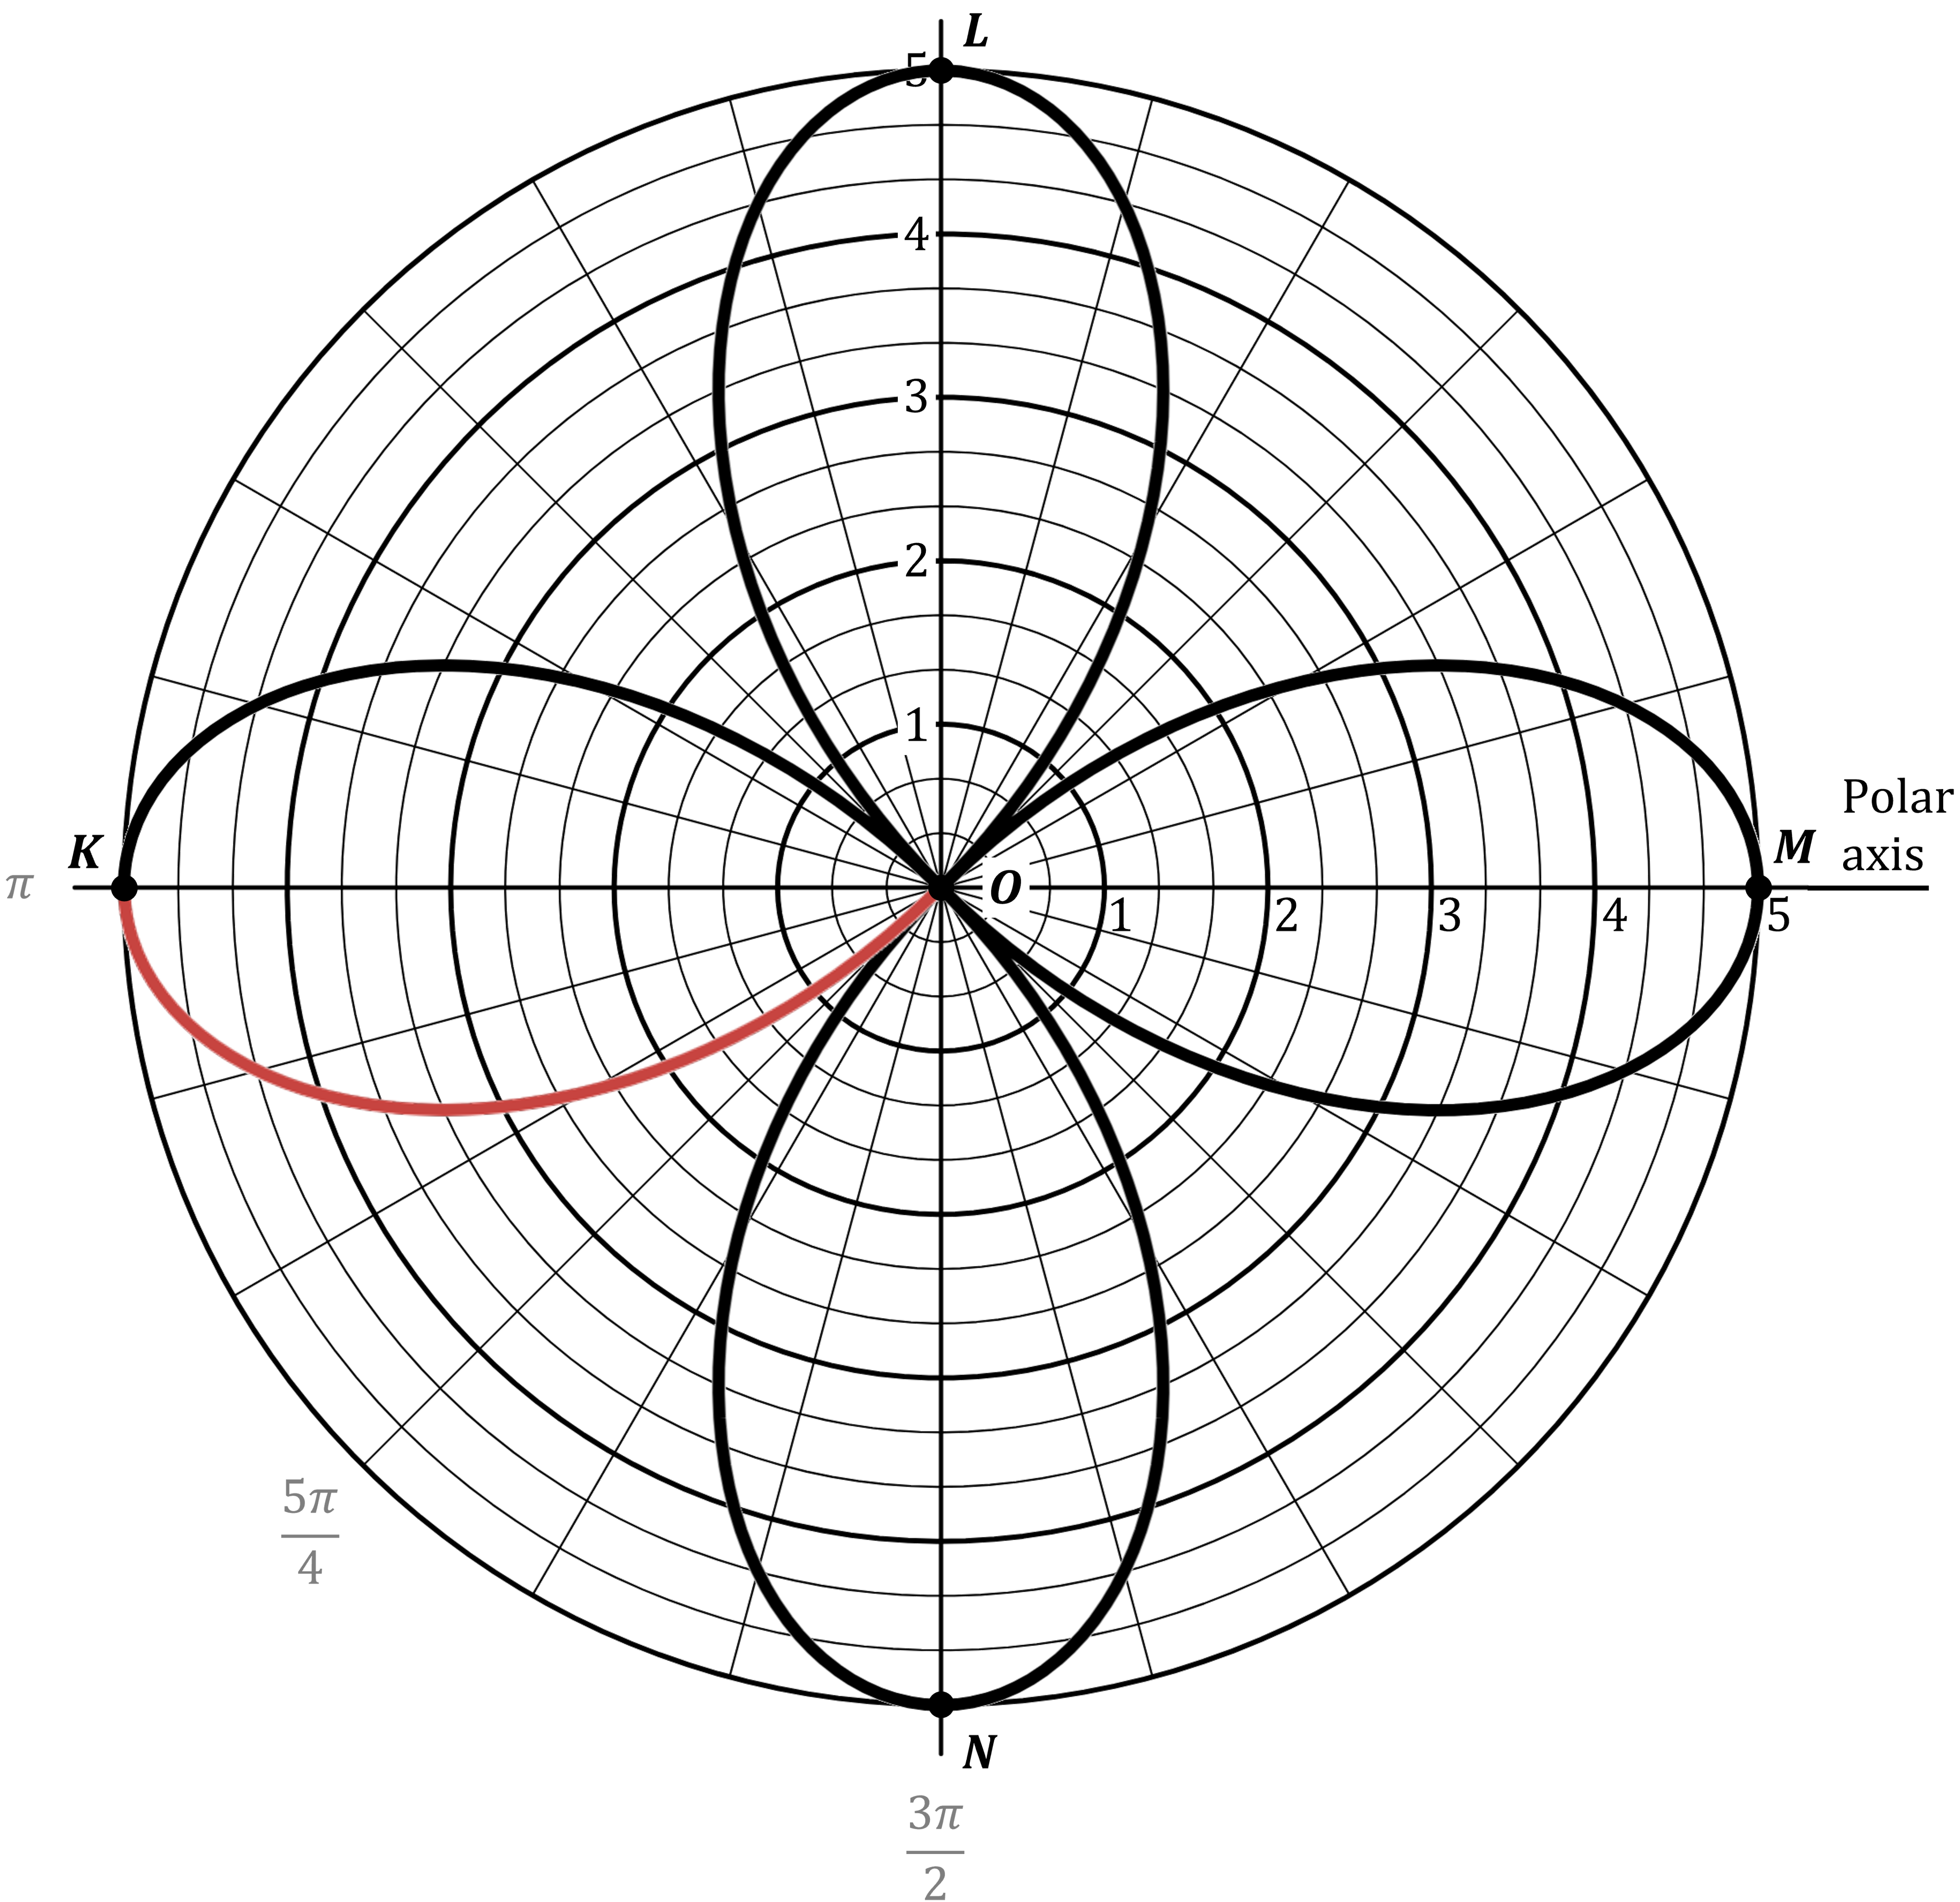
Trace the values of \theta across the restricted domain pi less or equal than theta less or equal than fraction numerator 3 pi over denominator 2 end fraction

At theta equals pi

r equals 5 cos open parentheses 2 pi close parentheses equals 5

  • The terminal ray for theta equals pi points left from the origin (in the opposite direction to the polar axis)

  • and because r is positive, the point lies on that ray at a distance of 5 from the origin

    • This is point K

  • Note that cos open parentheses 2 pi close parentheses equals cos open parentheses 0 close parentheses equals 1

At theta equals fraction numerator 5 pi over denominator 4 end fraction

r equals 5 cos open parentheses 2 times fraction numerator 5 pi over denominator 4 end fraction close parentheses equals 5 cos open parentheses fraction numerator 5 pi over denominator 2 end fraction close parentheses equals 0

  • This is point O at the origin

  • Note that cos open parentheses pi over 2 close parentheses equals 0, and cosine has a period of 2 pi

    • so cos open parentheses pi over 2 plus 2 pi close parentheses equals cos open parentheses fraction numerator 5 pi over denominator 2 end fraction close parentheses is also equal to 0

So going between theta equals pi and theta equals fraction numerator 5 pi over denominator 4 end fraction traces out "the portion of the graph in Quadrant III from K to O" that is mentioned in the question:

The graph from the question, with the portion of the curve in quadrant III between points K and O highlighted in red

For the portion of the graph between theta equals fraction numerator 5 pi over denominator 4 end fraction and theta equals fraction numerator 3 pi over denominator 2 end fraction there are only two possibilities:

  • If r equals f open parentheses theta close parentheses is positive then this portion of the graph will be in Quadrant III, tracing out the portion of the graph between O and N

  • If r equals f open parentheses theta close parentheses is negative then this portion of the graph will be in Quadrant I (in the 'slice' of Quadrant I opposite the slice in Quadrant III between theta equals fraction numerator 5 pi over denominator 4 end fraction and theta equals fraction numerator 3 pi over denominator 2 end fraction), tracing out the portion of the graph between O and L

At theta equals fraction numerator 3 pi over denominator 2 end fraction

r equals 5 cos open parentheses 2 times fraction numerator 3 pi over denominator 2 end fraction close parentheses equals 5 cos open parentheses 3 pi close parentheses equals negative 5

  • The terminal ray for theta equals fraction numerator 3 pi over denominator 2 end fraction points down from the origin

  • However r is negative, so the point lies on the ray opposite to that ray (i.e., up from the origin) at a distance of 5 from the origin

    • This is point L

  • Note that cos open parentheses pi close parentheses equals negative 1, and cosine has a period of 2 pi

    • so cos open parentheses pi plus 2 pi close parentheses equals cos open parentheses 3 pi close parentheses is also equal to negative 1

This means that the second of the two possibilities mentioned above is the correct one

(A) The portion of the graph in Quadrant I from O to L

Unlock more, it's free!

Join the 100,000+ Students that ❤️ Save My Exams

the (exam) results speak for themselves:

Roger B

Author: Roger B

Expertise: Maths Content Creator

Roger's teaching experience stretches all the way back to 1992, and in that time he has taught students at all levels between Year 7 and university undergraduate. Having conducted and published postgraduate research into the mathematical theory behind quantum computing, he is more than confident in dealing with mathematics at any level the exam boards might throw at you.

Mark Curtis

Reviewer: Mark Curtis

Expertise: Maths Content Creator

Mark graduated twice from the University of Oxford: once in 2009 with a First in Mathematics, then again in 2013 with a PhD (DPhil) in Mathematics. He has had nine successful years as a secondary school teacher, specialising in A-Level Further Maths and running extension classes for Oxbridge Maths applicants. Alongside his teaching, he has written five internal textbooks, introduced new spiralling school curriculums and trained other Maths teachers through outreach programmes.