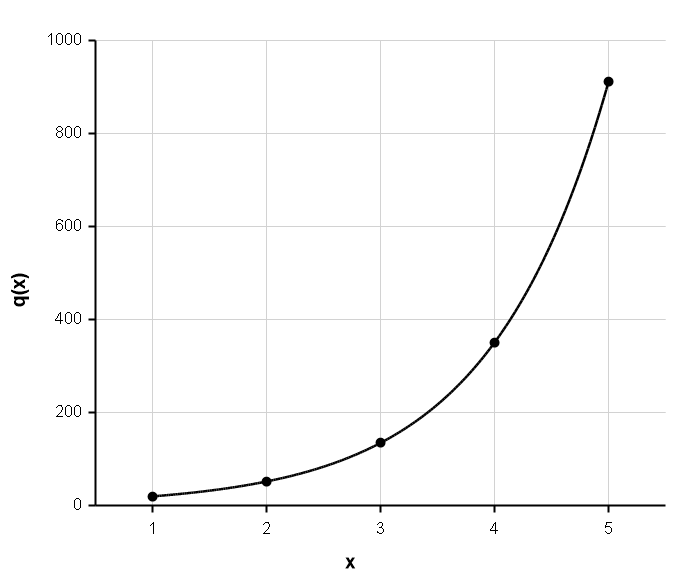
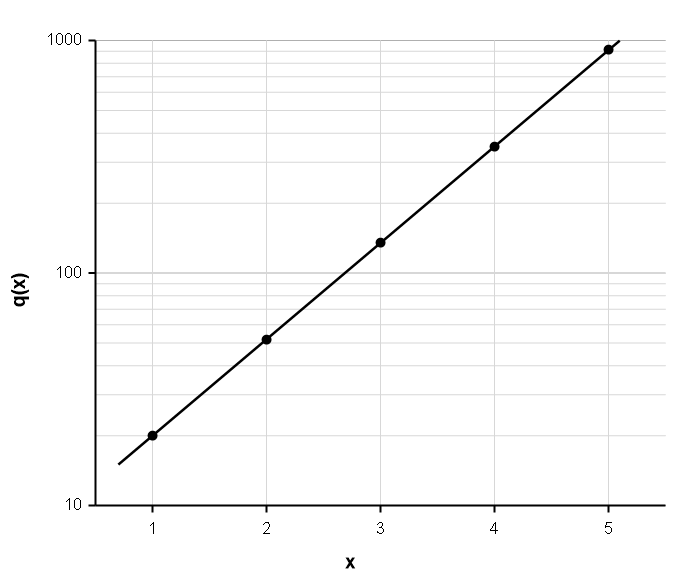
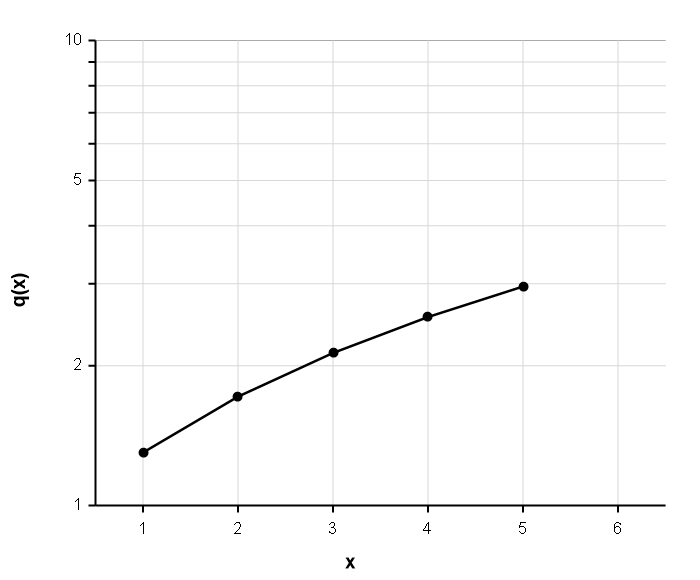
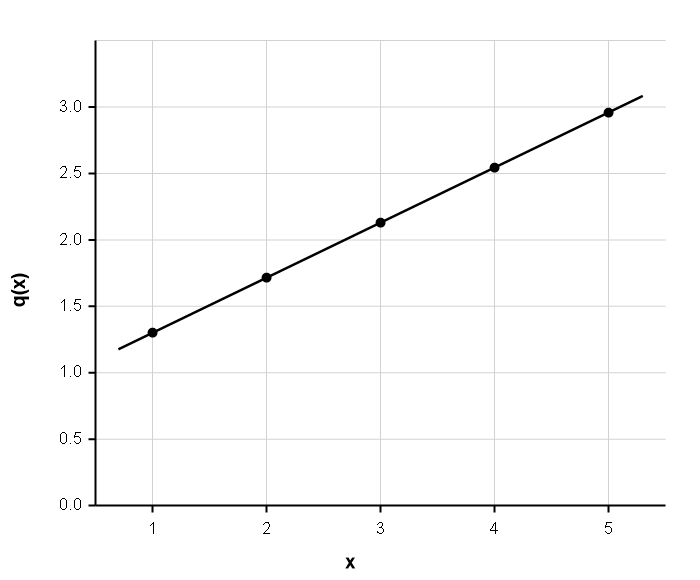
Modeling with Exponential & Logarithmic Functions (College Board AP® Precalculus): Exam Questions

17 mins8 questions
1
Sme Calculator
1 mark

The function g has the property that for each time the output values double, the input values increase by 1. Which of the following could be the graph of y = g \left(x\right) in the x y-plane?

  • Graph with x-axis from 0 to 8 and y-axis from 0 to 8. A curve starts at (1, 0) that is rising and flattening
  • Graph showing an exponential curve increasing steeply, with x-axis from 0 to 8 and y-axis from 0 to 8, labelled x and y respectively.
  • Line graph on a grid, x-axis from 0 to 8, y-axis from 0 to 8. Straight line through (0, 1) and (3,7).
  • A straight line through (0, 1) and (8, 5).
2
Sme Calculator
1 mark

The increasing function N gives the number of subscribers, in thousands, for a new streaming channel. The table gives values of N \left(t\right) for selected values of t, in months, since the channel launched.

t (months)

0

1

2

3

4

N \left(t\right) (thousands)

10

20

40

80

160

If a model is constructed to represent these data, which of the following best applies to this situation?

  • y = 10 t + 10

  • y = \frac{75}{4} t + 10

  • y = 10 \cdot \left(\frac{1}{2}\right)^{t}

  • y = 10 \cdot 2^{t}

3
Sme Calculator
1 mark

The table gives values for a function p at selected values of x.

x

1

2

3

4

5

p \left(x\right)

15

38

97

245

618

Which of the following graphs could represent these data in a semi-log plot, where the vertical axis is logarithmically scaled?

  • Graph with a linear vertical axis scaled from 0 to 700 and horizontal axis from 1 to 6. Five plotted points at approximately (1, 15), (2, 38), (3, 97), (4, 245), and (5, 618) are connected by line segments. The points curve steeply upward, showing a concave-up shape.
  • Graph with a logarithmic vertical axis scaled from 10 to 1000 and horizontal axis from 1 to 6. Five plotted points at approximately (1, 15), (2, 38), (3, 97), (4, 245), and (5, 618) are connected by line segments. The points appear approximately collinear on this scale.
  • Graph with a logarithmic vertical axis scaled from 1 to 10 and horizontal axis from 1 to 6. Five plotted points connected by line segments appear roughly collinear.
  • Graph with a linear vertical axis scaled from 0 to 3 and horizontal axis from 1 to 10. Five plotted points at approximately (1, 0.5), (2, 1.0), (3, 1.5), (4, 2.0), and (5, 2.5) are connected by line segments, forming a straight line. The scale and values do not match the given data.
4
Sme Calculator
1 mark

Two function models f and g are constructed to represent the temperature of a liquid being heated. Both f \left(t\right) and g \left(t\right) represent the temperature, in degrees Celsius, after t minutes for t \geq 1. If f open parentheses t close parentheses equals 80 plus 12 ln t and g open parentheses t close parentheses equals 3 t plus 77, what is the first time t that the temperature predicted by the logarithmic model will be 0.5 degrees more than the temperature predicted by the linear model?

  • t = 0.750

  • t equals 1.058

  • t equals 10.073

  • t equals 12.210