Evaluating in Physics (DP IB Physics: HL): Revision Note

Evaluating in Physics
The evaluation is a critical reflection on your investigation's methodology
This is where you demonstrate your understanding of the scientific process by identifying the weaknesses and limitations of your own work
The goal is to assess the quality of your data and its impact on your conclusion, and to suggest meaningful, realistic improvements
Principles of evaluation
Evaluate your hypothesis
This is the final comment on your hypothesis, which should follow on from your conclusion
Even if your data supported your hypothesis, you should evaluate the strength of this support in light of the uncertainties and errors you have identified
For example:
The data supported the hypothesis that resistance is proportional to length
However, the fact that the y-intercept did not pass through the origin suggests a systematic error was present
This slightly weakens the confirmation of the theoretical model
Identify and discuss sources of error
This is the most important part of your evaluation
You must identify and discuss specific sources of error in your procedure, distinguishing between the two main types
Random errors:
These are unpredictable variations in measurements that occur by chance
They cause results to be scattered around the true value
This affects the precision of measurements
Example 1:
Fluctuations in reaction time when starting and stopping a stopwatch to time oscillations
To correct: measure the time over multiple oscillations and divide by the number of oscillations
Example 2:
Parallax error when reading an analogue meter scale from different angles
To correct: view the scale at eye level
Example 3:
Reading error when measuring length using a ruler with a centimetre scale only
To correct: use a ruler with better precision, i.e. a millimetre scale
Random errors can be minimised by
taking multiple repeat trials and calculating an average
measuring over multiple intervals and dividing by the total e.g. number of oscillations
using a more precise device with smaller measuring intervals

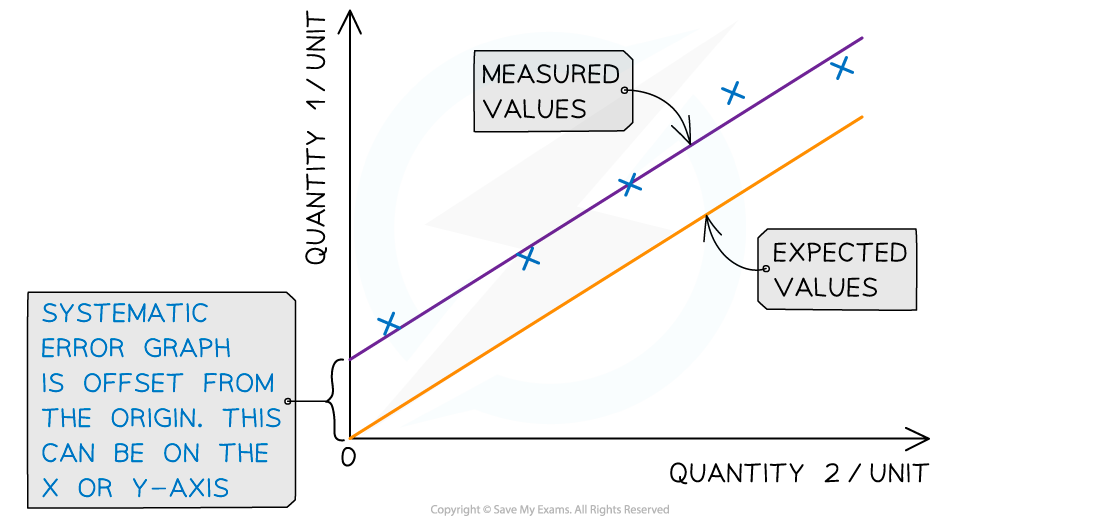
Systematic errors:
These are flaws in the experimental method or apparatus that cause the result to be consistently wrong in the same direction
e.g. readings which are always too high or too low
This affects the accuracy of measurements
Example 1:
A zero error on a digital balance or ammeter that was not corrected
All readings will be consistently offset by the same amount
Example 2:
Not accounting for heat loss in a thermal physics experiment
This will always cause the measured temperature change to be smaller than the true value
Systematic errors can be reduced by
recalibrating apparatus
using different apparatus
making corrections or adjustments to the experimental method
Evaluate methodological weaknesses, limitations and assumptions
Beyond errors, you should also discuss other aspects of your method that affect the quality of your conclusion
Weaknesses:
These are the aspects of your method that lead to significant systematic or random errors
For example:
Timing only a single swing of a pendulum is a key methodological weakness, as the period is very short, making the random error from human reaction time extremely significant
Limitations:
These are factors that limit the scope of your conclusion
They define the boundaries within which your conclusion is valid
For example:
This investigation was limited to a maximum pendulum length of 1.00 m
Therefore, the conclusion that
 is proportional to
  cannot be assumed to be valid for much longer pendulum systems
Assumptions:
These are simplifications made during your calculations that are not perfectly true
For example:
In the analysis of the pendulum, it was assumed that air resistance was negligible and that the string was massless.
In reality, these factors have a minor damping effect on the pendulum's motion
Explain realistic and relevant improvements
For every significant weakness or source of error you identify, you must suggest a specific, realistic improvement
The improvement must be relevant
It should directly address the weakness you identified
The improvement must be realistic
You should be able to carry it out in a typical school laboratory
For example, using a bomb calorimeter is not a realistic improvement
Worked Example
Research question:
"What is the value of the acceleration due to gravity, g, determined from the period and length of a simple pendulum?"
Weakness 1 (systematic error):
The length of the pendulum was measured to the bottom of the bob, not to its centre of mass.
Impact:
This caused the measured length
to be consistently longer than the true effective lengthSince
 is proportional to
 %22%2F%3E%3Cpolyline%20fill%3D%22none%22%20points%3D%226%2C0%202%2C-7%201%2C-6%22%20stroke%3D%22%23000000%22%20stroke-linecap%3D%22square%22%20stroke-width%3D%221%22%20transform%3D%22translate(0.5%2C23.5)%22%2F%3E%3Cline%20stroke%3D%22%23000000%22%20stroke-linecap%3D%22square%22%20stroke-width%3D%221%22%20x1%3D%2214.5%22%20x2%3D%2229.5%22%20y1%3D%224.5%22%20y2%3D%224.5%22%2F%3E%3Ctext%20font-family%3D%22Times%20New%20Roman%22%20font-size%3D%2218%22%20font-style%3D%22italic%22%20text-anchor%3D%22middle%22%20x%3D%2221.5%22%20y%3D%2220%22%3EL%3C%2Ftext%3E%3C%2Fsvg%3E) , this would lead to a consistently larger period for each length, and a calculated value for g that is systematically too high
, this would lead to a consistently larger period for each length, and a calculated value for g that is systematically too high
Realistic Improvement:
The length should be measured to the geometric centre of the bob
For an even more accurate result, the bob's diameter could be measured with vernier callipers, and half of this value could be added to the measured length of the string
Weakness 2 (systematic/random error):
The period was determined by timing 20 oscillations with a manual stopwatch
Impact:
Human reaction time in starting and stopping the watch introduces random error, causing scatter in the measured times
This was visible in the error bars and the slight scatter of points around the line of best fit on the graph
Realistic Improvement:
The precision of the timing could be significantly improved by using a light gate placed at the bottom of the swing to automatically record the period, removing human reaction time error
Limitation:
The experiment relied on the small-angle approximation (θ < 10°)
Impact:
While a protractor was used to set an initial angle of 8°, it was difficult to ensure this was exact for every trial, and the amplitude may have changed during the swings
If the angle becomes too large, the period becomes amplitude-dependent, which would invalidate the theoretical model being tested
Realistic Improvement:
The initial release angle could be more rigorously controlled using a fixed release point
Video analysis could also be used to track the amplitude over the 20 swings to ensure it remains within the small-angle regime
Examiner Tips and Tricks
Be specific.
Never blame "human error".
Instead of saying "My measurements were wrong," identify a specific source of error, like "The parallax error when reading the position of the pointer on the metre ruler could have led to inconsistent length measurements."
Prioritise your evaluation.
Focus on the one or two most significant sources of error that had the biggest impact on your final result.
For a pendulum lab, discussing the measurement of the period or the effective length is always more important than the friction in the pivot.
Close the loop: Weakness → Impact → Improvement.
For every weakness you identify, you must explain its impact on your final result and then suggest a specific improvement to fix it.
Evaluate your own data.
Do not write a generic evaluation that could apply to any experiment.
Refer back to your own results, graphs, and observations.
For example, "The non-zero y-intercept on the
 vs. graph suggests a systematic error, such as contact resistance, was present."

Unlock more, it's free!
Join the 100,000+ Students that ❤️ Save My Exams
the (exam) results speak for themselves:

Was this revision note helpful?
