Cumulative Frequency & Box Plots (AQA GCSE Maths: Higher): Exam Questions

Exam code: 8300

4 hours52 questions
1a
Sme Calculator
2 marks

Some girls did a sponsored swim to raise money for charity.
The table shows information about the amounts of money (£) the girls raised.

Least amount of money (£)

10

Greatest amount of money (£)

45

Median

25

Lower quartile

16

Upper quartile

42

On the grid, draw a box plot for the information in the table.

q1-easy-6-4-cumulative-frequency-edexcel-gcse-maths
1b
Sme Calculator
2 marks

Some boys also did the sponsored swim.
The box plot shows information about the amounts of money (£) the boys raised.

q1b-easy-6-4-cumulative-frequency-edexcel-gcse-maths

Compare the amounts of money the girls raised with the amounts of money the boys raised.

2a
Sme Calculator
2 marks

Sameena recorded the times, in minutes, some girls took to do a jigsaw puzzle.
Sameena used her results to work out the information in this table.


Minutes

Shortest time

18

Lower quartile

25

Median

29

Upper quartile

33

Longest time

44

On the grid, draw a box plot to show the information in the table.

q2a-easy-6-4-cumulative-frequency-edexcel-gcse-maths
2b
Sme Calculator
2 marks

The box plot below shows information about the times, in minutes, some boys took to do the same jigsaw puzzle.

q2b-easy-6-4-cumulative-frequency-edexcel-gcse-maths

Compare the distributions of the girls' times and the boys' times.

3a
Sme Calculator
3 marks

The table shows information about the heights, in cm, of a group of Year 11 girls.


height (cm)

least height

154

median

165

lower quartile

161

interquartile range

7

range

20

Draw a box plot for this information.

q3a-easy-6-4-cumulative-frequency-edexcel-gcse-maths
3b
Sme Calculator
2 marks

The box plot below shows information about the heights, in cm, of a group of Year 7 girls.

q3b-easy-6-4-cumulative-frequency-edexcel-gcse-maths

Compare the distribution of heights of the Year 7 girls with the distribution of heights  of the Year 11 girls.

4a
Sme Calculator
3 marks

The table gives some information about the heights of 80 girls.

Least height

133 cm

Greatest height

170 cm

Lower quartile

145 cm

Upper quartile

157 cm

Median

151 cm

Draw a box plot to represent this information.

q3a-easy-6-4-cumulative-frequency-edexcel-gcse-maths
4b
Sme Calculator
2 marks

Work out an estimate for the number of these girls with a height between 133 cm and 157 cm.

5a
Sme Calculator
1 mark

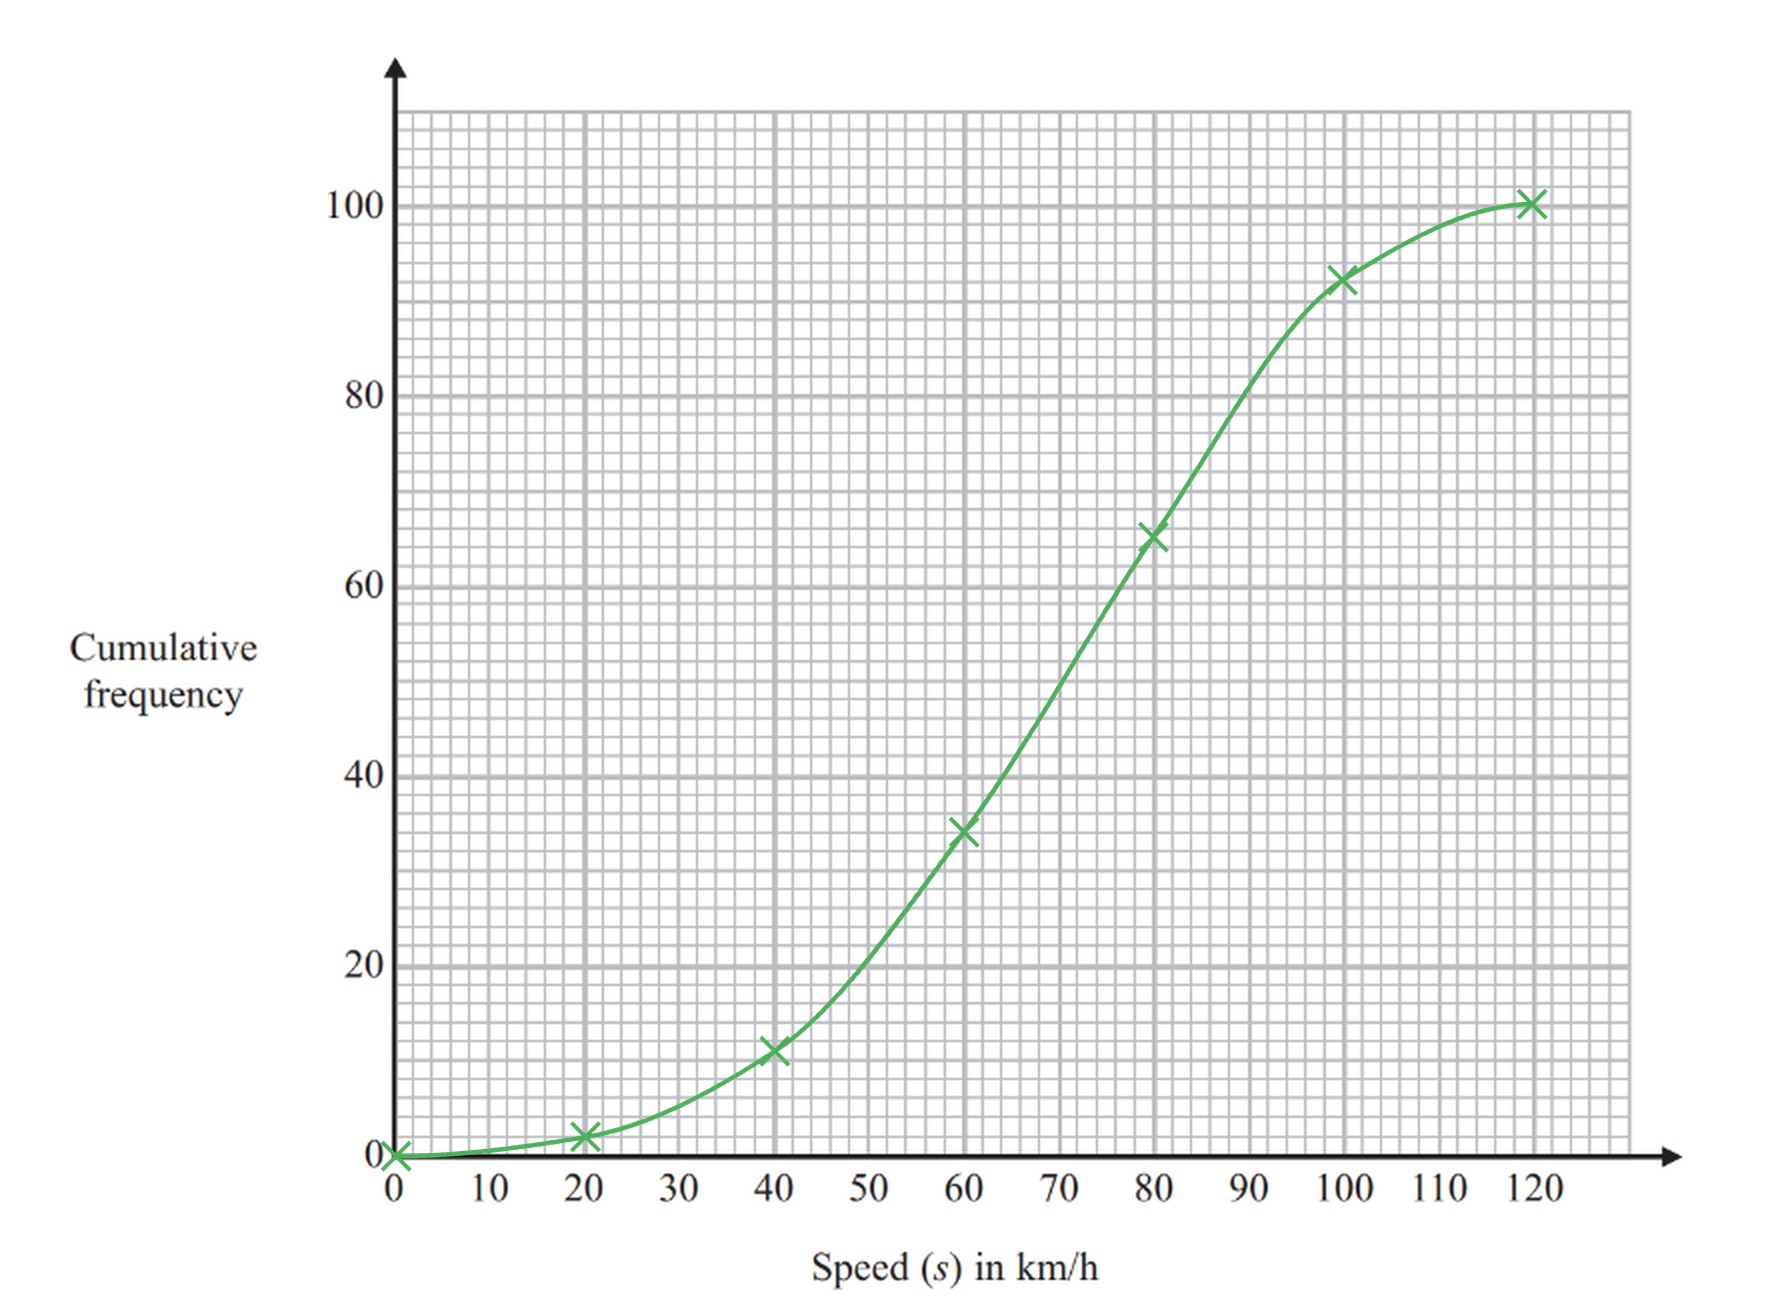
The table shows information about the speeds of  100 lorries.

Speed (s) in km/h

Frequency

0<s20

2

20<s40

9

40<s60

23

60<s80

31

80<s100

27

100<s120

8

Complete the cumulative frequency table for this information.

Speed (s) in km/h

Cumulative frequency

0<s20

2

0<s40


0<s60


0<s80


0<s100


0<s120


5b
Sme Calculator
2 marks

Cumulative frequencies are plotted at the end of the class intervals.
So in these case we would plot the points (20, 2), (40, 11), (60, 34), (80, 65), (100, 92) and (120, 100).
Also plot a point at (0, 0) and join all points with a smooth curve.

6-4-easy-q5b

Five or six points plotted correctly [1]
Points joined [1]

5c
Sme Calculator
2 marks

Find an estimate for the number of lorries with a speed of more than  90 km/h.

6a
Sme Calculator
2 marks

There are  200 workers at a factory.
The cumulative frequency table gives information about their ages.

Age (a years)

Cumulative frequency

0<a20

25

0<a30

70

0<a40

138

0<a50

175

0<a60

186

0<a70

194

0<a80

200

On the grid opposite, draw a cumulative frequency graph for this information.

q6a-easy-6-4-cumulative-frequency-edexcel-gcse-maths
6b
Sme Calculator
2 marks

Graham says,   

 "10% of workers at the factory are older than 65"

Is Graham correct?
You must show how you get your answer.

7a
Sme Calculator
1 mark

Sue works for a company that delivers parcels.

One day the company delivered  80 parcels.
The table shows information about the weights, in kg, of these parcels.

Weight ( w kg)

Frequency

0<w1

19

1<w2

17

2<w3

15

3<w4

12

4<w5

10

5<w6

7

Complete the cumulative frequency table.

Weight ( w kg)

Cumulative frequency

0<w1


0<w2


0<w3


0<w4


0<w5


0<w6


7b
Sme Calculator
2 marks

On the grid opposite, draw a cumulative frequency graph for your table.

PLKM_EeP_q7b-easy-6-4-cumulative-frequency-edexcel-gcse-maths
7c
Sme Calculator
3 marks

Sue says,

   "75 % of the parcels weigh less than 3.4 kg."

Is Sue correct?
You must show how you get your answer.

8a
Sme Calculator
1 mark

The table gives information about the marks gained by some students in an exam.

Mark (m)

Frequency

0<m20

40

20<m40

70

40<m60

60

60<m80

15

80<m100

10

100<m120

5

Complete the cumulative frequency table for this information.

Mark (m)

Cumulative frequency

0<m20


0<m40


0<m60


0<m80


0<m100


0<m120


8b
Sme Calculator
2 marks

On the grid, draw a cumulative frequency graph for your table.

fP8vbTAQ_q8c-easy-6-4-cumulative-frequency-edexcel-gcse-maths
8c
Sme Calculator
2 marks

Use your graph to find an estimate for the number of students who gained a mark of more than 54

9
Sme Calculator
2 marks

The cumulative frequency graph shows some information about the heights, in cm, of 60 students.

vzb~QiEm_q9-easy-6-4-cumulative-frequency-edexcel-gcse-maths

Work out an estimate for the number of these students with a height greater than 160 cm.

10a
Sme Calculator
1 mark

The cumulative frequency graph shows information about the weights of 60 apples.

L~Se3n4d_q10a-easy-6-4-cumulative-frequency-edexcel-gcse-maths

Use the graph to find an estimate for the median weight.

10b
Sme Calculator
2 marks

Use the graph to find an estimate for the interquartile range of the weights.

11a
Sme Calculator
1 mark

The grouped frequency table gives information about the times, in minutes, that 80 office workers take to get to work. 

Time (t minutes)

Frequency

0<t20

5

20<t40

30

40<t60

20

60<t80

15

80<t100

8

100<t120

2

Complete the cumulative frequency table.

Time (t minutes)

Cumulative frequency

0<t20


0<t40


0<t60


0<t80


0<t100


0<t120


11b
Sme Calculator
2 marks

On the grid, draw the cumulative frequency graph for this information.

q11b-easy-6-4-cumulative-frequency-edexcel-gcse-maths
11c
Sme Calculator
3 marks

Use your graph to find an estimate for the percentage of these office workers who take more than  90 minutes to get to work.

12
Sme Calculator
1 mark

Here is a box plot.

q16-paper2h-june2017-aqa-gcse-maths

Circle the median value.

28

35

24

22

13a
Sme Calculator
1 mark

The frequency table gives information about the ages of the 80 people in a train carriage.

Age (a years)

Frequency

0 < a  20

9

20 < a  30

19

30 < a  40

17

40 < a  50

18

50 < a  60

13

60 < a  70

4

Complete the cumulative frequency table.

Age (a years)

Cumulative frequency

0 < a  20


0 < a  30


0 < a  40


0 < a  50


0 < a  60


0 < a  70


13b
Sme Calculator
2 marks

On the grid, draw a cumulative frequency graph for your table.

q11b-paper1hr-nov2020-edexcel-igcse-maths
13c
Sme Calculator
2 marks

Use your graph to find an estimate for the median age of the people in the train carriage.

........................................... years

1a
Sme Calculator
2 marks

The students in a class kept a record of the amount of time, in minutes, they spent doing homework last week.

The table shows information about the amount of time the girls spent doing homework last week.


Minutes

Least amount of time

60

Range

230

Median

170

Lower quartile

100

Upper quartile

220

On the grid, draw a box plot for the information in the table.

q1-medium-6-4-cumulative-frequency-edexcel-gcse-maths
1b
Sme Calculator
2 marks

The box plot below shows information about the amount of time the boys spent doing homework last week.

q1b-medium-6-4-cumulative-frequency-edexcel-gcse-maths

Compare the amount of time the girls spent doing homework with the amount of time the boys spent doing homework.

2a
Sme Calculator
2 marks

Colin took a sample of 80 football players.

He recorded the total distance, in kilometres, each player ran in the first half of their matches on Saturday.

Colin drew this box plot for his results.

q2a-medium-6-4-cumulative-frequency-edexcel-gcse-maths

Work out the interquartile range.

2b
Sme Calculator
2 marks

There were 80 players in Colin's sample.

Work out the number of players who ran a distance of more than 5.6 km.

2c
Sme Calculator
2 marks

Colin also recorded the total distance each player ran in the second half of their matches.

He drew the box plot below for this information.

q2c-medium-6-4-cumulative-frequency-edexcel-gcse-maths

Compare the distribution of the distances run in the first half with the distribution of the distances run in the second half.

3a
Sme Calculator
1 mark

The box plot shows information about the number of countries competing in each Winter Olympic Games since 1948

q3a-medium-6-4-cumulative-frequency-edexcel-gcse-maths

Write down the median.

3b
Sme Calculator
2 marks

Work out the interquartile range.

3c
Sme Calculator
2 marks

The table below shows information about the number of countries competing in each Summer Olympic Games since 1948


Smallest

Lower quartile

Median

Upper quartile

Largest

Number of countries

59

83

121

199

204

Compare the two distributions.

4a
Sme Calculator
3 marks

The box plots give information about the wages of a group of 16 year old workers and a group of 18 year old workers.

q4a-medium-6-4-cumulative-frequency-edexcel-gcse-maths

Compare the distribution of the wages of the 16 year old workers with the distribution of the wages of the 18 year old workers.

4b
Sme Calculator
2 marks

There are 200 workers who are 16 years old.

Work out an estimate for the number of these workers whose wages are £130 or more.

5
Sme Calculator
3 marks

Some students were asked how many times they each used their mobile phones last week.

The box plots give information about the male students' answers and about the female students' answers.

q5-medium-6-4-cumulative-frequency-edexcel-gcse-maths

Compare the two distributions represented by the box plots.

6a
Sme Calculator
2 marks

The box plot shows information about the distribution of the amounts of money spent by some male students on their holidays.

q6a-medium-6-4-cumulative-frequency-edexcel-gcse-maths

Work out the interquartile range for the amounts of money spent by these male students.

6b
Sme Calculator
2 marks

The table below shows information about the distribution of the amounts of money spent by some female students on their holidays.


Smallest

Lower quartile

Median

Upper quartile

Largest

Money spent (£)

60

180

300

350

650

On the grid above, draw a box plot for the information in the table.

6c
Sme Calculator
1 mark

Chris says,    "The box plots show that the female students spent more money than the male students."

Is Chris correct? Give a reason for your answer.

7a
Sme Calculator
1 mark

Charlotte grows some potatoes.

The table shows information about the weights of her potatoes.

 Weight (w grams)

 Frequency

100<w120

5

120<w140

25

140<w160

30

160<w180

15

180<w200

5

Complete the cumulative frequency table.

 Weight (w grams)

Cumulative frequency

100<w120


100<w140


100<w160


100<w180


100<w200


7b
Sme Calculator
2 marks

On the grid opposite, draw a cumulative frequency graph for your table.

x_jTmCoZ_q7b-medium-6-4-cumulative-frequency-edexcel-gcse-maths
7c
Sme Calculator
2 marks

Use your graph to find an estimate for the interquartile range.

7d
Sme Calculator
3 marks

Use your graph to find an estimate for the percentage of Charlotte's potatoes with a weight less than 150 grams.

8a
Sme Calculator
3 marks

The table below shows information about the heights of  60 students.

Height (x cm)

Number of students

140<x150

4

150<x160

5

160<x170

16

170<x180

27

180<x190

5

190<x200

3

On the grid opposite, draw a cumulative frequency graph for the information in the table.

8b
Sme Calculator
3 marks
TUVVKr2T_q8b-medium-6-4-cumulative-frequency-edexcel-gcse-maths

Find an estimate

i) for the median,

[2]

ii) for the interquartile range.

[1]

9a
Sme Calculator
1 mark

The grouped frequency table shows information about the weekly wages of 80 factory workers.

Weekly wage(£x)

Frequency

100<x200

8

200<x300

15

300<x400

30

400<x500

17

500<x600

7

600<x700

3

Complete the cumulative frequency table.

Weekly wage(£x)

Cumulative frequency

100<x200


100<x300


100<x400


100<x500


100<x600


100<x700


9b
Sme Calculator
2 marks

On the grid opposite, draw a cumulative frequency graph for your table.

q9b-medium-6-4-cumulative-frequency-edexcel-gcse-maths
9c
Sme Calculator
2 marks

Use your graph to find an estimate for the interquartile range.

9d
Sme Calculator
2 marks

Use your graph to find an estimate for the number of workers with a weekly wage of more than £530

10a
Sme Calculator
1 mark

The table shows information about the times taken by 100 people in a fun run.

Time ( t minutes)

Frequency

20<t30

4

30<t40

16

40<t50

36

50<t60

24

60<t70

14

70<t80

6

Complete the cumulative frequency table for this information.

Time ( t minutes)

Cumulative frequency

20<t30


20<t40


20<t50


20<t60


20<t70


20<t80


10b
Sme Calculator
2 marks

On the grid, draw a cumulative frequency graph for your table.

q10b-medium-6-4-cumulative-frequency-edexcel-gcse-maths
10c
Sme Calculator
1 mark

Use your graph to find an estimate for the median time.

10d
Sme Calculator
2 marks

Use your graph to find an estimate for the number of people who took longer than  63 minutes.

11a
Sme Calculator
1 mark

The cumulative frequency graph shows information about the weights of 60 potatoes.

q11a-medium-6-4-cumulative-frequency-edexcel-gcse-maths

Use the graph to find an estimate for the median weight.

11b
Sme Calculator
1 mark

Jamil says,    "80 - 40 = 40 so the range of the weights is 40 g."

Is Jamil correct?
You must give a reason for your answer.

11c
Sme Calculator
2 marks

Show that less than 25% of the potatoes have a weight greater than 65 g.

12a
Sme Calculator
2 marks

The cumulative frequency table shows the marks some students got in a test.

Mark (m)

Cumulative frequency

0<m10

8

0<m20

23

0<m30

48

0<m40

65

0<m50

74

0<m60

80

On the grid, plot a cumulative frequency graph for this information.

q12a-medium-6-4-cumulative-frequency-edexcel-gcse-maths
12b
Sme Calculator
1 mark

Find the median mark.

12c
Sme Calculator
3 marks

Students either pass the test or fail the test.
The pass mark is set so that 3 times as many students fail the test as pass the test.

Find an estimate for the lowest possible pass mark.

13a
Sme Calculator
1 mark

The table gives information about the times, in minutes, taken by 80 customers to do their shopping in a supermarket.

Time taken (t minutes)

Frequency

0<t10

7

10<t20

26

20<t30

24

30<t40

14

40<t50

7

50<t60

2

Complete the cumulative frequency table.

Time taken (t minutes)

Cumulative frequency

0<t10


0<t20


0<t30


0<t40


0<t50


0<t60


13b
Sme Calculator
2 marks

On the grid, draw a cumulative frequency graph for your table.

q12-january-2022-1h-edexcel-igcse-maths
13c
Sme Calculator
1 mark

Use your graph to find an estimate for the median time taken.

.................................... minutes

13d
Sme Calculator
2 marks

One of the 80 customers is chosen at random.

Use your graph to find an estimate for the probability that the time taken by this customer was more than 42 minutes.

14a
Sme Calculator
2 marks

The cumulative frequency graph gives information about the weights, in grams, of 90 bags of sweets.

q11-4ma1-1h-qp-jan21-paper1-igcse-maths

Find an estimate for the median of the weights of these bags of sweets.

...................................................... grams

14b
Sme Calculator
3 marks

Roberto sells the bags of sweets to raise money for charity.
Bags with a weight greater than d grams are labelled large bags and sold for 3.75 euros each bag.

The total amount of money he receives by selling all the large bags is 93.75 euros.
Find the value of d.

15a
Sme Calculator
1 mark

The manager of a call centre asked the 120 people, who rang the call centre last week, how long they each waited before their call was answered.
The table gives information about their replies.

Time waited (t minutes)

Frequency

0 < t  5

8

5 < t  10

15

10 < t  15

17

15 < t  20

28

20 < t  25

33

25 < t  30

19

Complete the cumulative frequency table.

Time waited (t minutes)

Cumulative Frequency

0 < t  5


0 < t  10


0 < t  15


0 < t  20


0 < t  25


0 < t  30


15b
Sme Calculator
2 marks

On the grid, draw a cumulative frequency graph for your table.

q11b-4ma1-1hr-qp-jan21-paper1-igcse-maths
15c
Sme Calculator
1 mark

Use your graph to find an estimate for the median of the times waited.

...................................................... minutes

15d
Sme Calculator
2 marks

Using your graph, find an estimate for the percentage of the 120 people who said that they waited longer than 23 minutes before their call was answered.
Show your working clearly.

......................................................% 

16a
Sme Calculator
1 mark

The table gives information about the times taken by 90 runners to complete a 10 km race.

Time (t minutes)

Frequency

25 < t  35

12

35 < t  45

24

45 < t  55

28

55 < t  65

12

65 < t  75

10

75 < t  85

4

Complete the cumulative frequency table.

Time (t minutes)

Cumulative frequency

25 < t  35

12

25 < t  45


25 < t  55


25 < t  65


25 < t  75


25 < t  85


16b
Sme Calculator
2 marks

On the grid below, draw a cumulative frequency graph for your table.

q11b-4ma1-1h-qp-nov21-paper1-igcse-maths
16c
Sme Calculator
2 marks

Any runner who completed the race in a time T minutes such that 42 < T  52 minutes was awarded a silver medal.

Use your graph to find an estimate for the number of runners who were awarded a silver medal.

....................................................... runners

17a
Sme Calculator
3 marks

The times that 48 trains left a station on Monday were recorded.

The cumulative frequency graph gives information about the numbers of minutes the trains were delayed, correct to the nearest minute.

screen-shot-2023-01-25-at-8-08-35-pm

The shortest delay was 0 minutes.
The longest delay was 42 minutes.

On the grid below, draw a box plot for the information about the delays on Monday.

screen-shot-2023-01-25-at-8-09-54-pm
17b
Sme Calculator
2 marks

48 trains left the station on Tuesday.

The box plot below gives information about the delays on Tuesday.

gcse-edexcel-2018-nov-p3-q4b

Compare the distribution of the delays on Monday with the distribution of the delays on Tuesday.

......................................................................................................................

......................................................................................................................

17c
Sme Calculator
1 mark

Mary says,

“ The longest delay on Tuesday was 33 minutes.

This means that there must be some delays of between 25 minutes and 30 minutes.”

Is Mary right?

You must give a reason for your answer.

1
Sme Calculator
4 marks

Tom recorded the times, in seconds, some boys took to complete an obstacle course.
He drew this box plot for his results.

q1-hrd-6-4-cumulative-frequency-edexcel-gcse-maths

Tom also recorded the times some girls took to complete the obstacle course. Here are the times, in seconds, for the girls.

99

101

103

106

108

109

110

110

111

112

113

114

115

115

117

120

124

125

132


Compare the distribution of the times for the boys with the distribution of the times for the girls.

2a
Sme Calculator
3 marks

Ben played 15 games of basketball.
Here are the points he scored in each game.

17

18

18

18

19

20

20

22

23

23

23

26

27

28

28

Draw a box plot for this information.

q2-hrd-6-4-cumulative-frequency-edexcel-gcse-maths
2b
Sme Calculator
2 marks

Sam plays in the same 15 games of basketball.

The median number of points Sam scored is 23
The interquartile range of these points is 12
The range of these points is 20

Who is more consistent at scoring points, Sam or Ben?
You must give a reason for your answer.

3a
Sme Calculator
3 marks

Here are the times, in seconds, that 15 people waited to be served at Rose's garden centre.

5

9

11

14

15

20

22

25

27

27

28

30

32

35

44

On the grid, draw a box plot for this information.

q3a-hrd-6-4-cumulative-frequency-edexcel-gcse-maths
3b
Sme Calculator
2 marks

The box plot below shows the distribution of the times that people waited to be served at Green's garden centre.

q3b-hrd-6-4-cumulative-frequency-edexcel-gcse-maths

Compare the distribution of the times that people waited at Rose's garden centre and the distribution of the times that people waited at Green's garden centre.

4a
Sme Calculator
1 mark

Harry grows tomatoes.
This year he put his tomato plants into two groups, group A and group B.

Harry gave fertiliser to the tomato plants in group A.
He did not give fertiliser to the tomato plants in group B.

Harry weighed 60 tomatoes from group A.
The cumulative frequency graph shows some information about these weights.

q4a-hrd-6-4-cumulative-frequency-edexcel-gcse-maths

Use the graph to find an estimate for the median weight.

4b
Sme Calculator
3 marks

The 60 tomatoes from group A    
had a minimum weight of 153 grams    
and a maximum weight of 186 grams.

Use this information and the cumulative frequency graph to draw a box plot for the 60 tomatoes from group A.

q4b-hrd-6-4-cumulative-frequency-edexcel-gcse-maths
4c
Sme Calculator
2 marks

Harry did not give fertiliser to the tomato plants in group B.

Harry weighed 60 tomatoes from group B.
He drew this box plot for his results.

q4c-hrd-6-4-cumulative-frequency-edexcel-gcse-maths

Compare the distribution of the weights of the tomatoes from group A with the distribution of the weights of the tomatoes from group B.

5a
Sme Calculator
1 mark

The cumulative frequency graph shows information about the times 80 swimmers take to swim 50 metres.

q5a-hrd-6-4-cumulative-frequency-edexcel-gcse-maths

Use the graph to find an estimate for the median time.

5b
Sme Calculator
3 marks

A swimmer has to swim 50 metres in 60 seconds or less to qualify for the swimming team.

The team captain says,

   "More than 25% of swimmers have qualified for the swimming team."

Is the team captain right?
You must show how you got your answer.

5c
Sme Calculator
3 marks

For these 80 swimmers

   the least time taken was 28 seconds
   and the greatest time taken was 96 seconds.

Use the cumulative frequency graph and the information above to draw a box plot for the times taken by the swimmers.

q5c-hrd-6-4-cumulative-frequency-edexcel-gcse-maths
6a
Sme Calculator
2 marks

The cumulative frequency graphs show information about the times taken by 100 male runners and by 100 female runners to finish the London marathon. 

q6-hrd-6-4-cumulative-frequency-edexcel-gcse-maths

A male runner is chosen at random.

Find an estimate for the probability that this runner took less than 4 hours to finish the London marathon.

6b
Sme Calculator
4 marks

Use medians and interquartile ranges to compare the distribution of the times taken by the male runners with the distribution of the times taken by the female runners.

7a
Sme Calculator
3 marks

Here is some information about the miles per gallon of 60 cars.

Miles per gallon, x

Frequency


40 < x  50

6


50 < x  60

16


60 < x  70

28


70 < x  80

10


Draw a cumulative frequency graph.

q22a-paper1h-nov2017-aqa-gcse-maths
7b
Sme Calculator
2 marks

Use the graph to work out the interquartile range.

...........................miles per gallon

8a
Sme Calculator
2 marks

The cumulative frequency graph represents the masses of 40 necklaces.

q16-paper-1h-nov-2021-aqa-gcse-maths

A jeweller buys every necklace with mass greater than 21 grams.

Use the graph to estimate how many she buys.

8b
Sme Calculator
3 marks

The lowest mass was 3 grams.

The highest mass was 28 grams.

Draw a box plot to represent the data.

q16b-paper-1h-nov-2021-aqa-gcse-maths
9a
Sme Calculator
1 mark

The cumulative frequency graph shows information about the masses of 200 apples.

q17-paper-2h-nov-2020-aqa-gcse-maths

Estimate the median mass.

................................grams

9b
Sme Calculator
3 marks

Apples with mass 90 grams or less cost 32p each.

Apples with mass more than 90 grams cost 39p each.
Estimate the total cost of the 200 apples.

£...................................

10a
Sme Calculator
3 marks

Here is some information about the marks of 60 students in a test.

Mark,

Frequency


40 < m  50

9


50 < m  60

16


60 < m  70

20


70 < m  80

8


80 < m  90

7


On the grid, draw a cumulative frequency graph.

q19a-paper1h-june2017-aqa-gcse-maths
10b
Sme Calculator
2 marks

Use your graph to estimate the lowest mark of the top 20% of students.

11
Sme Calculator
3 marks

A group of 60 students each sat an algebra test and a geometry test. Each test was marked out of 110

The cumulative frequency graph gives information about the marks gained by the 60 students in the algebra test.

q14-4ma1-2hr-qp-jan22-paper2-igcse-maths

To be awarded a grade A in the algebra test, a student had to gain a mark greater than 64

Two students are to be selected at random from the 60 students in the group.

Use the graph to find an estimate for the probability that both of these students were awarded a grade A in the algebra test.

12
Sme Calculator
3 marks

The cumulative frequency graph gives information about the weights, in grams, of 90 bags of sweets.

q11-4ma1-1h-qp-jan21-paper1-igcse-maths

Roberto sells the bags of sweets to raise money for charity.
Bags with a weight greater than d grams are labelled large bags and sold for 3.75 euros each bag.

The total amount of money he receives by selling all the large bags is 93.75 euros.

Find the value of d.

13
Sme Calculator
3 marks

A total of 80 national and international runners took part in a race. The cumulative frequency graph gives information about the times, in minutes, they took for the race.

q12-4ma1-1h-qp-jan20-paper1-igcse-maths

60% of the national runners took 50 minutes or less for the race. No international runner took 50 minutes or less for the race.

Work out an estimate for the number of national runners who took part in the race.

14
Sme Calculator
3 marks

The cumulative frequency graph shows information about the length, in minutes, of each of 80 films.

q10-paper1h-june2018-edexcel-igcse-maths

Clare says,

“More than 35% of these films are over 120 minutes long.”

Is Clare correct?
Give a reason for your answer.

15a
Sme Calculator
1 mark

A group of 60 students each sat an algebra test and a geometry test.
Each test was marked out of 110

The cumulative frequency graph gives information about the marks gained by the 60 students in the algebra test.

q14-4ma1-2hr-qp-jan22-paper2-igcse-maths

Use the graph to find an estimate for the median mark in the algebra test.

15b
Sme Calculator
1 mark

Use the graph to find an estimate for the number of students who gained 58 marks or less in the algebra test.

15c
Sme Calculator
2 marks

Use the graph to find an estimate for the interquartile range of the marks gained in the algebra test.

15d
Sme Calculator
1 mark

The interquartile range of the marks gained in the geometry test is 9

Luis says

“The students’ marks are more spread out in the algebra test than in the geometry test.”

Is Luis correct?

Give a reason for your answer.

15e
Sme Calculator
3 marks

To be awarded a grade A in the algebra test, a student had to gain a mark greater than 64

Two students are to be selected at random from the 60 students in the group.

Use the graph to find an estimate for the probability that both of these students were awarded a grade A in the algebra test.

16a
Sme Calculator
2 marks

The cumulative frequency table gives information about the distance, in kilometres, that each of 80 workers travel from home to work at Office A.

Distance travelled (d km)

Cumulative frequency

0 < d  5

17

0 < d 10

32

0 < d  15

57

0 < d  20

70

0 < d  25

76

0 < d  30

80

On the grid below, draw a cumulative frequency graph for the information in the table.

q12a-4ma1-2h-qp-june21-paper2-igcse-maths
16b
Sme Calculator
1 mark

Use your graph to find an estimate for the median distance travelled.

....................................................... km

16c
Sme Calculator
2 marks

Use your graph to find an estimate for the interquartile range of the distances travelled.

....................................................... km

16d
Sme Calculator
2 marks

For Office B, the median distance workers travel from home to work is 15 km and the interquartile range is 5 km.

Use the information above to compare the distances that workers at Office A and workers at Office B travel from home to work.
Write down two comparisons.

17a
Sme Calculator
1 mark

The cumulative frequency graph gives information about the waiting times, in minutes, of people with appointments at Hospital A.

q12-4ma1-1hr-qp-jan20-paper1-igcse-maths

Use the graph to find an estimate of the median waiting time at Hospital A.

.........................minutes

17b
Sme Calculator
2 marks

Use the graph to find an estimate of the interquartile range of the waiting times at Hospital A.

............................... minutes

17c
Sme Calculator
2 marks

At a different hospital, Hospital B, the median waiting time is 28 minutes and the interquartile range of the waiting times is 19 minutes.

Compare the waiting times at Hospital A with the waiting times at Hospital B.

18a
Sme Calculator
2 marks

The cumulative frequency graph shows information about the length, in minutes, of each of 80 films.

q10-paper1h-june2018-edexcel-igcse-maths

Use the graph to find an estimate for the interquartile range.

....................................................... minutes

18b
Sme Calculator
3 marks

Clare says,

“More than 35% of these films are over 120 minutes long.”

Is Clare correct?
Give a reason for your answer.

19a
Sme Calculator
1 mark

The cumulative frequency graph summarises the annual salary, p (£ thousands), of the 60 workers in a factory.

q12-paper4-nov2019-ocr-gcse-maths

Use the graph to estimate the median annual salary.

£ ...................................... thousands

19b
Sme Calculator
2 marks

Complete this cumulative frequency table.

Annual salary, p (£ thousands)

Cumulative frequency

p  10


p  20


p  30


p  50


p  80


19c
Sme Calculator
5 marks

Use the information in the cumulative frequency table to calculate an estimate of the mean annual salary.

£ ...................................... thousands

19d
Sme Calculator
1 mark

Explain why your estimate of the median is more reliable than your estimate of the mean.

20
Sme Calculator
3 marks

The cumulative frequency graph shows the distribution of the heights of members of a rowing club.

q13a-paper4-june2019-ocr-gcse-maths

Calculate the percentage of the members who are at least 180 cm tall.

21
Sme Calculator
3 marks

The cumulative frequency graph shows information about the marks scored by a group of 80 students in a test.

q15-paper5-nov2018-ocr-gcse-maths

The ratio of the number of students passing the test compared to failing the test is 4 : 1.
Find the minimum mark needed to pass the test.

22a
Sme Calculator
3 marks

Iqrah carries out a survey of 200 families in the north of England on their weekly spending on food.

The cumulative frequency diagram summarises the results.

q15-paper5-nov2017-ocr-gcse-maths

Find

i) the median,

£ ................. [1]

ii) the interquartile range.

£ ................. [2]

22b
Sme Calculator
2 marks

Iqrah says

   15% of these families spent over £120.

Is her statement correct?
State the evidence you have used in making your decision.

22c
Sme Calculator
4 marks

In a survey of 200 families in the south of England, the median weekly amount spent on food was £84 and the interquartile range was £28.

Make two comparisons between the weekly amounts spent on food in the north of England and the south of England.
State the evidence you have used in making your comparisons.

1 .................... [2]

2 .................... [2]