Ecosystems & Biodiversity (AQA GCSE Combined Science: Synergy: Life & Environmental Sciences): Exam Questions

Exam code: 8465

2 hours13 questions
1a
1 mark

Plants use root hairs to take in water and minerals from the soil.

Figure 7 shows a root hair cell .
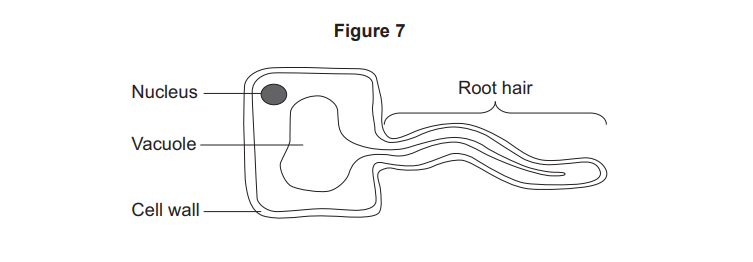
Diagram of a root hair cell showing labelled nucleus, large vacuole, thick cell wall and long thin root hair extension for water absorption

Complete the sentence.

Choose the answer from the box.

evaporation

osmosis

photosynthesis

Water moves into the root hair cell by the process of ___________ .

1b
2 marks

Explain the advantage to a plant of having root hairs.

Use Figure 7.

1c
1 mark

Plants need minerals for healthy growth.

Minerals in the soil are an abiotic factor that affects plant growth.

What is one other abiotic factor that affects plant growth?

  • Fungal disease

  • Predators

  • Water

1d
4 marks

Fertilisers contain minerals.

Fertilisers can be added to the soil.

Table 3 gives information about two different fertilisers.

Table 3

Fertiliser A

Fertiliser B

Mass

500 g

500 g

Cost

£5.00

£7.00

Type

Powder

Liquid

How to use

Add 25 g of the powder evenly onto 1 m2 of soil

Add one bottle cap of the liquid (25 g) to water in a watering can, then pour onto soil

When to use

Use every 3 months

Use every week

Both fertilisers can be used on the same plants and contain the same minerals.

Evaluate which fertiliser would be best for a gardener to buy and to use.

Use Table 3.

2a
1 mark

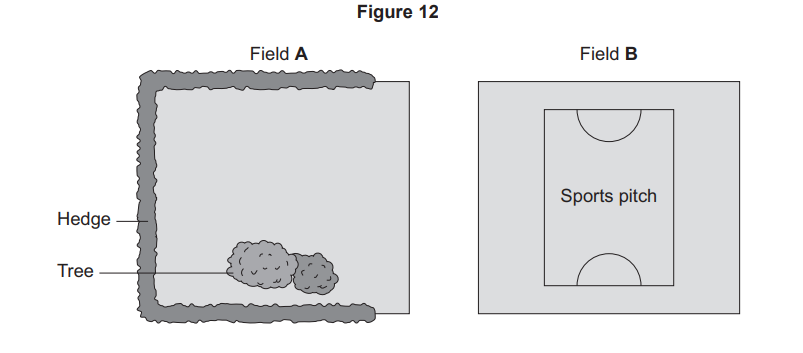
A student investigated the number of plants in two fields.

Figure 12 shows the fields.

Diagram of two fields: Field A bordered on two sides by a hedge with a labelled tree inside; Field B with a marked rectangular sports pitch and goals.

This is the method used.

  1. Place a quadrat randomly in field A.

  2. Count the number of plants in the quadrat. Do not count grasses.

  3. Repeat steps 1 and 2 another five times.

  4. Repeat steps 1 to 3 in field B.

The student used a quadrat to count the number of plants.

What is a quadrat?

  • An identification chart

  • A square frame

  • A tape measure

2b
Sme Calculator
2 marks

Table 4 shows the results.

Table 4

Quadrat number

Number of plants

Field A

Field B

1

4

2

2

6

1

3

3

2

4

8

2

5

7

2

6

2

3

Mean

X

2

Calculate mean value X in Table 4.

2c
Sme Calculator
2 marks

The area of the quadrat used was 1 m².

Field B was 100 m long and 90 m wide.

Calculate the total number of plants in field B.

You should calculate:

  • the area of the field

  • the total number of plants.

Use the data in Table 4.

2d
1 mark

The mean number of plants in field A is greater than in field B.

Suggest one reason why.

2e
3 marks

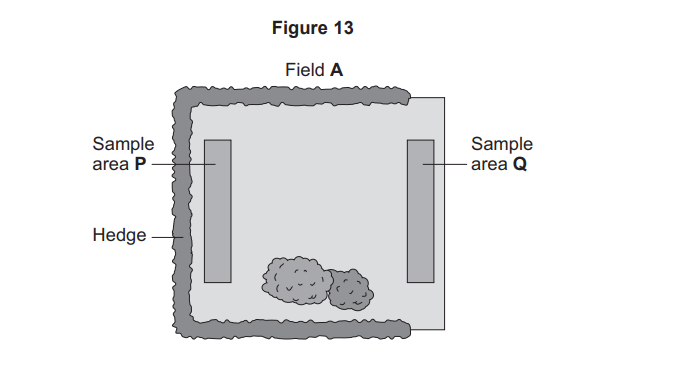
A student did a different investigation in field A.

Figure 13 shows the areas sampled.

Diagram of Field A showing a hedge along the left and bottom edges, two rectangular sample areas P and Q, and two bushes near the bottom centre.

The student sampled:

  • an area at the edge of the field next to the hedge, P

  • an area at the edge of the field with no hedge, Q.

Table 5 shows the results.

Table 5

Sample area

Number of plants

Number of species of plant

Number of species of insect

P

86

16

10

Q

102

3

4

Give three conclusions from the results in Table 5.

2f
1 mark

Suggest one way to increase biodiversity in field A.

3a
1 mark

A student investigated the number of plants in two different fields.

This is the method used.

  1. Place a quadrat randomly in field A.

  2. Count the number of plants of each species in the quadrat. Do not count grasses.

  3. Repeat steps 1 and 2 another 19 times.

  4. Repeat steps 1 to 3 for field B.

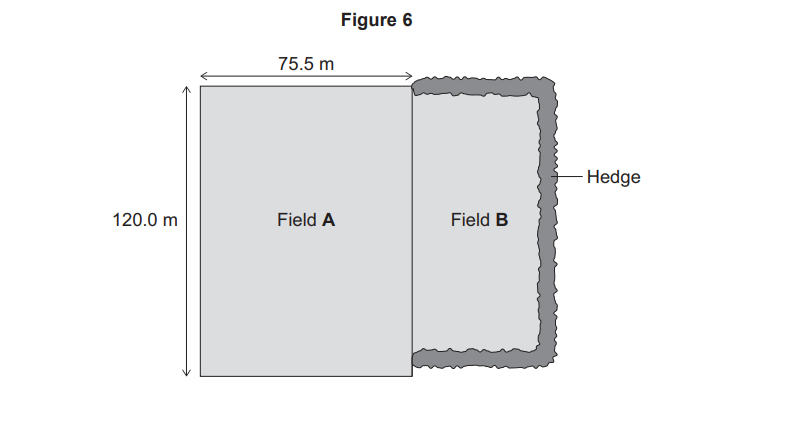
Figure 6 shows the two fields.

Diagram of two adjacent rectangular fields, A and B, 120 m long. Field A is 75.5 m wide; Field B is bordered on three outer sides by a hedge.

Why should a random sampling method be used to sample the plants?

3b
Sme Calculator
4 marks

The student counted dandelion plants.

The student used a 0.5 m × 0.5 m quadrat.

The mean number of dandelion plants in field A in Figure 6 was 2.8 per quadrat.

Determine the total number of dandelion plants in field A.

3c
2 marks

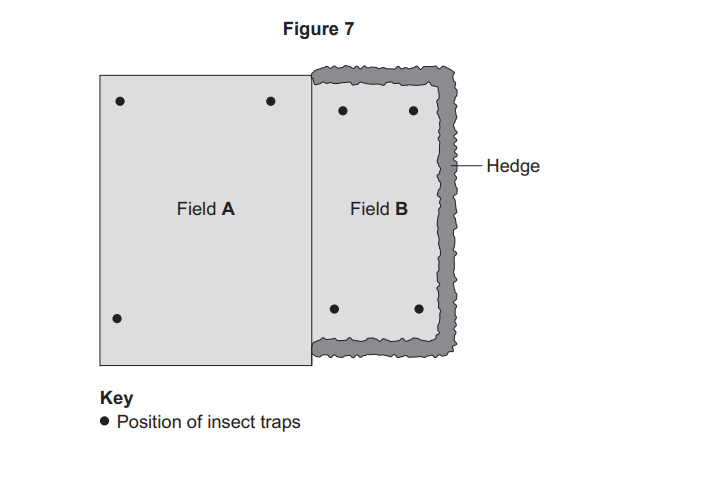
The student placed insect traps in the ground in field A and in field B.

The insect traps were used to estimate the total number of insects in each field.

Diagram of two adjacent fields, A and B, with insect traps marked as dots; field B is bordered on three sides by a hedge.

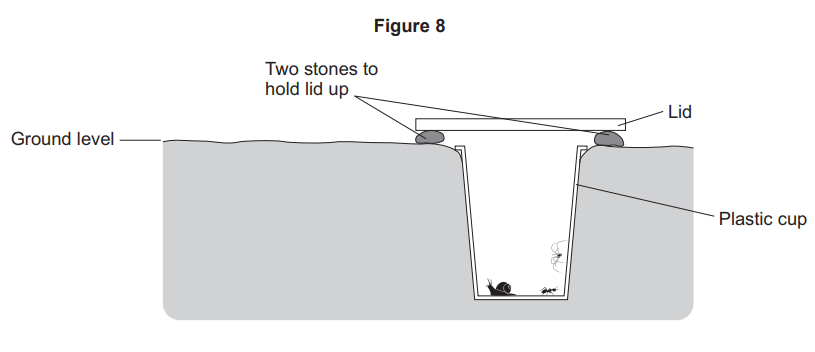
Figure 8 shows the insect trap the student used.

Diagram of a pitfall trap: a plastic cup buried to ground level containing small animals, covered by a raised lid supported on two stones

This is the method used.

  1. Place the insect traps in the fields as shown in Figure 7 and Figure 8.

  2. Leave for 12 hours.

  3. Count the number of insects of each species in each trap.

  4. Repeat every 2 days for 6 days.

The method for estimating the total number of insects in field A and field B may not give valid results.

Suggest two reasons why.

3d
1 mark

Table 5 shows the results for all the plants and insects sampled.

Table 5

Mean number of plants per quadrat

Number of different species of plant

Total number of insects

Number of different species of insect

Field A

10.7

3

75

3

Field B

10.6

16

130

2

A student concluded:

'There is greater biodiversity in field B than in field A.'

Give the reason why.

3e
2 marks

There has been a decrease in the total number of birds in the UK since 1970.

Explain how planting more hedges would affect the number of birds.

4a
1 mark

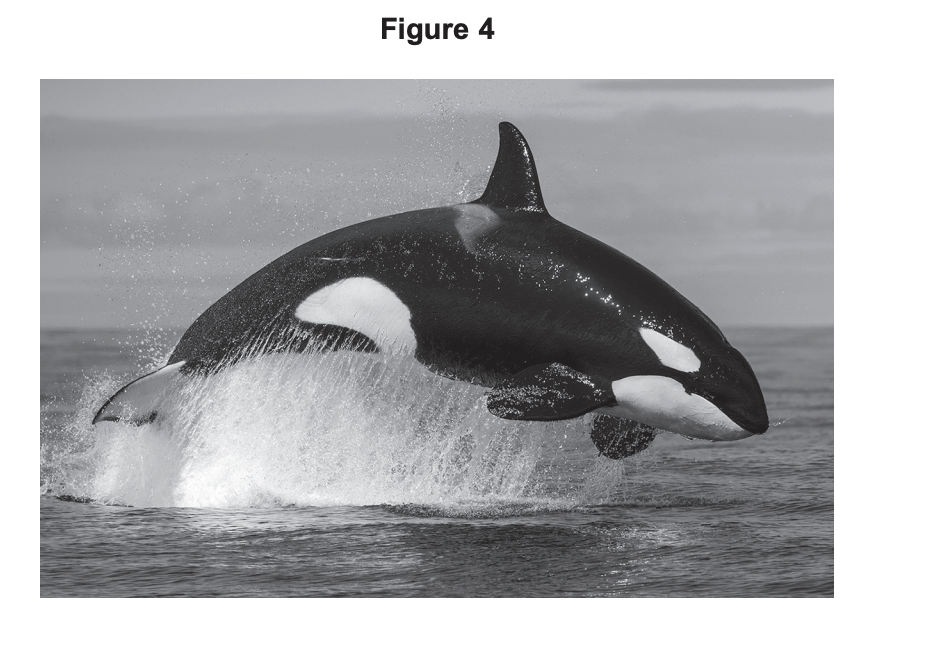
The orca is a large animal that lives in the ocean.

Figure 4 shows an orca.

Black-and-white photo of an orca leaping out of the sea, water spraying beneath its body against a calm horizon and cloudy sky.

Complete the sentence.

Choose the answer from the box.

Rectangular diagram with three bold ecology terms in a row: “community” on the left, “habitat” in the centre, and “population” on the right

The ocean is the orca’s ________________.

4b
3 marks

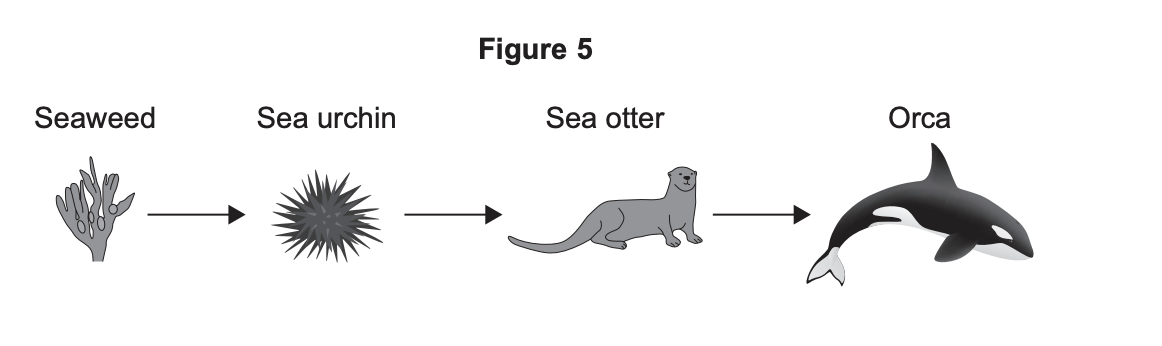
Figure 5 shows a food chain.

Diagram of a marine food chain: seaweed eaten by sea urchin, sea urchin eaten by sea otter, sea otter eaten by orca, with arrows showing energy flow.

Draw one line from each organism to the description of that organism in the food chain.

Use information from Figure 5.

Organism

Description

Orca

Primary consumer

Producer

Sea otter

Secondary consumer

Tertiary consumer

Seaweed

4c
2 marks

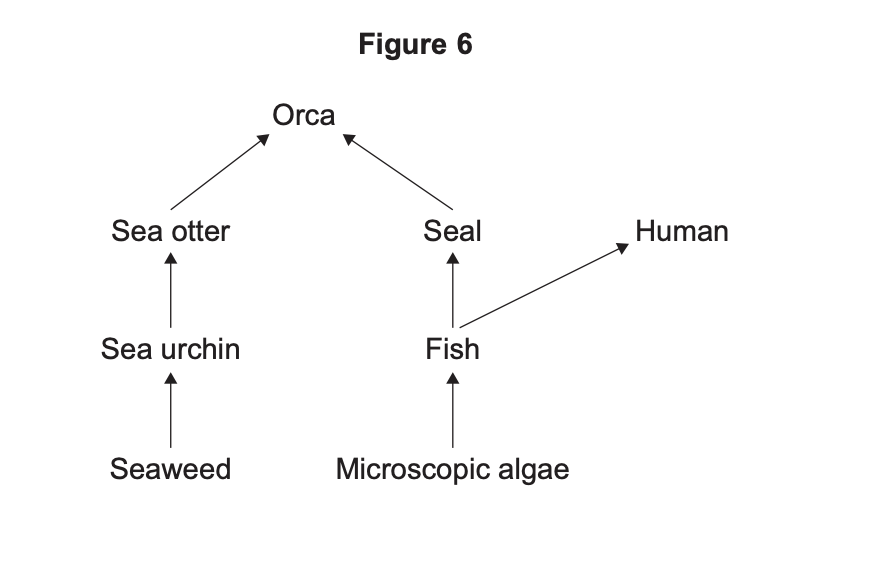
Figure 6 shows a food web.

Food web diagram: orca eats sea otter and seal; sea otter eats sea urchin, which eats seaweed; seal and humans eat fish, which eat microscopic algae.

Seaweed and microscopic algae photosynthesise.

Give two factors that affect the rate of photosynthesis.

1

2

4d
1 mark

The number of fish in the oceans has decreased since 1990.

Suggest one way that human activity has caused the decrease in the number of fish.

4e
6 marks

Explain how a decrease in the number of fish could affect the numbers of other organisms in the food web.

Use Figure 6.

5a
2 marks

A farmer removes some of the young trees from the managed forest every year.

Explain why removing some of the young trees allows the remaining trees to grow faster.

5b
1 mark

Suggest one advantage to the farmer if the remaining trees grow faster.

6a
2 marks

In managed forests:

  • tree seedlings are regularly planted

  • some trees are regularly removed

Some of the young trees in a managed forest are removed every year.

The biomass of wood produced by the remaining trees in the forest is increased by removing the young trees.

Explain why.

6b
6 marks

Planting trees to maintain forests is good for the environment.

Explain the environmental and biological benefits of maintaining forests.

7a
1 mark

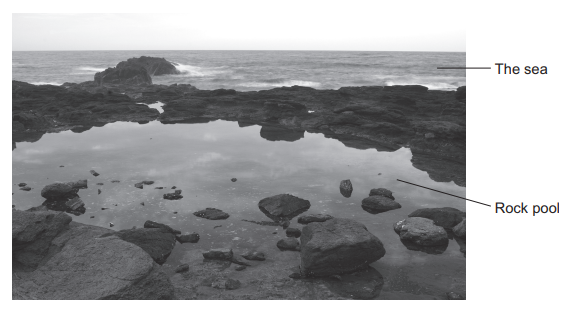
Figure 10 shows a rock pool on a sea shore.

Rock pools are flooded twice a day with fresh sea water.

Figure 10

Figure 10: a rocky sea shore with a calm rock pool in the foreground and the sea behind it. Labels point to the sea and to the rock pool.

What is the community of the rock pool?

Tick (✓) one box.

  • The living organisms and abiotic factors in the rock pool

  • The number of different species in the rock pool

  • The number of predators and prey in the rock pool

  • The populations of all the species that live in the rock pool

7b
6 marks

Starfish are animals that live in rock pools.

A scientist investigated the effect that starfish had on the number of species in rock pools.

This is the method used:

  1. Count the number of species in rock pool A and in rock pool B

  2. Regularly remove all the starfish from rock pool B

  3. Count the number of species in rock pool A and in rock pool B each year for 10 years

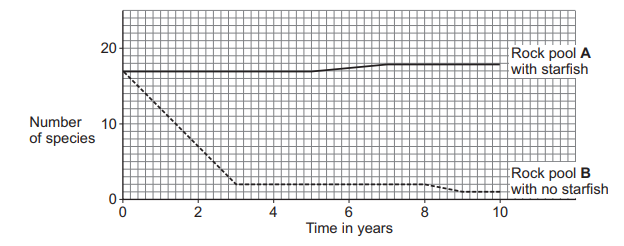
Figure 11 shows the results.

Figure 11

Figure 11: line graph of Number of species (y-axis 0–20) against Time in years (x-axis 0–10). Rock pool A (with starfish, solid line) stays roughly constant at about 17–18 species across all 10 years. Rock pool B (with no starfish, dashed line) starts at about 17 species, falls steeply to about 2 species by year 3 and then remains around 1–2 species to year 10.

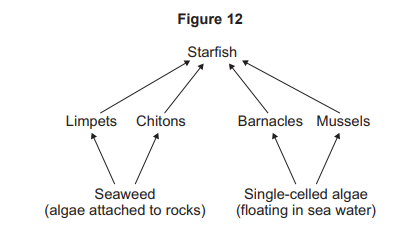
Figure 12 shows a food web in the rock pools.

Figure 12

Figure 12: rock pool food web. Seaweed (algae on rocks) is eaten by limpets and chitons. Single-celled algae (floating in sea water) are eaten by barnacles and mussels. Starfish eat limpets, chitons, barnacles and mussels.

Starfish usually prefer to feed on mussels.

Mussels reproduce and grow more quickly than limpets, chitons, and barnacles.

After 10 years the only species left in rock pool B was mussels.

Explain the results shown in Figure 11 for rock pool B.

Use Figure 11 and Figure 12.

7c
2 marks

Explain the results shown in Figure 11 for rock pool A.

7d
3 marks

Some species of starfish can reproduce by cloning (asexual reproduction) and also by sexual reproduction.

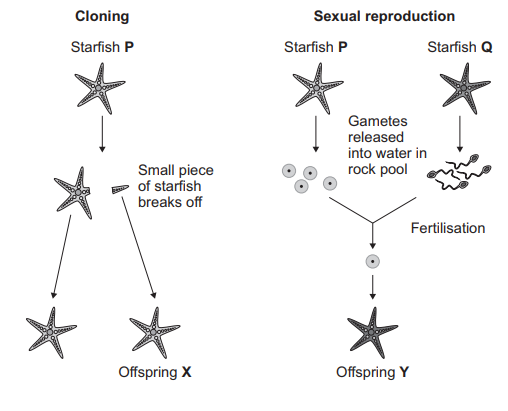
Figure 13 shows what happens when starfish P reproduces by each type of reproduction.

Figure 13

Figure 13: two reproductive pathways. Left (Cloning): a small piece of starfish P breaks off and develops into offspring X (an identical starfish). Right (Sexual reproduction): starfish P and starfish Q each release gametes into the water in the rock pool; fertilisation produces a zygote which develops into offspring Y.

During cloning a small piece of the starfish develops into a new starfish.

Before cell division, chromosomes replicate and the number of organelles increases.

Describe the stages in the process of cell division that produces offspring X.

8a
1 mark

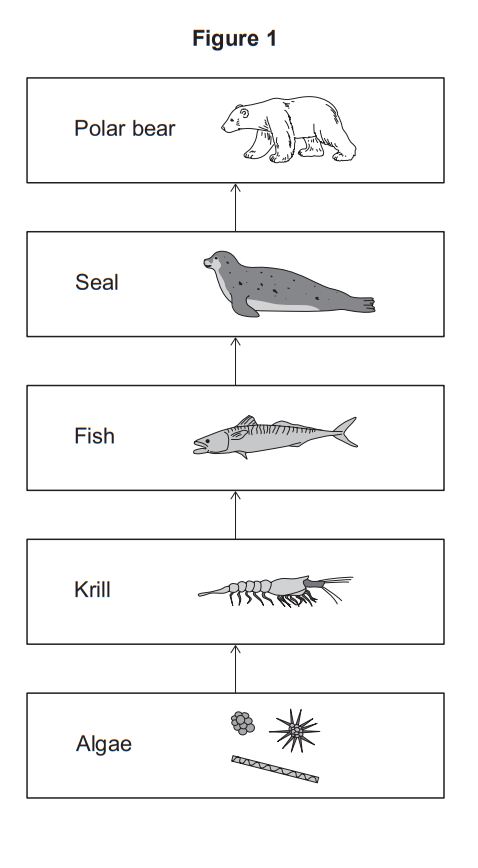
Figure 1 shows a food chain.

Diagram of an Arctic food chain: algae eaten by krill, krill eaten by fish, fish eaten by seals, seals eaten by a polar bear.

Which of the organisms in Figure 1 is the primary consumer?

8b
1 mark

Name the predator of the fish in Figure 1.

8c
3 marks

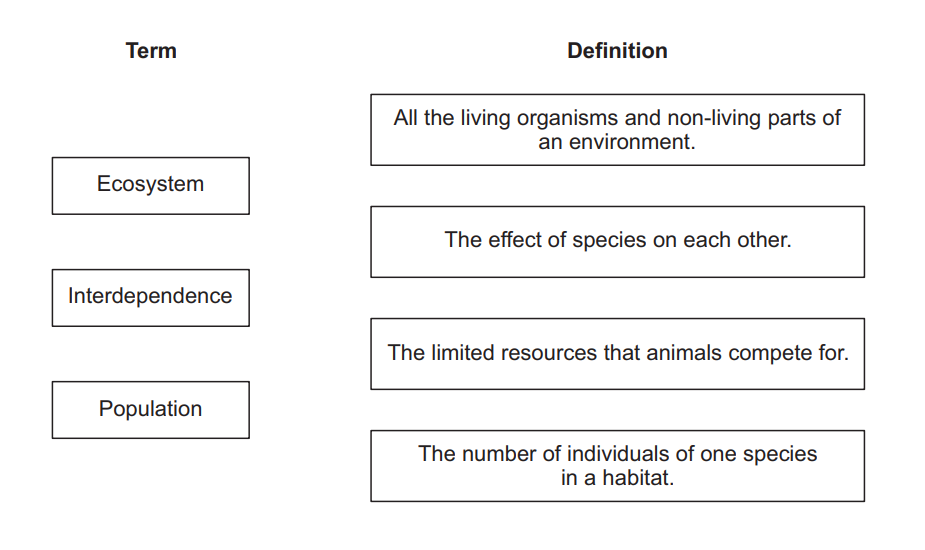
Draw one line from each term to the definition of the term.

Worksheet showing ecology terms (ecosystem, interdependence, population) on the left and four matching definitions about organisms, habitats and limited resources
8d
1 mark

Complete the sentence.

Choose the answer from the box.

decrease

stay the same

increase

A decrease in the number of polar bears would cause the number of seals to _________________________.

8e
1 mark

Food chains and food webs can be used to predict the effect of a decreasing number of polar bears.

Why is a food web more useful than a food chain?

  • Food webs show where energy is wasted.

  • Most animals eat more than one type of prey.

  • Producers are at the start of all food webs.

8f
Sme Calculator
2 marks

Krill eat algae.

Algae store a mass of 68 arbitrary units of carbon in 1 year.

8% of the carbon stored in algae becomes part of the carbon stored in krill.

Calculate the mass of carbon that becomes stored in krill.

Use the equation:

mass of carbon stored in krill=mass of carbon stored in algae×8100

Mass of carbon stored in krill = ______________ arbitrary units

8g
2 marks

The minerals in sea water are one abiotic factor that affects algae.

Which are two other abiotic factors that affect algae?

  • Food availability

  • Light intensity

  • Pathogens

  • Prey

  • Temperature

9a
2 marks

Biodiversity is the variety of species within an ecosystem.

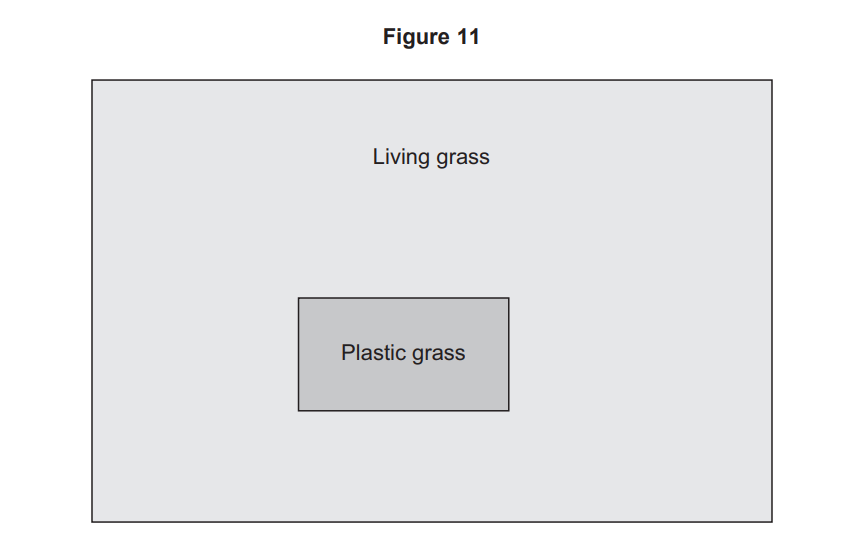
A student investigated the biodiversity in a field. In part of the field, the living grass had been replaced with plastic grass. Other plants grow between living grass plants and between pieces of plastic grass.

Figure 11 shows the field.

Diagram labelled Figure 11 showing a large rectangle of living grass containing a smaller central rectangle labelled plastic grass.

The student used quadrats to randomly sample the biodiversity of plants in:

  • the area with living grass

  • the area with plastic grass.

Describe how the student could decide where to randomly place the quadrats in the area with plastic grass.

9b
1 mark

How would a greater number of different plant species affect the biodiversity of animals in the area?

9c
1 mark

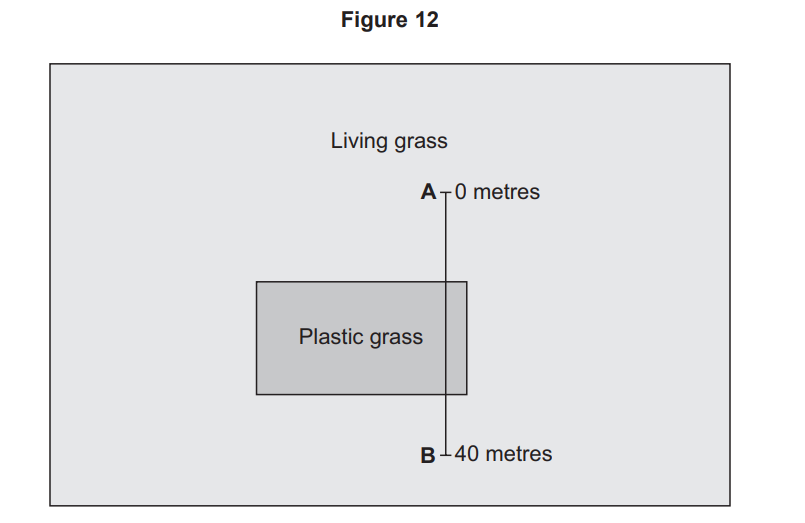
Another student used a transect to place quadrats in the field.

Figure 12 shows the position of the transect.

Diagram of a plastic grass rectangle within a larger living grass area, with a vertical line from point A at 0 metres to point B at 40 metres crossing both.

The student placed a quadrat every 5 metres from point A to point B.

Table 6 shows the results.

Table 6

Distance from point A (metres)

Type of grass

Number of plant species

0

Living

4

5

Living

6

10

Living

5

15

Plastic

1

20

Plastic

0

25

Plastic

2

30

Plastic

2

35

Living

4

40

Living

5

Complete the sentence.

The relationship between the distance from point A and the number of plant species cannot be represented by the equation:

y=mx+c

This is because the relationship is not_____________________ .

9d
1 mark

Describe the relationship between the type of grass and the number of plant species.

9e
2 marks

Which of the following are two improvements to the investigation that used a transect?

Tick (✓) two boxes.

  • Decrease the length of the transect to 20 metres.

  • Increase the distance between quadrats from 5 metres to 10 metres.

  • Record the number of plants of each species as well as the number of species.

  • Repeat three times at different times of the same day.

  • Repeat using three different transects that cross the two types of grass.

9f
6 marks

Small pieces of plastic break off plastic grass and enter rivers and oceans.

Leaves from trees take longer to decompose on plastic grass than on living grass.

Other plants can grow between pieces of plastic grass.

Plastic grass cannot be recycled.

Explain how plastic grass affects biodiversity of ecosystems.

9g
1 mark

Ecosystems with low biodiversity may have small populations of some species.

Why are small populations more likely to become extinct than large populations?

Tick (✓) one box.

  • A small population may be more varied genetically than a large population.

  • Large populations in the same habitat interact to form communities.

  • Less genetic variation is a greater risk if the ecosystem changes.

9h
2 marks

Suggest two ways biodiversity in and around fields can be increased.

Do not refer to plastic grass.

10a
1 mark

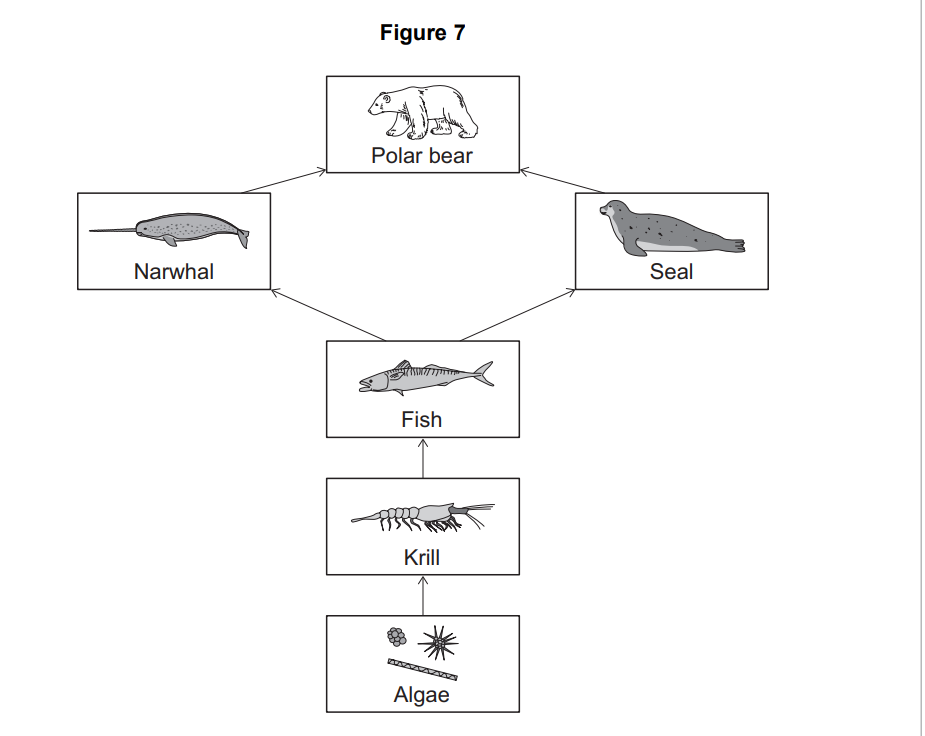
Figure 7 shows part of a food web from one ecosystem:

Food web diagram: algae eaten by krill, krill by fish, fish by narwhal and seal, both preyed on by a polar bear at the top of the chain.

Define the term 'ecosystem'.

10b
1 mark

Describe the difference between a population and a community in one habitat.

10c
2 marks

Humans kill narwhals for meat and skin.

Killing more narwhals can cause the number of seals to increase or decrease.

Explain why killing more narwhals can have two different effects on the number of seals.

10d
Sme Calculator
3 marks

The algae in Figure 7 store a mass of 68 arbitrary units of carbon in 1 year.

8.4% of the carbon in each stage of the food web is passed to the next stage.

Calculate the mass of carbon stored in tertiary consumers in 1 year.

Mass of carbon = _________________ arbitrary units

11
6 marks

In the last 200 years the concentration of carbon dioxide in the Earth's atmosphere has risen.

Explain how a rise in carbon dioxide concentration in the atmosphere can decrease biodiversity.

12a
2 marks

A student investigated the number of ribwort plants in a field using a quadrat and a tape measure.

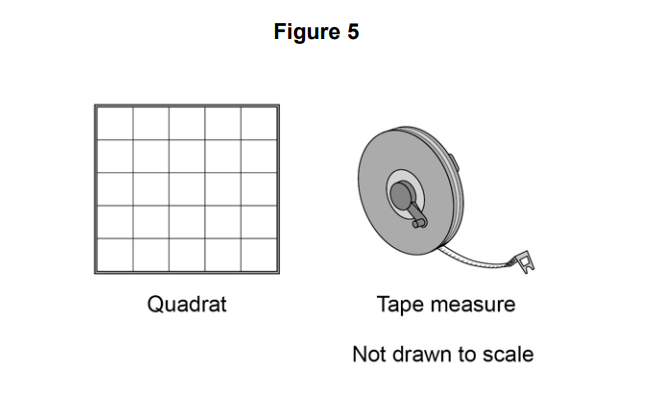
The student used the apparatus shown in Figure 5.

Diagram labelled Figure 5 showing a square grid quadrat and a circular reel tape measure with extended tape, with note ‘Not drawn to scale’.

This is the method used.

  1. Place the quadrat in an area where there are lots of ribwort plants in the field.

  2. Count the number of ribwort plants inside a quadrat.

  3. Repeat steps 1 and 2 four more times.

How could the student improve his method so that he can collect valid results?

Tick two boxes.

  • Count the leaves of each ribwort plant

  • Place more quadrats in the field

  • Place the quadrats randomly

  • Use a smaller quadrat

  • Weigh the ribwort plants

12b
Sme Calculator
1 mark

The student calculated that the mean number of ribwort plants per m² was 3.2.

The area of the field was 8250 m².

Calculate the total number of ribwort plants in the field.

Total number of ribwort plants = __________________

12c
1 mark

Another group of students did an investigation in the field.

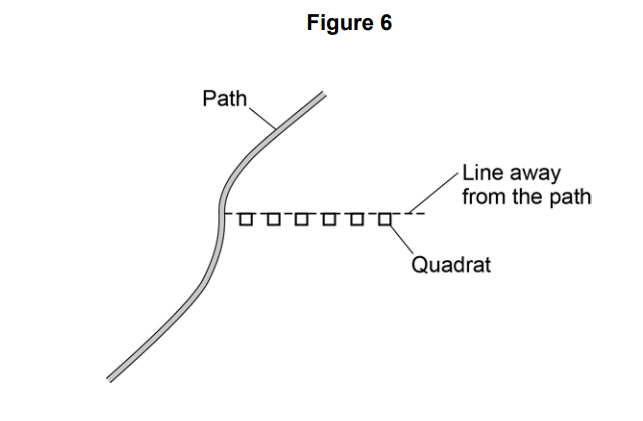
Figure 6 shows how the students placed their quadrats in this investigation.

Diagram showing a curved path with a straight transect line leading away from it, along which several quadrats are placed at regular intervals.

What is the name given to the line in Figure 6?

12d
2 marks

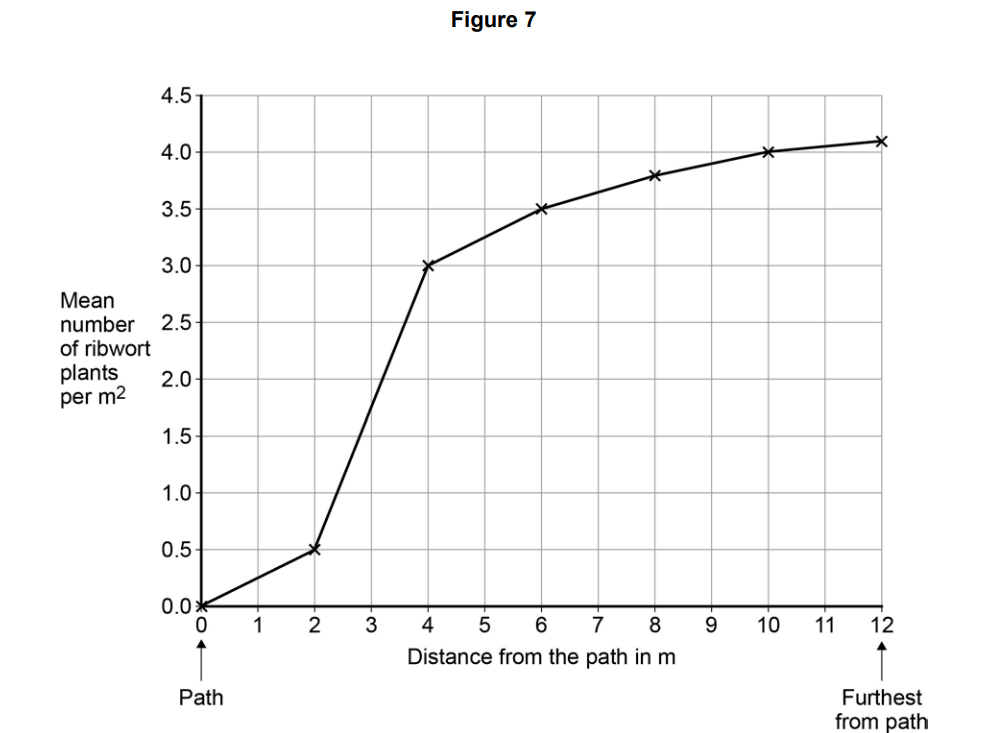
Figure 7 shows the students' results.

Line graph showing mean ribwort plants per m² rising from 0 at 0 m to about 4.1 at 12 m distance from a path, with the steepest increase near 2–4 m.

Describe the relationship shown in Figure 7.

12e
1 mark

What is one reason why there are no ribwort plants next to the path?

Tick one box.

  • There is less light near the path

  • The ribwort plants get walked on

  • There are more nutrients in the soil near the path

  • There are fewer animals near the path

13a
1 mark

Feeding relationships can be shown using food chains.

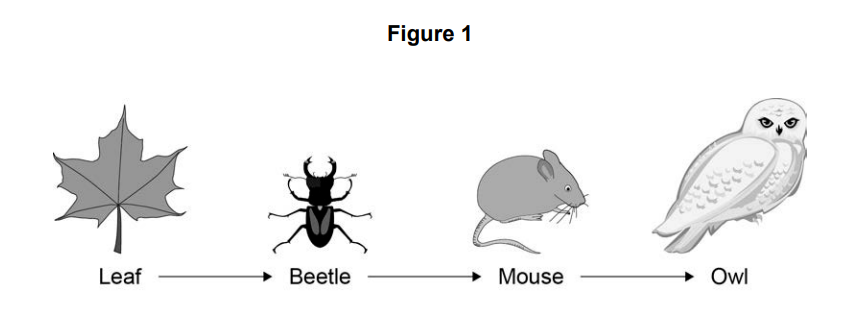
Figure 1 shows a food chain for organisms in a habitat.

Diagram of a simple food chain: leaf eaten by beetle, beetle eaten by mouse, mouse eaten by owl, shown left to right with arrows.

What is the producer in the food chain?

Tick one box.

  • Beetle

  • Leaf

  • Mouse

  • Owl

13b
1 mark

Name the primary consumer in the food chain.

13c
1 mark

What is the group of leaves, beetles, mice and owls in a habitat called?

Tick one box.

  • Community

  • Ecosystem

  • Population

  • Species

13d
2 marks

What are two abiotic factors that can affect the food chain?

Tick two boxes.

  • Availability of food

  • Light intensity

  • New diseases

  • New predators

  • Wind direction