Rate Of Chemical Change (WJEC GCSE Science (Double Award): Chemistry): Exam Questions

Exam code: 3430

2 hours12 questions
1a
1 mark

A class investigated the rate of the reaction between magnesium and hydrochloric acid by measuring the volume of gas produced in 10 seconds using different concentrations of acid.

Tick (✓) the name of the piece of apparatus they used to measure the volume of gas produced.

beaker

□

thermometer

□

gas syringe

□

conical flask

□

1b
6 marks

The table shows the results of their experiment.

Concentration of acid (M)

Volume of gas produced (cm3)

Test 1

Test 2

Test 3

Mean

0.2

16

14

15

15

0.4

31

33

30

32

0.6

47

49

29

48

0.8

63

64

65

64

1.0

82

83

79

81

(i) Circle the result in the table which was not used to calculate a mean.

Give the reason why this result was not used.

Reason ..................................................................................

[2]

(ii) Plot the mean volume of gas produced against the concentration of acid. Draw a suitable line.
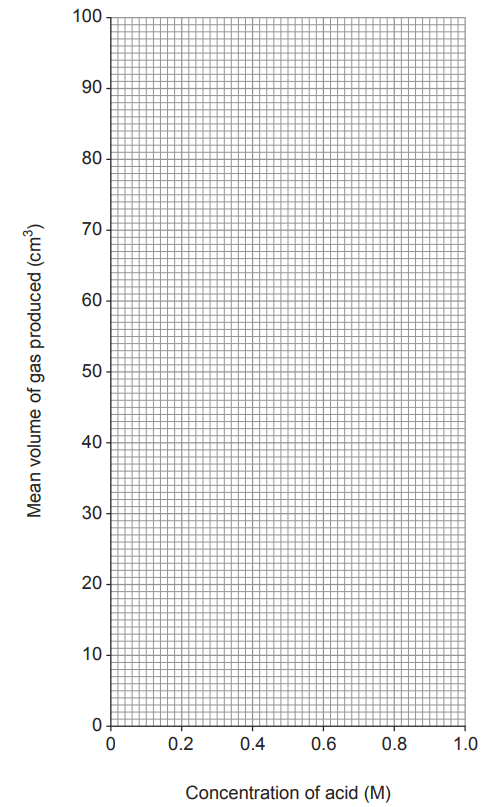
Figure: Blank grid for a graph with x-axis "Concentration of acid (M)" ranging from 0 to 1.0 in steps of 0.2, and y-axis "Mean volume of gas produced (cm3)" ranging from 0 to 100 in steps of 10

[3]

(iii) Use the information to find the volume of gas produced in 10 seconds using acid of concentration 0.5 M.

........................................................................ cm3

[1]

1c
2 marks

In another investigation the class found that as the temperature of the acid increases the reaction is faster.

Tick (✓) the two statements which explain why the reaction is faster at a higher temperature.

there are more particles of acid

□

the acid particles are moving faster

□

there is a higher surface area

□

there are more collisions per second

□

the acid particles have less energy

□

[2]

2a
8 marks

A class investigated the reaction between magnesium and nitric acid by measuring the volume of hydrogen gas produced over time.

The table shows their results.

Time (s)

Volume of gas produced (cm3)

0

0

5

12.0

10

20.5

15

29.0

20

33.5

25

35.0

30

35.0

(i) The reaction between magnesium and nitric acid produces magnesium nitrate and hydrogen gas.

Complete and balance the symbol equation for this reaction.

Mg + [ ] HNO3 → ...................................... + ......................................

[2]

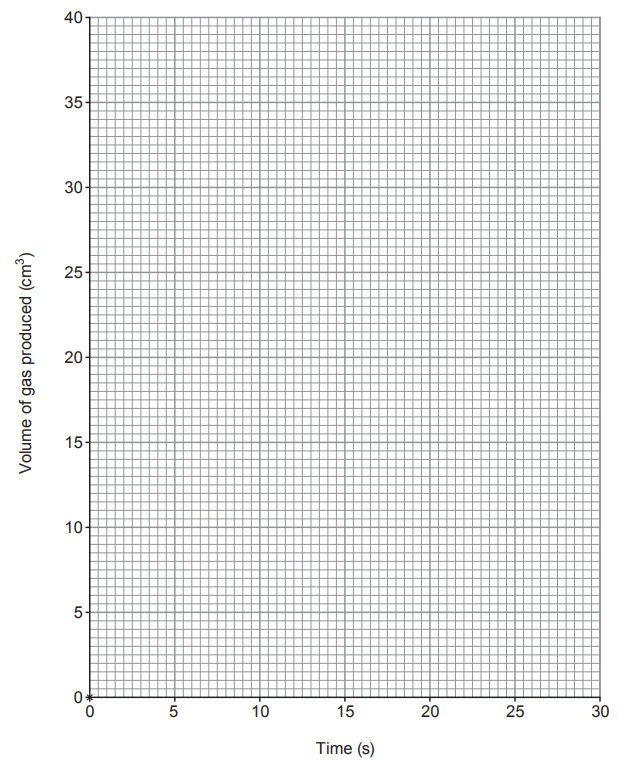
(ii) Plot the results on the grid and draw a suitable line.

The first point has been plotted for you.

Figure: Blank grid for a graph with x-axis "Time (s)" ranging from 0 to 30 in steps of 5, and y-axis "Volume of gas produced (cm3)" ranging from 0 to 40 in steps of 5; the first point (0, 0) is already plotted

[3]

(iii) Use particle theory to explain why the graph becomes less steep over time.

[3]

2b
2 marks

State why a catalyst is added to a reaction mixture and explain how a catalyst works.

3a
1 mark

Marble chips (calcium carbonate) react with dilute hydrochloric acid to produce carbon dioxide gas.

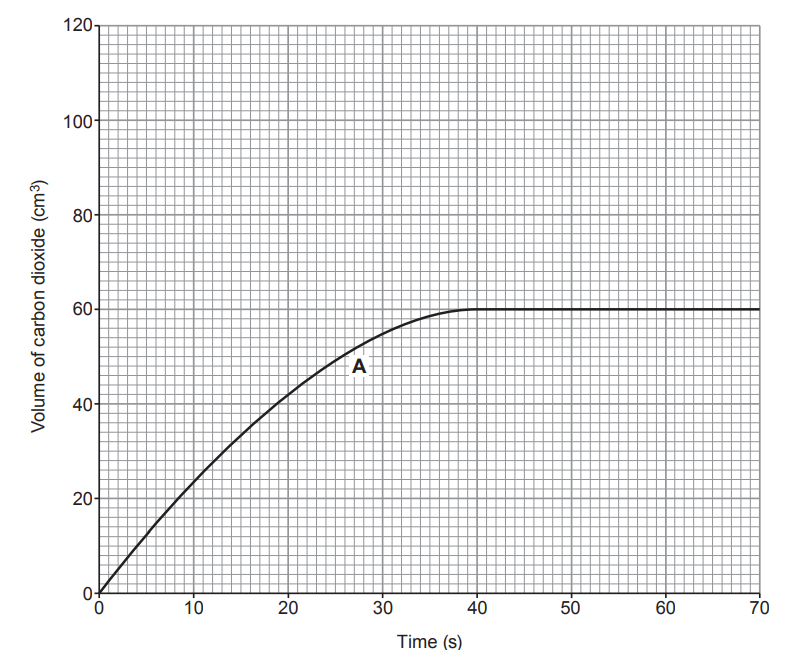
Graph A shows the volume of carbon dioxide produced during the reaction between 0.25 g of marble chips and excess dilute hydrochloric acid at 30 °C.

Figure: Graph with x-axis "Time (s)" from 0 to 70 in steps of 10, and y-axis "Volume of carbon dioxide (cm3)" from 0 to 120 in steps of 20. Curve A rises steeply from the origin, curving over and levelling off at a maximum volume of 60 cm3 at around 38–40 s

State why no more marble chips remain when the reaction stops.

3b
1 mark

The original experiment was repeated at 60 °C.

On the grid draw the curve you would expect to see for the production of carbon dioxide at this temperature.

3c
2 marks

Catalysts can be added to some chemical reactions in order to increase their rate.

Explain how a catalyst increases the rate of a chemical reaction.

4a
1 mark

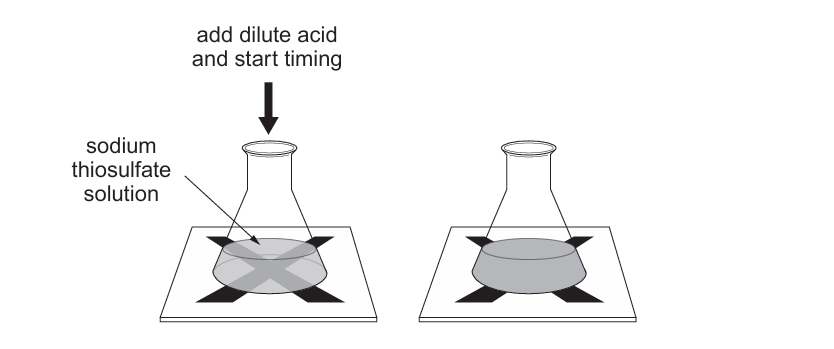
Sodium thiosulfate solution reacts with dilute hydrochloric acid to form a precipitate. The precipitate causes the solution to go cloudy.

The rate of the reaction can be measured by placing a cross beneath the flask and measuring the time taken for the cross to disappear.

Diagram of a conical flask containing sodium thiosulfate solution placed over a cross marked on paper beneath it, with an arrow showing dilute acid being added and timing started

Gareth and Sion studied the effect of sodium thiosulfate concentration by carrying out the reaction with thiosulfate of five different concentrations. They tested each concentration three times.

Their results are shown in the table below.

Concentration of sodium thiosulfate (g / dm3)

Time 1 (s)

Time 2 (s)

Time 3 (s)

Mean time (s)

0.2

114

113

112

113

0.4

74

70

72

72

0.6

40

38

57

39

0.8

21

23

22

22

1.0

14

16

15

15

When calculating the mean times, they ignored one of the values recorded.

Circle this value in the table.

4b
3 marks

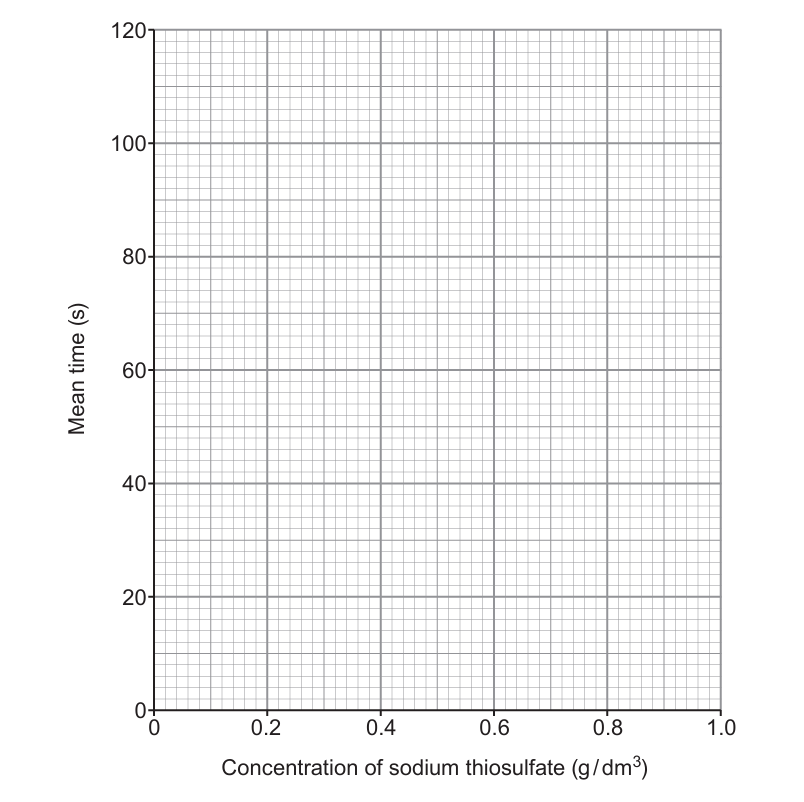
Plot the mean time against sodium thiosulfate concentration on the grid below. Draw a suitable line.

Blank grid with x-axis "Concentration of sodium thiosulfate (g / dm3)" from 0 to 1.0 in steps of 0.2, and y-axis "Mean time (s)" from 0 to 120 in steps of 20, for the candidate to plot the five mean time values and draw a smooth curve
4c
3 marks

Explain the results in terms of particle theory.

4d
1 mark

A second group of students carried out the same experiment with sodium thiosulfate solution at a higher temperature.

On the grid above, sketch a line to show the results you would expect them to record.

5a
1 mark

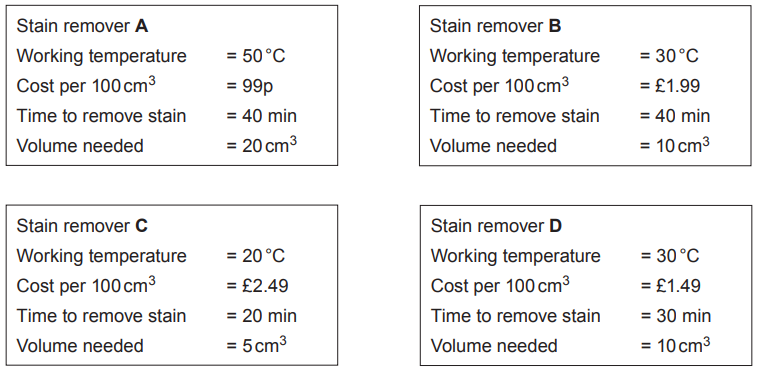
Hydrogen peroxide solution, H2O2, is used in commercial stain removers.

A GCSE class investigated how effective four stain removers are at removing stains. Stain removers A, B, C and D contain different concentrations of hydrogen peroxide.

The students tested how effective each one is at removing an identical oil stain from four towels.

Their findings are outlined below.

Figure: Four information cards, one per stain remover. Stain remover A: working temperature 50°C, cost per 100 cm³ = 99p, time to remove stain = 40 min, volume needed = 20 cm³. Stain remover B: working temperature 30°C, cost per 100 cm³ = £1.99, time to remove stain = 40 min, volume needed = 10 cm³. Stain remover C: working temperature 20°C, cost per 100 cm³ = £2.49, time to remove stain = 20 min, volume needed = 5 cm³. Stain remover D: working temperature 30°C, cost per 100 cm³ = £1.49, time to remove stain = 30 min, volume needed = 10 cm³.

In carrying out this investigation, which variables were kept the same in order to get valid results? Tick (✓) the correct answer.

type of oil used, towel material and volume of hydrogen peroxide

□

type of oil used, towel material and temperature of stain remover

□

type of oil used and towel material

□

type of oil used, towel material and cost of stain remover

□

5b
1 mark

Tick (✓) all of the statements which could explain why stain remover A has to be heated to 50°C before it removes the stain.

it is the cheapest stain remover

□

it is heat resistant

□

it has a low concentration of hydrogen peroxide

□

it takes a long time to work

□

5c
1 mark

The students found that stain removers B and D used the same volume and worked best at the same temperature.

Assuming that they have the same hydrogen peroxide concentration, suggest a possible reason why D removes the stain more quickly than B.

...................................................................................................................................................................

5d
5 marks

One student went on to investigate the decomposition of hydrogen peroxide.

The equation for the reaction is as follows.

2H2O2 → 2H2O + O2

The student investigated the effect of changing the concentration of the hydrogen peroxide solution on the rate of the reaction. She used manganese dioxide as a catalyst in each experiment.

This is the method she used.

  • Pour 50 cm³ of hydrogen peroxide solution of concentration R into a conical flask on a digital balance.

  • Add 1 g of catalyst and place some cotton wool loosely in the neck of the flask. Record the balance reading and immediately start a stopwatch.

  • Record the balance reading every minute until the mass no longer changes.

  • Carry out the experiment twice more using hydrogen peroxide of different concentrations, S and T.

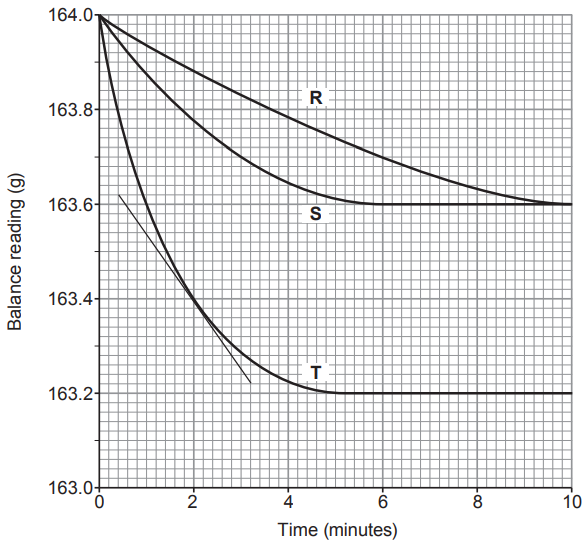
Her results are plotted on the grid below.

Figure: Line graph. X-axis "Time (minutes)" from 0 to 10. Y-axis "Balance reading (g)" from 163.0 to 164.0 (decreasing mass as oxygen gas escapes). Three curves are plotted, labelled R, T and S, each starting near 164.0 g at t=0 and decreasing at different rates before levelling off — R falls fastest and levels off soonest, T falls at an intermediate rate, and S falls most slowly. A tangent line is drawn touching curve T at t=2 minutes, with a right-angled triangle construction beside it showing a rise of 0.4 g over a run of 2.8 minutes.

(i) Using the tangent shown on the graph, calculate the rate of reaction for concentration T at 2 minutes. Show your working.

Rate at 2 minutes = ....................................................... g / minute

[2]

(ii) The initial rate for concentration S is half the initial rate for concentration T.

Explain this difference in rate in terms of the particle theory.

...................................................................................................................................................................

...................................................................................................................................................................

[3]

6a
4 marks

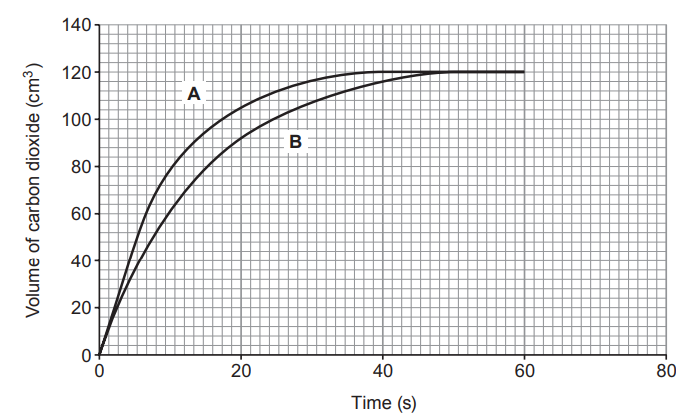
The rate of reaction between hydrochloric acid and calcium carbonate was studied. Two experiments, A and B, were carried out. The same concentration of acid and the same mass of calcium carbonate were used, with the acid in excess each time. The volume of gas produced was measured for 60 seconds. The results of these experiments are shown in the graphs.

Figure: Graph showing volume of carbon dioxide (cm3, y-axis 0 to 140) against time (s, x-axis 0 to 60), with two curves labelled A and B. Curve A rises more steeply and reaches its final (levelling-off) volume sooner than curve B, but both curves level off at the same final volume.

Using the particle theory, state and explain two factors that may be responsible for the higher rate seen in experiment A.

6b
1 mark

State how the graphs show that the same mass of calcium carbonate was used in both experiments.

7a
5 marks

Marble chips (calcium carbonate) react with hydrochloric acid to produce carbon dioxide gas as shown in the equation.

CaCO3 + 2HCl → CaCl2 + H2O + CO2

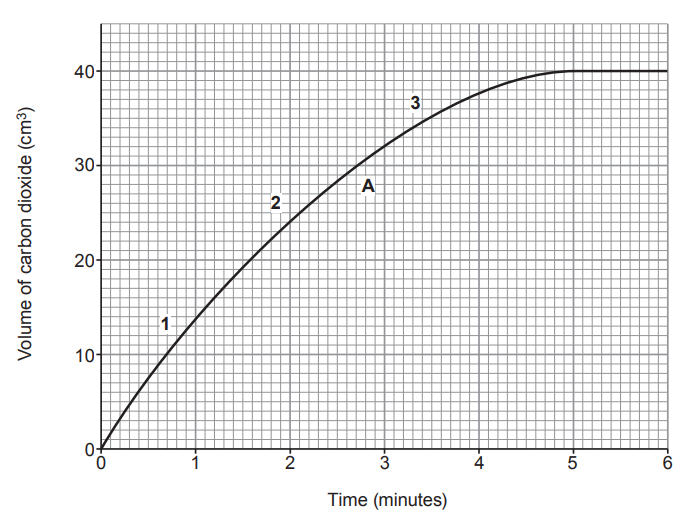
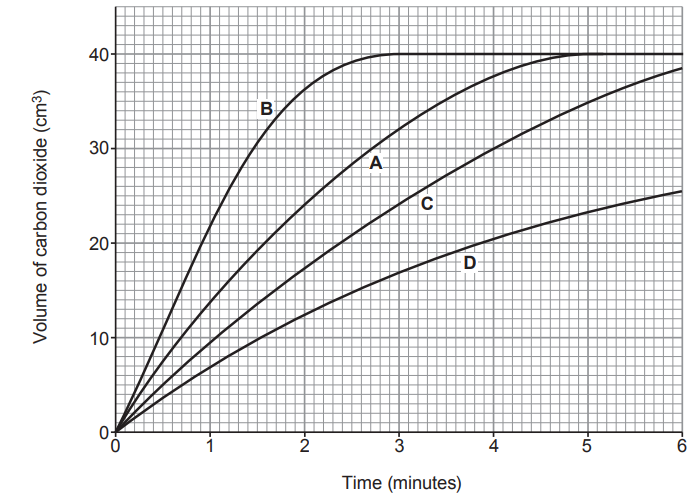
Graph A shows the volume of carbon dioxide produced over 6 minutes when the reaction was carried out at 30 °C.

Figure: Graph with x-axis "Time (minutes)" from 0 to 6, and y-axis "Volume of carbon dioxide (cm3)" from 0 to 40 in steps of 10. Curve A rises steeply from the origin, levels off and becomes flat (reaction complete) at around 4.5–5 minutes, reaching a maximum volume of about 30 cm3

(i) Find the volume of carbon dioxide given off after 2 minutes.

............................................................. cm3

[1]

(ii) Find the time taken for the reaction to finish.

............................................................. minutes

[1]

(iii) At which of the following points on graph A is the reaction at its fastest?

Tick (✓) the correct box.

1

□

2

□

3

□

[1]

(iv) After ½ minute, 7.5 cm3 of carbon dioxide has been produced.

Use the equation to calculate the mean rate of reaction over this time in cm3 / s.

mean rate=volume of carbon dioxide producedtime (in seconds)

Mean rate = ....................................................... cm3 / s

[2]

7b
3 marks

Graphs B, C and D on the grid below show the results for the experiment carried out at different temperatures. Graph A for the reaction carried out at 30 °C is also shown.

Figure: Graph with x-axis "Time (minutes)" from 0 to 6, and y-axis "Volume of carbon dioxide (cm3)" from 0 to 40 in steps of 10. Four curves are shown: A (as before, levelling off around 30 cm3 at ~5 minutes), and three further curves labelled B, C and D, each rising and levelling off at different rates and to different final volumes, illustrating the effect of different reaction temperatures

(i) State which of graphs B, C and D shows the results for the experiment carried out at a temperature of 40 °C.

Graph .......................................................

[1]

(ii) Using your knowledge of particle theory, underline the correct words in the brackets to complete the following sentence.

At a higher temperature, the particles will have ( more / less / the same amount of ) energy, so they will move faster and there will be ( an equal / a smaller / a greater ) number of successful collisions per second.

[2]

8a
3 marks

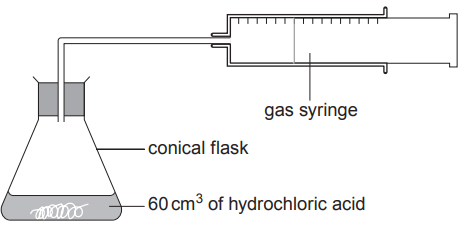
Magnesium ribbon was reacted with excess dilute hydrochloric acid. The volume of hydrogen produced during the reaction was measured over time using a gas syringe. The experiment was carried out at a temperature of 20°C.

Figure: Diagram of the apparatus — a conical flask containing 60 cm3 of hydrochloric acid with magnesium ribbon, connected via a delivery tube to a gas syringe that collects the hydrogen gas produced.

The table shows the results obtained in the experiment.

Time (s)

Volume of gas (cm3)

0

0

10

34

20

64

30

78

40

94

50

98

60

100

70

100

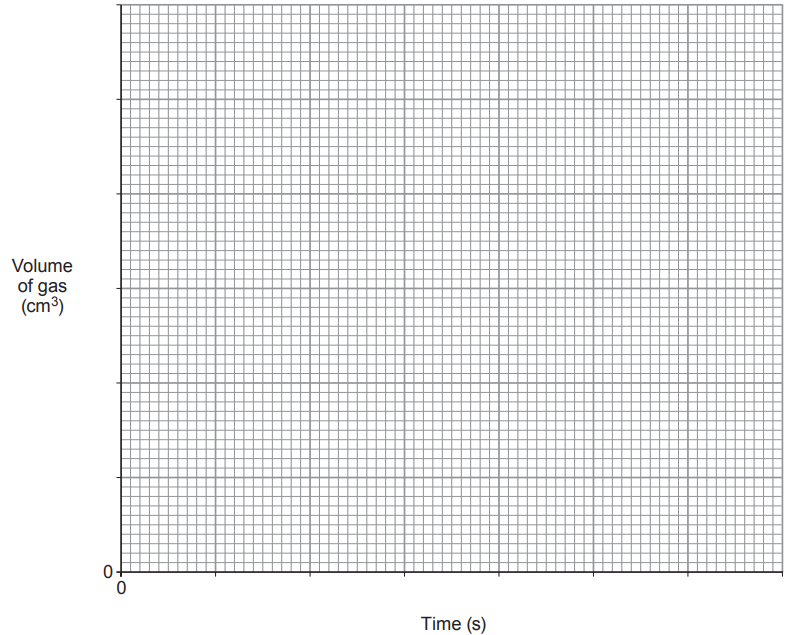
Plot the data on the grid and draw a suitable line. Label the graph A.

Blank plotting grid for graph A, with time in seconds on the horizontal axis and volume of gas in cubic centimetres on the vertical axis; the origin is marked zero and no data points or line are shown.
8b
2 marks

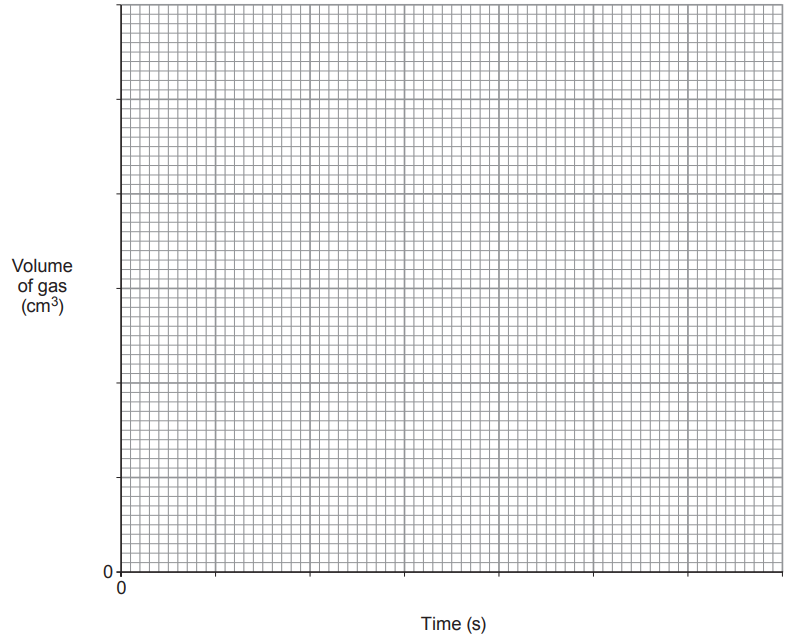
On the same grid, sketch the graph that would be obtained if a piece of magnesium ribbon of half the length were reacted with another 60 cm3 of the same hydrochloric acid. Label this graph B.

Blank graph template with a gridded plotting area, horizontal axis labelled “Time (s)” and vertical axis labelled “Volume of gas (cm³)”; both axes start at zero and have no plotted line.
8c
2 marks

If the original experiment were repeated at a higher temperature, the reaction would occur at a higher rate. Explain this using particle theory.

8d
2 marks

This method can be used to investigate the rate of this reaction. Without changing the method or apparatus used, state what should be done to improve the overall strength of the evidence collected.

8e
2 marks

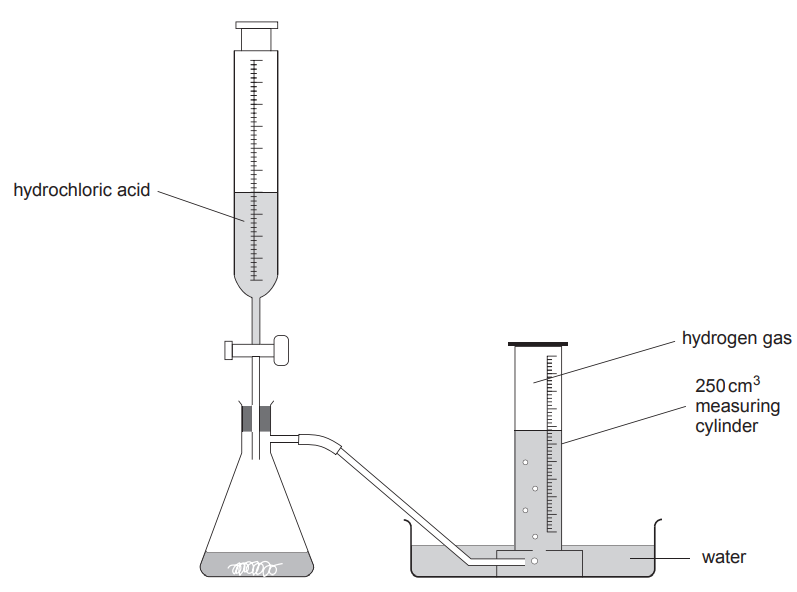
Give an advantage and a disadvantage of using the following alternative apparatus to collect the hydrogen gas.

Figure: Diagram of alternative apparatus — hydrochloric acid in a flask connected by a delivery tube to an inverted 250 cm3 measuring cylinder filled with water and standing in a water trough, collecting hydrogen gas by downward displacement of water.

Advantage ........................................................................................................

Disadvantage ..................................................................................................

9
8 marks

The year 10 class then decided to investigate the rate of the reaction between magnesium and hydrochloric acid.

A piece of magnesium was placed in excess hydrochloric acid at 20 °C. The volume of hydrogen produced was recorded every 10 s.

The results obtained are shown in the table.

Time (s)

0

10

20

30

40

50

60

Volume of hydrogen (cm3)

0

19

31

40

47

53

56

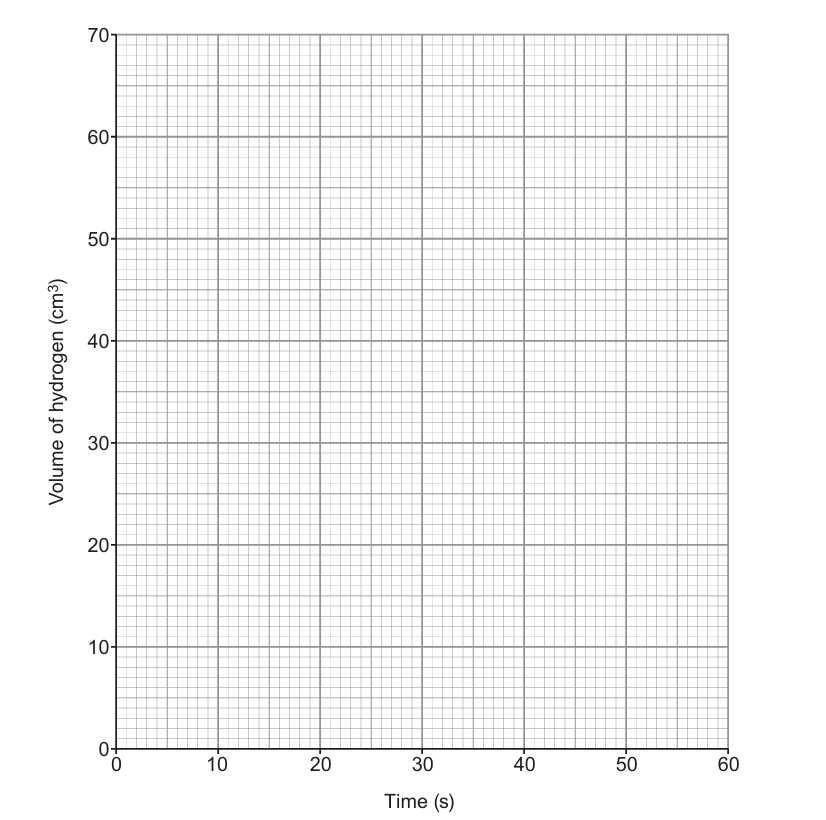
(i) Plot the volume of hydrogen against time on the grid. Draw a suitable line.

Blank grid with x-axis "Time (s)" from 0 to 60 in steps of 10, and y-axis "Volume of hydrogen (cm3)" from 0 to 70 in steps of 10, for the candidate to plot the seven data points and draw a smooth curve from the origin

[3]

(ii) The reaction had not finished after 60 s. How does the graph show this?

Put a tick (✓) in the correct box.

Graph stops at 60 s

□

Graph is still rising at 60 s

□

Graph reaches a maximum temperature of 56 °C

□

[1]

(iii) Why does the reaction slow down over time?

Put a tick (✓) in the correct box.

The particles collide with less energy so less chance of successful collisions

□

The particles move slower so less chance of successful collisions

□

The particles have less surface area so less chance of successful collisions

□

The particles get used up so less chance of successful collisions

□

[1]

(iv) Suggest two changes you could make to the hydrochloric acid to make the reaction faster.

[2]

(v) In the reaction between magnesium and hydrochloric acid, magnesium chloride is formed. Magnesium chloride contains Mg2+ ions and Cl- ions.

Give the formula of magnesium chloride.

........................................................

[1]

10a
2 marks

Powdered calcium carbonate was added to an excess of dilute hydrochloric acid in a beaker.

The mass of the beaker and its contents was recorded every minute for 6 minutes.

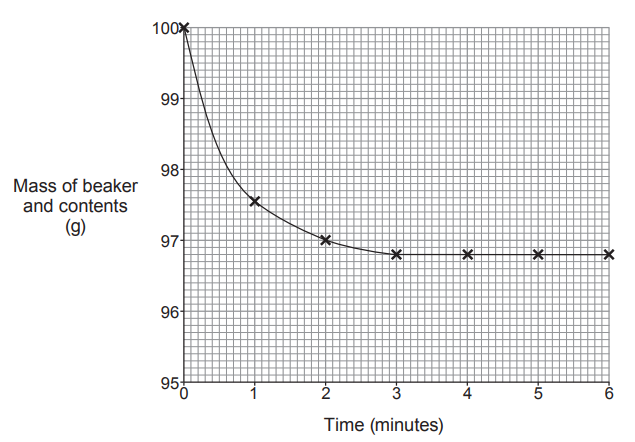
The graph shows the results.

Figure: Line graph. X-axis "Time (minutes)" from 0 to 6. Y-axis "Mass of beaker and contents (g)" from 95 to 100. The curve starts at 100 g at t=0, falls steeply at first, then levels off, reaching approximately 96.8 g by around t=3 minutes and staying constant (flat) from there to t=6 minutes.

The equation for the reaction is

CaCO3 + 2HCl → CaCl2 + H2O + CO2

Describe how the mass of the beaker and its contents changes over the first minute. Give the reason for this change.

...................................................................................................................................................................

...................................................................................................................................................................

10b
2 marks

(i) Use the graph to determine the time taken for the reaction to finish.

...................................................................................................................................................................

[1]

(ii) When is the reaction at its fastest? Tick (✓) the correct box.

[1]

from 0 – 0.5 minutes

□

from 1 – 1.5 minutes

□

from 2 – 2.5 minutes

□

from 3 – 3.5 minutes

□

10c
2 marks

Use your graph to calculate the mean rate of the reaction during the first two minutes.

Use the following equation.

rate=decrease in mass of beaker and contents (g)time (minutes)

Rate = ....................................................... g / minute

10d
1 mark

The experiment was repeated using the same mass of calcium carbonate but as a lump instead of a powder.

On the grid, sketch the graph you would expect to obtain from this second experiment.

11a
3 marks

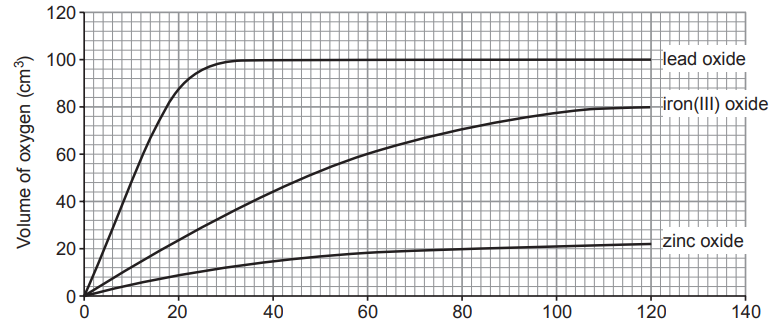
Catalysts are used to speed up the reaction. The graphs show the volume of oxygen formed over 120 seconds when 1.0 g of different metal oxides were added to 50 cm3 of hydrogen peroxide solution.

Figure: Graph showing volume of oxygen (cm³, y-axis 0 to 140) against time (s, x-axis 0 to 120), with three curves labelled lead oxide, iron(III) oxide and zinc oxide. Lead oxide rises fastest and reaches the highest volume; iron(III) oxide rises at a moderate rate; zinc oxide rises slowest and reaches the lowest volume, all levelling off before 120 s.

(i) Use the graph to find the time taken to form 44 cm3 of oxygen using iron(III) oxide as the catalyst.

..................................................... s

[1]

(ii) State which metal oxide is the best catalyst. Give a reason for your answer.

[1]

(iii) After 120 seconds, the contents of each beaker were washed into a filter paper and funnel. The catalyst left over on each filter paper was dried and weighed.

Tick (✓) the box next to the statement which is correct.

the same mass of all catalysts is left over

□

more zinc oxide is left over than lead oxide

□

about 80 % of the iron(III) oxide is left over

□

no lead oxide is left over

□

[1]

11b
6 marks

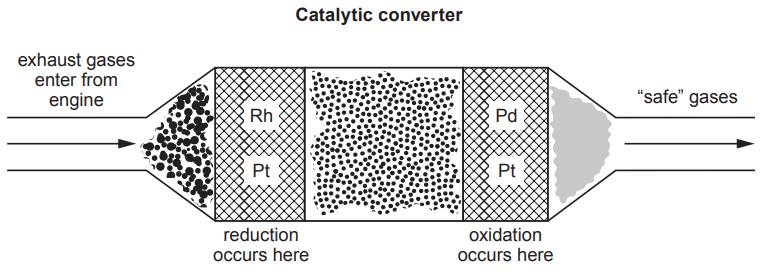
Exhaust gases from car engines contain harmful molecules, for example, carbon monoxide and nitrogen oxides. All cars are fitted with catalytic converters that split up these harmful molecules.

The catalysts are made from platinum (Pt) and palladium (Pd) or rhodium (Rh). A mesh structure is used that exposes the maximum surface area of catalyst to the exhaust gases, while also reducing the amount of catalyst required. Platinum, palladium and rhodium are extremely expensive.

As the exhaust gases from the engine pass over the catalysts, chemical reactions take place on their surfaces. The harmful molecules are broken up and converted into other gases that are "safe" to enter the air. These gases include carbon dioxide, nitrogen, oxygen and water.

Figure: Diagram of a catalytic converter — a cylindrical honeycomb/mesh structure coated with platinum (Pt), palladium (Pd) and rhodium (Rh), with exhaust gases entering from the engine at one end. Labels indicate that reduction occurs at one region of the mesh and oxidation occurs at another, with "safe" gases exiting the other end.

There are two different types of catalyst, a reduction catalyst and an oxidation catalyst. The reduction catalyst removes oxygen from nitrogen oxides to make nitrogen and oxygen. The oxidation catalyst adds oxygen to carbon monoxide to make carbon dioxide.

One of the biggest drawbacks of the catalytic converter is that it only works effectively at high temperatures. The average running temperature of a car engine is between 90 and 110 °C. It takes nearly 30 minutes for these temperatures to be reached.

The table below shows the percentages of carbon monoxide and nitrogen oxides converted to safe gases by a catalytic converter at different temperatures.

Temperature (°C)

Carbon monoxide converted (%)

Nitrogen oxides converted (%)

25

16

25

50

19

28

75

26

35

100

60

72

125

91

92

150

93

94

175

95

95

200

97

98

(i) Using your knowledge of particle theory suggest why a catalyst in mesh form works better than a lump of catalyst.

[2]

(ii) Tick (✓) the box that best describes the adverse effect that gases leaving the exhaust would have on the environment.

they have no effect on the environment

□

they reduce oxygen levels

□

they deplete the ozone layer

□

they cause global warming

□

[1]

(iii) Tick (✓) the box that best describes the conversion of carbon monoxide and nitrogen oxides into "safe" gases at different temperatures.

equal amounts of carbon monoxide and nitrogen oxides are converted at every temperature

□

more carbon monoxide is converted than nitrogen oxides up to 100 °C

□

more nitrogen oxides are converted than carbon monoxide up to 100 °C

□

40 % more nitrogen oxides are converted than carbon monoxide up to 100 °C

□

[1]

(iv) In your opinion how effective are catalytic converters? Explain your answer.

[2]

12
7 marks

Amelia recorded the volume of gas produced for 7 minutes for this reaction. She carried out the reaction at room temperature, 20°C. The results she collected are shown in the table.

Time (minutes)

Volume of hydrogen produced (cm3)

0

0

1

15

2

28

3

32

4

45

5

49

6

50

7

50

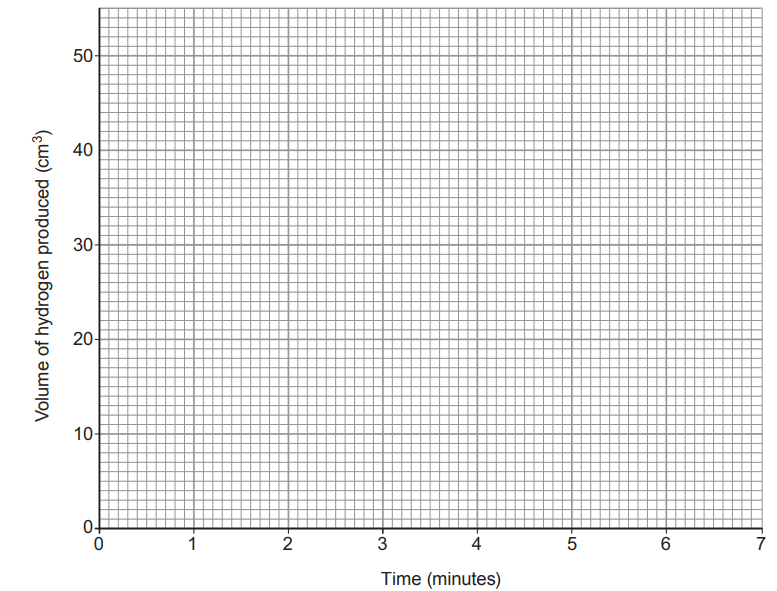
(i) Plot a graph of her results on the grid opposite. Draw a suitable line and label it A.

Figure: Blank grid with "Volume of hydrogen produced (cm3)" on the y-axis (0 to 50, in steps of 10) and "Time (minutes)" on the x-axis (0 to 7, in steps of 1).

[3]

(ii) Use the graph to find:

I. the volume of gas produced in 90 seconds.......................

[1]

II. the time taken for the reaction to end...............................

[1]

(iii) On the same grid, sketch the graph that would be obtained if Amelia repeated the same experiment at 40°C. Label it B.

[2]