The Ever-Changing Earth (WJEC GCSE Science (Double Award): Chemistry): Exam Questions

Exam code: 3430

1 hour15 questions
1a
2 marks

The diagram shows the structure of the Earth.
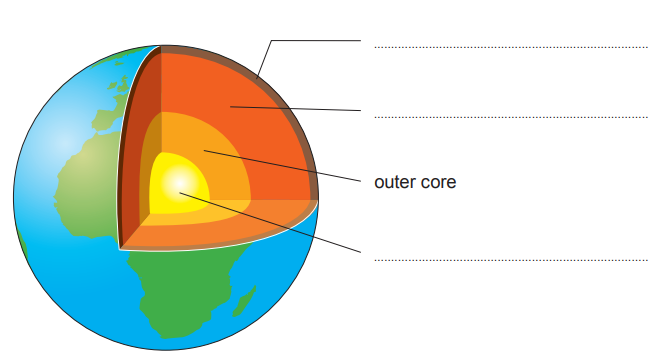
Figure: Cross-section diagram of the Earth showing four layers pointed to by lines from outside to centre — two unlabelled blank lines (outermost two layers), then "outer core" already filled in as the given example (third layer), then one more unlabelled blank line for the innermost/central layer

Use words from the box to label the layers of the Earth's structure on the diagram.

mantle

inner core

crust

One has been done for you.

1b
3 marks

Alfred Wegener's theory of continental drift describes how the Earth's continents have moved to their current positions.

Underline the correct words in the brackets to complete the sentences which describe the evidence on which Wegener based his theory.

Wegener found that there are similar ( trees / animals / rocks ) on different continents and that some continents have ( mountains / coastlines / oceans ) which fit together. Most people did not believe Wegener's theory at the time because he could not explain how the continents ( moved / formed / melted ).

1c
1 mark

Circle the name given to the large pieces which make up the Earth's crust.

plates

fractions

segments

2
4 marks

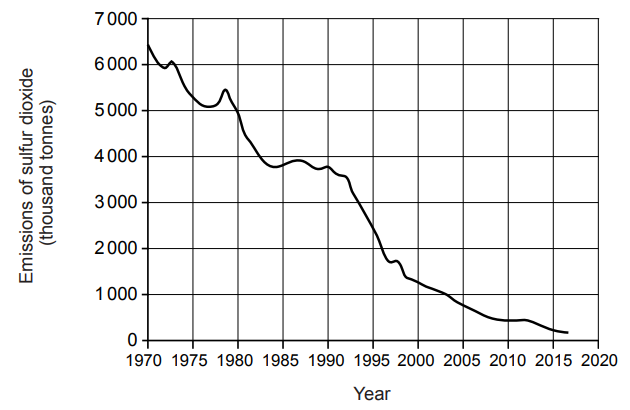
The graph shows the annual emissions of sulfur dioxide in the UK between 1970 and 2017.

Figure: Line graph titled 'Emissions of sulfur dioxide (thousand tonnes)' with y-axis from 0 to 7000 in steps of 1000, and x-axis 'Year' from 1970 to 2020 in steps of 5. The line starts high near 1970 (around 6000+ thousand tonnes) and declines steadily to a low value by 2017

(i) From 1970 to 2017, the level of sulfur dioxide emissions decreased by 97%.

Suggest two reasons why sulfur dioxide levels decreased over this period.

[2]

(ii) Explain the likely benefit of such a decrease on natural habitats.

[2]

3
6 marks

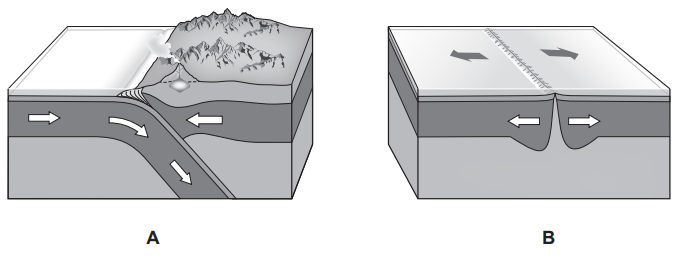
The diagrams show two types of plate boundaries, A and B. Describe what happens at each boundary.

Figure: Two cross-section diagrams of tectonic plate boundaries. Diagram A shows an oceanic plate and a continental plate moving towards each other, with the denser oceanic plate bending downward and sliding beneath the continental plate (subduction), with a volcano forming above where the subducted plate melts. Diagram B shows two plates moving apart from each other, with magma rising up from the mantle to fill the gap between them and cooling to form new rock at the boundary
4
4 marks

Human activity causes emissions of about 6 billion tonnes of carbon dioxide into the atmosphere each year. Carbon capture effectively traps the emissions from power plants or factory chimneys before they enter the atmosphere and contribute to global warming. There are different ideas regarding what to do with the gas once it has been captured.

Proposal 1

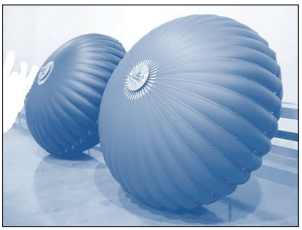
Photograph of two large, ribbed, blue plastic storage bags on the deep ocean floor, with one bag in the foreground and another behind it, illustrating proposed underwater storage of captured carbon dioxide.

One idea is to pipe the trapped gas to the ocean floor more than 4 km below sea level where the temperature is around 2 °C and the pressure can be up to 750 times atmospheric pressure. The captured carbon dioxide would be stored in a solid-liquid state in huge plastic bags. Each of these bags would hold about two days' worth of global emissions. Some scientists have predicted that we might find a way in the near future to use this 'solid' carbon dioxide as a fuel, possibly by combining it with hydrogen to produce methanoic acid for use in fuel cells.

Proposal 2

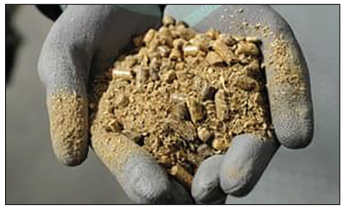
Photograph of grey-gloved hands holding a mound of coarse, beige-brown granular material, representing the refined carbon-emissions product used to make sodium hydrogencarbonate, or baking soda.

Another idea is to refine the carbon emissions to make a high-grade product which will then be used to make sodium hydrogencarbonate, also known as baking soda. Baking soda is in high demand in the pharmaceutical sector to help treat conditions from heartburn to kidney disease. It is found in ear and eye drops. It can also be used to produce components of detergents, sherbet powder and glass. Some manufacturers are even using it to remove acidic gases from factory emissions.

(i) Tick (✓) the two correct statements which explain why carbon dioxide would be in a solid-liquid state when in plastic bags at the deep ocean floor.

the pressure is higher than at sea level and the temperature is lower

□

the pressure and temperature are both lower than at sea level

□

particles are closer together at a higher pressure

□

carbon dioxide is not a gas at any temperature or pressure

□

particles are closer together at a higher temperature

□

[2]

(ii) Suggest two reasons why proposal 2 might be viewed as a better solution than proposal 1.

[2]

5a
1 mark

A great deal of scientific research into global warming has happened over the last 30 years.

More recently, two new contrasting theories linked to global warming have been widely reported. These are outlined below.

Solar activity

A small number of scientists believe that changes in solar activity (changes in the brightness and warmth of the Sun) is causing global warming. Solar activity occurs on the surface of the Sun when nuclear reactions cause flares to be released, high winds to occur and a release of high energy particles from the Sun.

Global dimming

Some scientists believe that global warming is increasing the Earth's mean temperature, but that global dimming is preventing it from increasing even more. Global dimming is the reduction in the amount of radiation reaching the Earth's surface from the Sun. It is thought to be caused by an increase of aerosol particles in the Earth's atmosphere caused by pollution, dust and smog, as well as volcanic eruptions. These particles absorb solar energy and reflect sunlight back into space.

Figure 1 shows the mean atmospheric temperature, carbon dioxide concentration in the atmosphere and solar activity between 1930 and 2010.

Figure 1

Year

Mean atmospheric temperature (°C)

CO2 concentration (ppm)

Solar activity (arbitrary units)

1930

13.6

309

3.9

1940

13.6

311

4.0

1950

13.8

316

4.2

1960

13.9

320

4.2

1970

14.0

331

4.0

1980

14.2

342

3.9

1990

14.3

358

3.7

2000

14.4

370

3.7

2010

14.6

383

3.6

Figure 2 shows the mean atmospheric temperature within a 20-mile radius of the Mount Pinatubo volcano in the Philippines between 1990 and 2000. Mount Pinatubo erupted in 1991.

Figure 2

Year

Mean atmospheric temperature (°C)

1990

15.1

1991

14.7

1992

14.8

1993

14.7

1994

14.7

1995

14.6

1996

14.7

1997

14.8

1998

14.7

1999

14.8

2000

14.9

Tick (✓) the box that best describes the change in carbon dioxide concentration in the atmosphere between 1930 and 2010.

Carbon dioxide concentration increased by approximately 10 ppm every 10 years

□

Carbon dioxide concentration increased more between 1970 and 2010 than it did between 1930 and 1960

□

Carbon dioxide concentration increased more between 1930 and 1960 than it did between 1970 and 2010

□

There is no trend to the change in carbon dioxide concentration between 1930 and 2010

□

5b
2 marks

A newspaper report states that global warming is caused by increases in atmospheric carbon dioxide levels and by increases in solar activity.

Explain whether the data in Figure 1 supports this claim.

5c
1 mark

Figure 2 shows that the mean atmospheric temperature near Mount Pinatubo decreased after the volcanic eruption of 1991. Suggest why scientists would not use these findings to explain how volcanic activity affects global temperatures.

5d
1 mark

State one industrial method that is being developed to reduce the concentration of carbon dioxide in the atmosphere.

5e
3 marks

The Earth's original atmosphere contained about 95% carbon dioxide. Today, the atmosphere contains 0.04% carbon dioxide. Explain why the level of carbon dioxide decreased over geological time.

5f
1 mark

When carbon dioxide turns limewater milky, calcium hydroxide is produced.

Give the formula of calcium hydroxide.

.......................................................................................

6a
5 marks

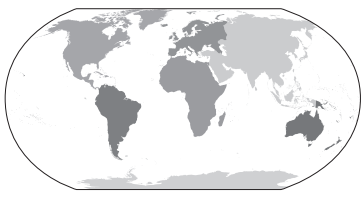
The diagram shows how the Earth's continents are arranged today.

Figure: World map showing the modern arrangement of the continents, with South America, Africa and Australia shaded in a darker tone

In 1912, Alfred Wegener proposed the theory of continental drift.

(i) Use statements from the table to answer parts I. and II. below.

A

there are similar animals on different continents

B

there are similar fossils on different continents

C

only Europe, Asia and Africa were once joined

D

all of the continents were once joined

E

there is a jigsaw fit of different continents

F

there are similar rocks on different continents

G

none of the continents were joined

I. Give the letter of the statement that describes how Wegener suggested the continents were originally arranged.

..........................................

[1]

II. Give the letters of three pieces of evidence that Wegener used to support his theory.

.......................................... .......................................... ..........................................

[3]

(ii) Underline the correct word in the brackets to complete the following sentence.

Wegener could not explain how the continents moved but it is now known that this happens because of ( conduction / convection / radiation ) currents in the Earth's mantle.

[1]

6b
4 marks

The table shows how the mean temperature of the Earth's atmosphere has increased between 1960 and 2010.

Year

Mean temperature (°C)

1960

13.9

1970

14.0

1980

14.2

1990

14.3

2000

14.4

2010

14.6

(i) Underline the mean temperature of the Earth's atmosphere in 2020 if this trend continued.

15.0

14.4

14.8

[1]

(ii) Name the gas which is mainly responsible for the temperature increase.

..............................................................................................................

[1]

(iii) Give two effects of global warming.

Effect 1 ..................................................................................................................................................................

Effect 2 ..................................................................................................................................................................

[2]

7
6 marks

Describe how respiration and photosynthesis keep the carbon dioxide and oxygen content of the atmosphere approximately constant. Discuss how human activity is threatening this balance.

8a
1 mark

The table shows various stages in the development of the Earth's atmosphere since its formation 4 500 million years ago.

Stage

Major events

Gases present in the atmosphere

1

volcanic eruptions

carbon dioxide, water vapour, methane, ammonia

2

oceans form

carbon dioxide, methane, ammonia

3

green plants evolve

carbon dioxide, nitrogen, oxygen

4

most carbon dioxide becomes locked in rock and fossil fuels

nitrogen, oxygen, water vapour

Which one of these statements best describes how the oceans were formed?

Put a tick (✓) in the box next to the correct answer.

Water vapour evaporated to form clouds

□

The Earth cooled so water vapour condensed

□

Bacteria and algae turned the water vapour into liquid water

□

There were no more volcanoes to produce water vapour

□

8b
2 marks

Explain why the appearance of green plants was an important stage in the development of the atmosphere.

9a
3 marks

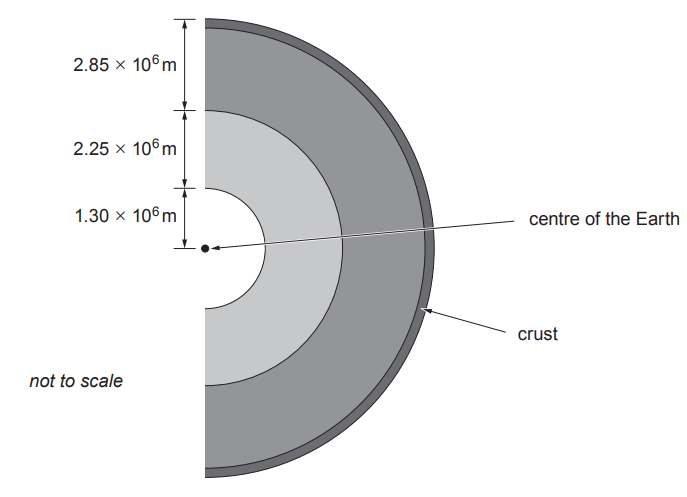
The Earth is almost spherical. The diagram shows a section of the layered structure of the Earth.

Figure: Diagram of a cross-section through the Earth (not to scale), showing the crust as a thin outer layer and labelled distances from the surface to the centre of the Earth: 2.85 × 10⁶ m, 2.25 × 10⁶ m, and 1.30 × 10⁶ m, marking the boundaries between the Earth's layers down to the centre.

The thickness of the crust at one location is 0.97% of the distance from the surface to the centre of the Earth.

Use this information to calculate the thickness of the crust. Give your answer in standard form.

Thickness of crust = ................................................ m

9b
5 marks

(i) Describe the theory of plate tectonics.

[3]

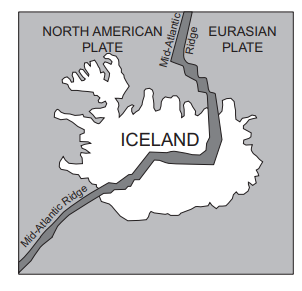
(ii) Iceland lies on the Mid-Atlantic Ridge which is formed at a constructive plate boundary. Explain the formation of the Mid-Atlantic Ridge.

Figure: Map diagram showing Iceland positioned on the Mid-Atlantic Ridge, between the North American Plate to the west and the Eurasian Plate to the east, with the ridge running through the middle marking the boundary between the two plates.

[2]

10a
5 marks

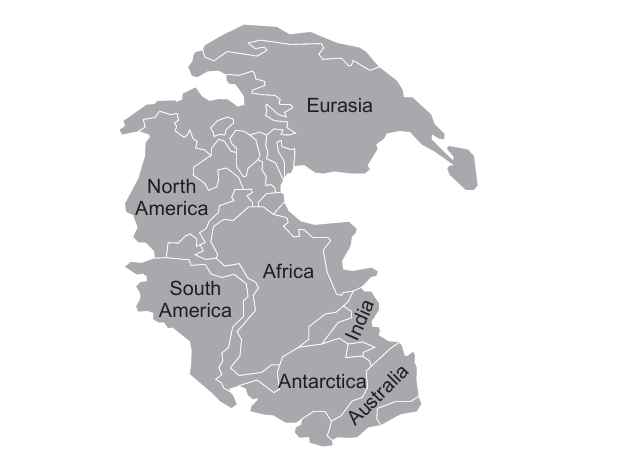
In 1915 Alfred Wegener suggested that the Earth's continents were once joined together as one large land mass.

World map showing the continents (Eurasia, North America, South America, Africa, Antarctica, Australia, India) arranged as they are labelled today, illustrating the modern continental positions Wegener's theory sought to explain

(i) State three pieces of evidence that Alfred Wegener used to support his theory.

[3]

(ii) Explain why Wegener's theory was not originally accepted by other scientists, but it is today.

[2]

10b
1 mark

What type of destructive event is likely to happen at a conservative plate boundary?

.................................................................................................

11a
3 marks

Levels of oxygen and carbon dioxide in the atmosphere are maintained at approximately constant values.

Identify the natural processes that help maintain the balance of oxygen and carbon dioxide levels in the atmosphere. Describe briefly how this is achieved.

11b
2 marks

The table shows the amount of carbon dioxide produced by the United States of America and India between 1955 and 2015.

Year

Carbon dioxide emissions (million tonnes)

USA (million tonnes)

India (million tonnes)

1955

700

100

1965

800

250

1975

1150

250

1985

1150

450

1995

1150

600

2005

1400

900

2015

1300

1850

Use the information in the table to compare the increase in carbon dioxide emissions in the United States of America and India between 1955 and 2015.

12a
2 marks

The Earth's crust is broken up into tectonic plates.

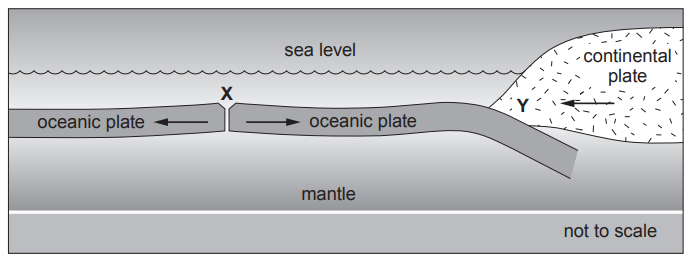
The diagram shows two plate boundaries X and Y.

Figure: Cross-section diagram showing an oceanic plate and a continental plate meeting the mantle below, with sea level marked. Boundary X is where two oceanic plates move apart from each other, showing a gap between them. Boundary Y is where the oceanic plate is pushed underneath (subducted beneath) the continental plate.

Describe what happens as the plates move apart at plate boundary X.

...................................................................................................................................................................

...................................................................................................................................................................

12b
3 marks

The two types of plate have different densities as shown in the table.

Type of plate

Density (g/ cm3)

continental

4.7

oceanic

5.0

At boundary Y the oceanic plate is pushed underneath the continental plate.

(i) State why the oceanic plate is pushed underneath the continental plate.

...................................................................................................................................................................

[1]

(ii) State what happens to the oceanic plate when it goes underneath the continental plate.

...................................................................................................................................................................

[1]

(iii) Underline the name of the type of plate boundary seen at Y.

destructive constructive conservative

[1]

12c
2 marks

Using satellite imaging, scientists discovered that one oceanic plate had moved 537 cm over 600 years. Calculate the mean rate of movement of the plate over this time.

rate=distancetime

Rate = ....................................................... cm / year

13a
4 marks

The Earth's early atmosphere around 4000 million years ago contained mainly carbon dioxide and water vapour produced by volcanoes.

(i) Explain why the large percentage of water vapour in the Earth's atmosphere decreased over geological time.

...................................................................................................................................................................

...................................................................................................................................................................

[2]

(ii) Give two reasons why the percentage of carbon dioxide in the Earth's atmosphere has decreased over geological time.

...................................................................................................................................................................

...................................................................................................................................................................

[2]

13b
2 marks

During the last 250 years the percentage of carbon dioxide in the Earth's atmosphere has increased from 0.03% to 0.04%. This has led to increased global warming. Give one reason for this increase and explain why global warming is a cause for concern.

...................................................................................................................................................................

...................................................................................................................................................................

...................................................................................................................................................................

14
2 marks

(i) The gas given off when pair B react is carbon dioxide. Describe the test for carbon dioxide gas.

[1]

(ii) One of the solutions in pair B is sodium carbonate. Give the formula of sodium carbonate.

[1]

15a
2 marks

Which of the following statements best describes how the fuels affect the environment when they burn? Tick (✓) the correct answer and give the reason for your choice.

all of the fuels contribute to acid rain and global warming when they burn

□

fuels A and C contribute to acid rain and global warming when they burn

□

only fuel C contributes to acid rain and global warming when it burns

□

none of the fuels contribute to acid rain and global warming when they burn

□

Reason

15b
2 marks

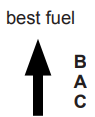
A students eventually agreed on the following rank order for the fuels:

Vertical rank order of fuels from best to worst: fuel B at the top, followed by fuel A, then fuel C. An upward arrow indicates that higher positions represent better fuels.

In the table below, tick (✓) all the statements that are correct and could therefore have been used in deciding upon this order.

fuel C will run out after fuels A and B

□

fuel C is easier to store than fuel A

□

fuel A burns more easily than fuel C

□

fuel B is the cleanest fuel

□

fuel B is easier to store than fuel C

□

fuel B will never run out

□

fuel A is less harmful to the environment than fuel C

□

fuel A is less cost efficient than fuel B

□