15 marks
Table 5.2 shows the global production of carbon dioxide from manufacturing cement from 1980 to 2020.
Table 5.2
year | global production of carbon dioxide from manufacturing cement / thousand million tonnes |
|---|---|
1980 | 400 |
1990 | 480 |
2000 | 700 |
2010 | 1240 |
2020 | 1600 |
Source: Hannah Ritchie, Pablo Rosado and Max Roser (2023), 'CO2 and Greenhouse Gas Emissions', OurWorldInData.org, CC BY 4.0
Use Table 5.2 to plot a line graph on the grid to show the global production of carbon dioxide from manufacturing cement from 1980 to 2020.
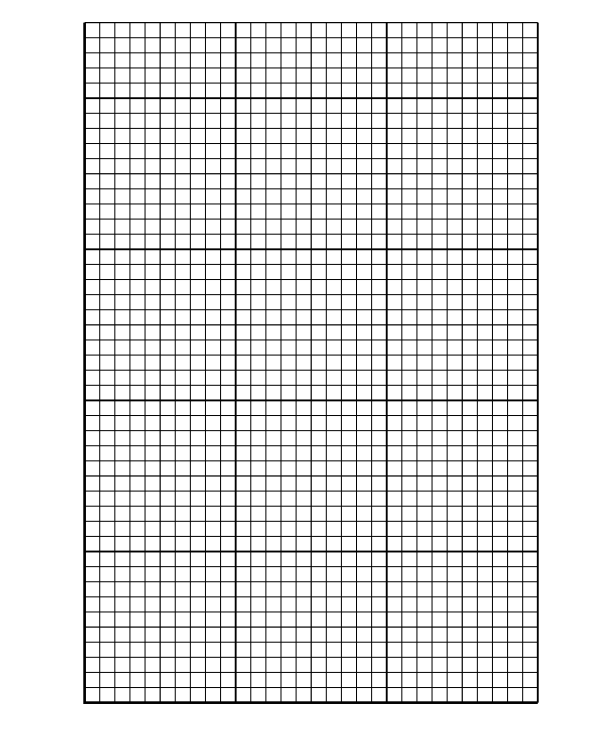
Draw a straight line between each plotted point.
Was this exam question helpful?