11 mark
Figure 3.1 shows the world population pyramid in 2023.
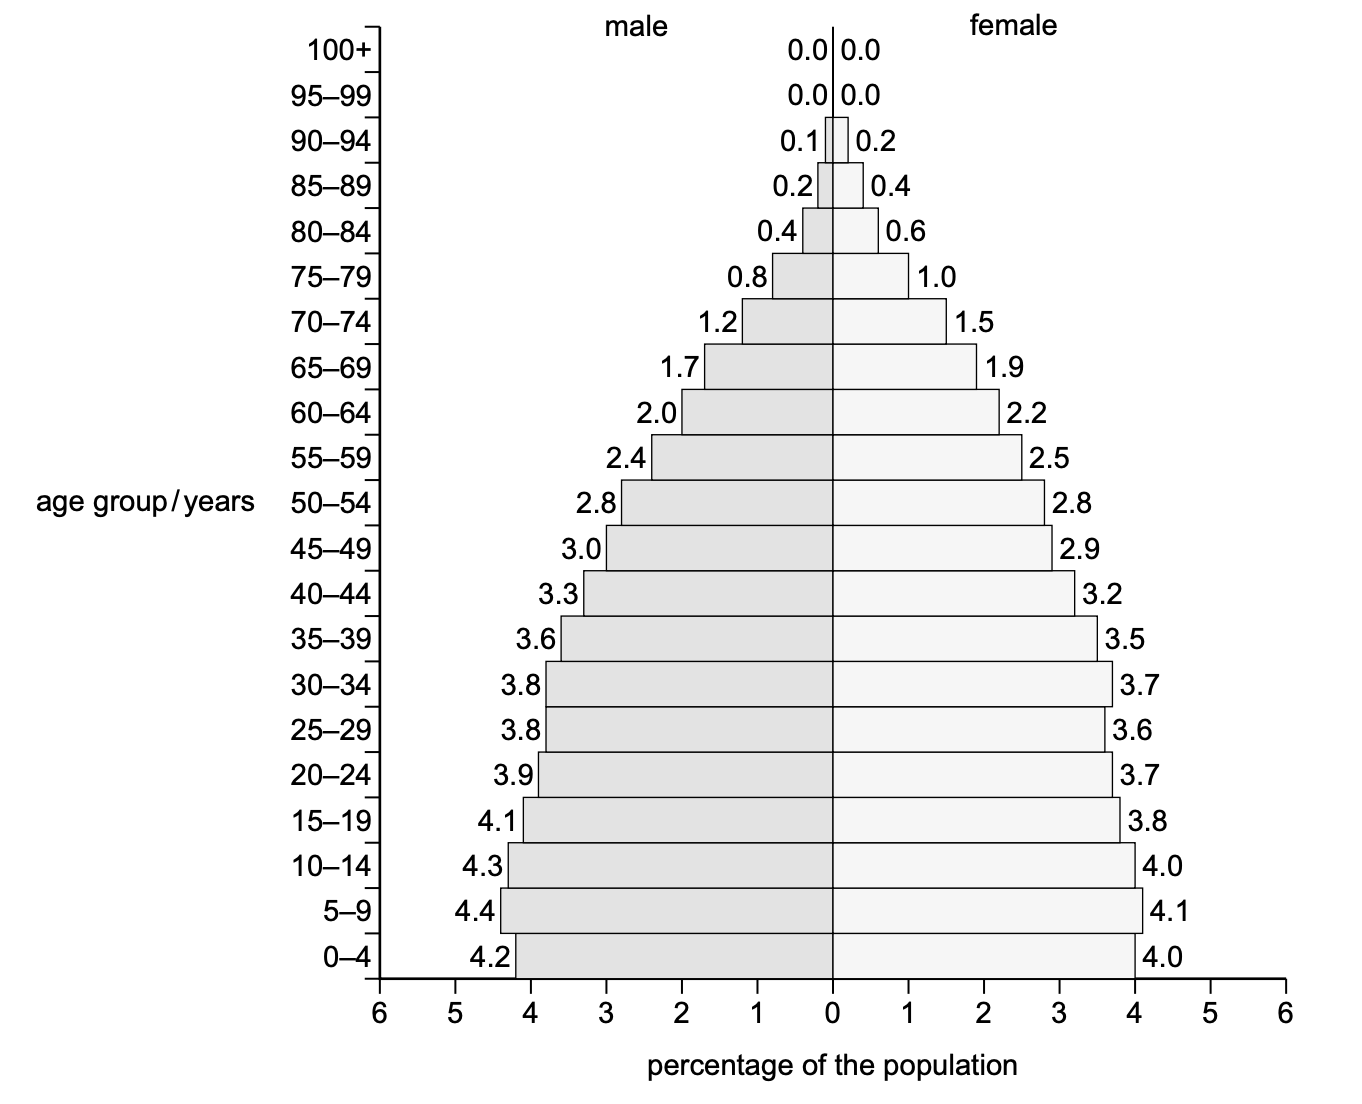
State the percentage of the world population that is over 74 years of age in 2023.
Was this exam question helpful?
Exam code: 0680
Figure 3.1 shows the world population pyramid in 2023.
State the percentage of the world population that is over 74 years of age in 2023.
Was this exam question helpful?
Figure 3.1 shows the world population pyramid in 2023.
Suggest why the percentage values in the pyramid in Figure 3.1 do not total 100%.
Was this exam question helpful?
Figure 3.1 shows the world population pyramid in 2023.
Use Figure 3.1 to compare the world population of males to the world population of females in 2023.
Was this exam question helpful?
The population pyramids for low-income countries (LICs) and high-income countries (HICs) are different.
Complete Table 3.1.
description | tick (✓) if true | tick (✓) if false |
|---|---|---|
LICs have a wider base than HICs. | ||
HICs have a smaller percentage of people in the working population than LICs. | ||
LICs have a smaller percentage of elderly dependants than HICs. |
Tick (✓) to show if a description is true or false.
Was this exam question helpful?