Fieldwork Investigations (Cambridge (CIE) IGCSE Environmental Management): Exam Questions

Exam code: 0680

24 mins11 questions
1
2 marks

Figure 2.1 shows a giant African land snail.
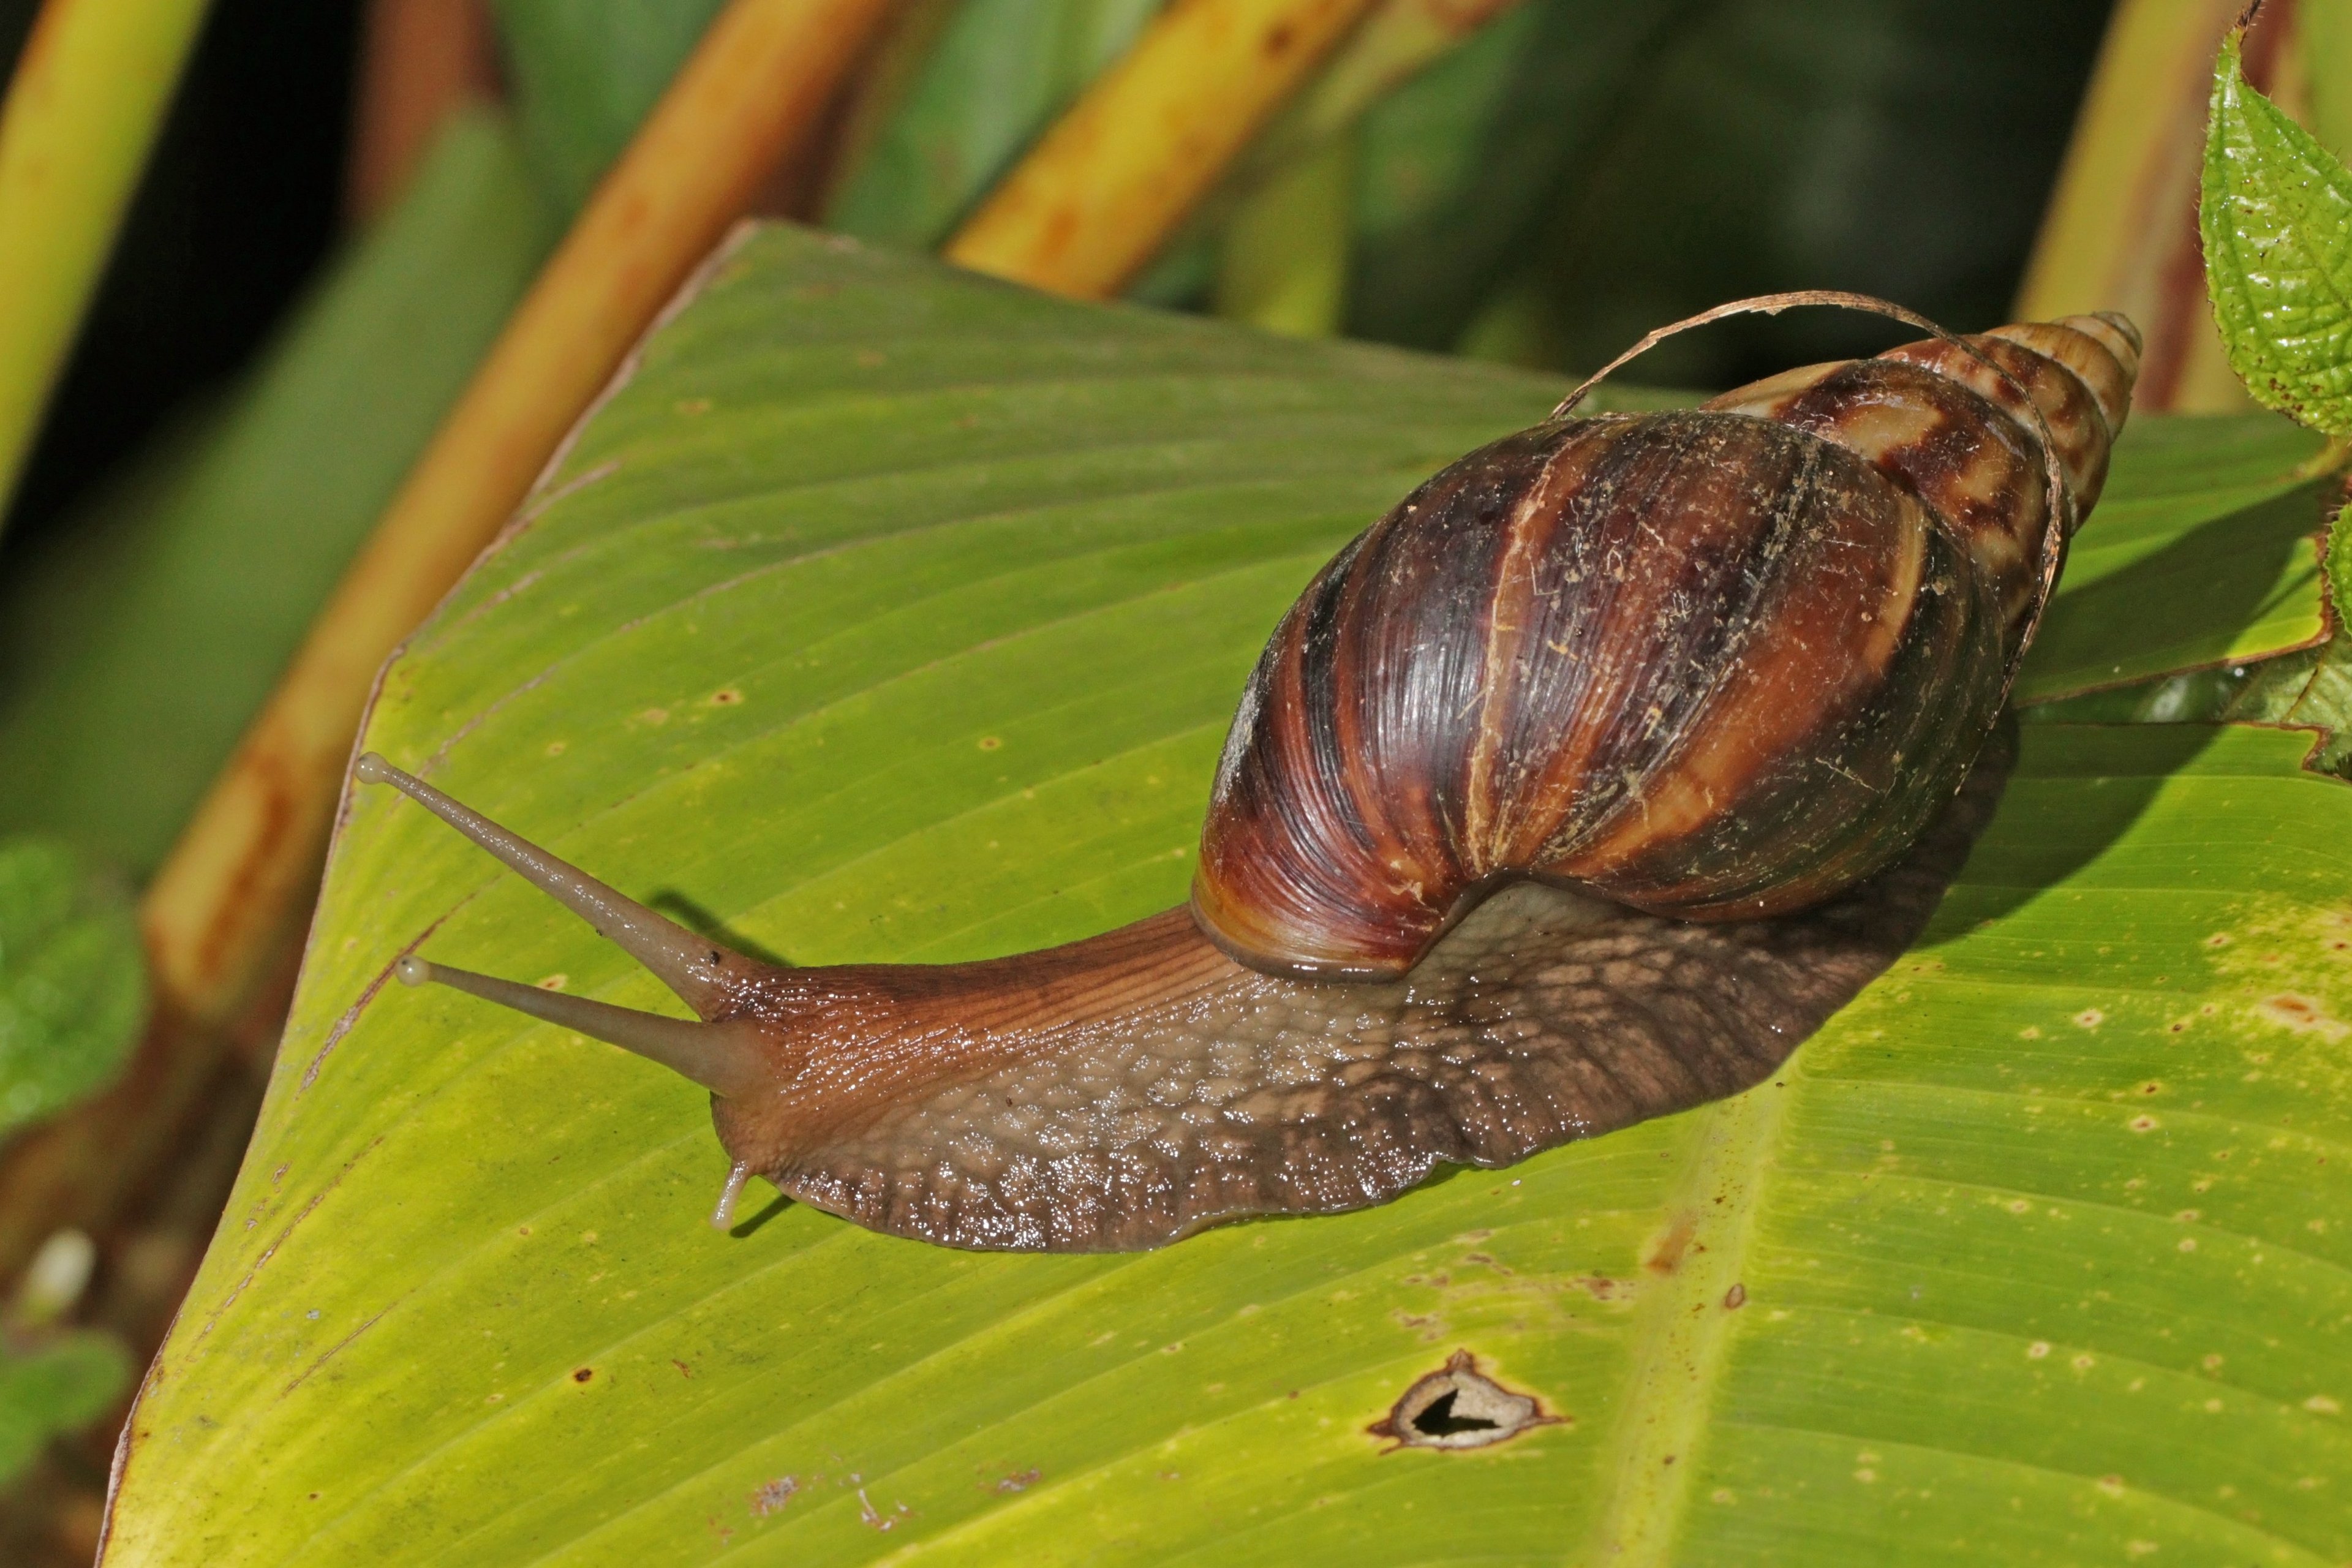
Giant African Land Snail on a leaf
Figure 2.1 Charles J. Sharp, CC BY-SA 4.0 via Wikimedia Commons

Giant African land snails eat plants.

In 2022, two populations of giant African land snails were found in the state of Florida, USA.

Figure 2.2 shows the location of these two populations.
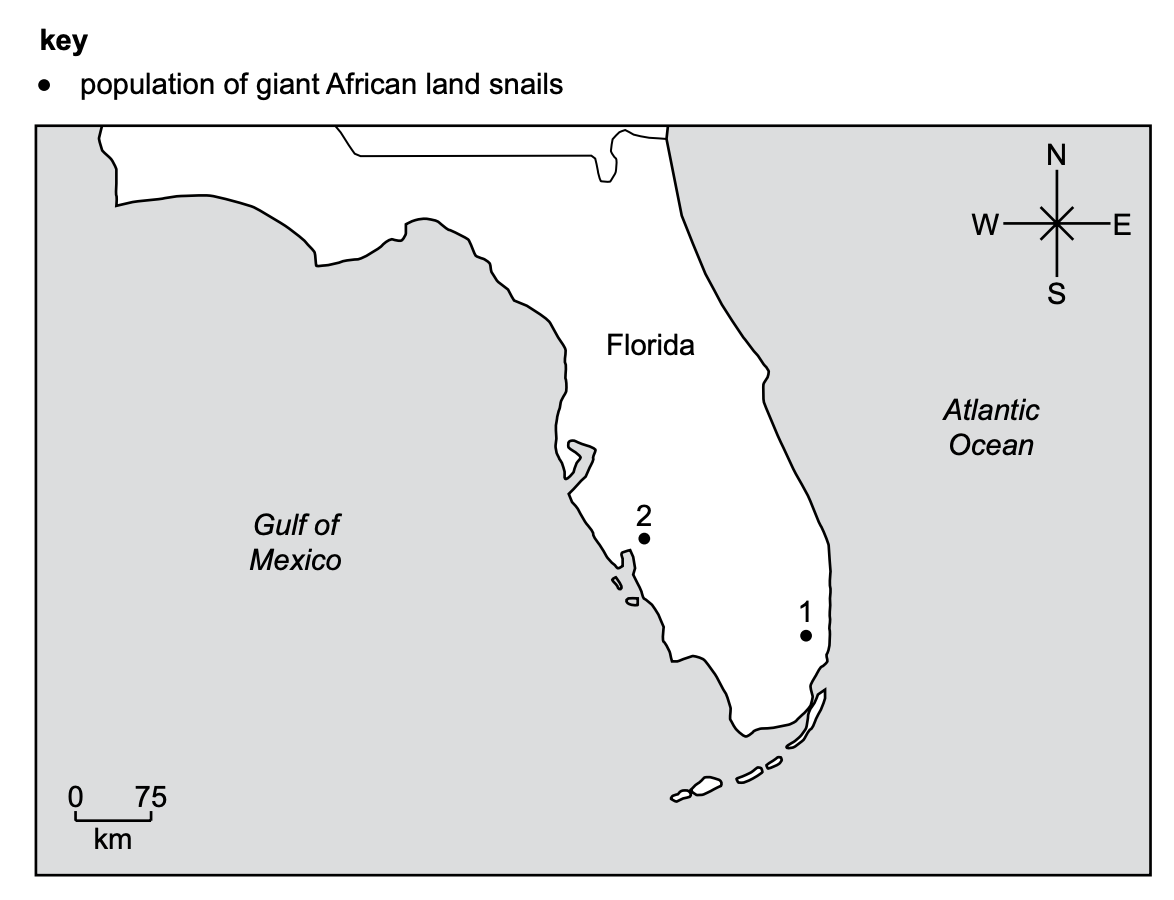
Map of Florida showing two giant African land snail populations, marked by black dots labelled 1 in the south-east and 2 on the west coast. A scale bar shows 0–75 kilometres; north, south, east and west are marked.
Figure 2.2

Use Figure 2.2 to calculate the distance between the two populations.

Show your working.

2
1 mark

The scientist investigates the effect of three different fertilisers on the crop yield of maize plants.

Table 3.1 shows the results of the investigation.

Table 3.1

fertiliser used

formula for ion

days until harvest

crop yield / thousand kg per Ha

nitrate

..........

94

31

phosphate

..........

98

28

potassium

K⁺

95

25

control

96

18

The investigation uses a control. The control is pure water.

Suggest why a control is used in this investigation.

3
4 marks

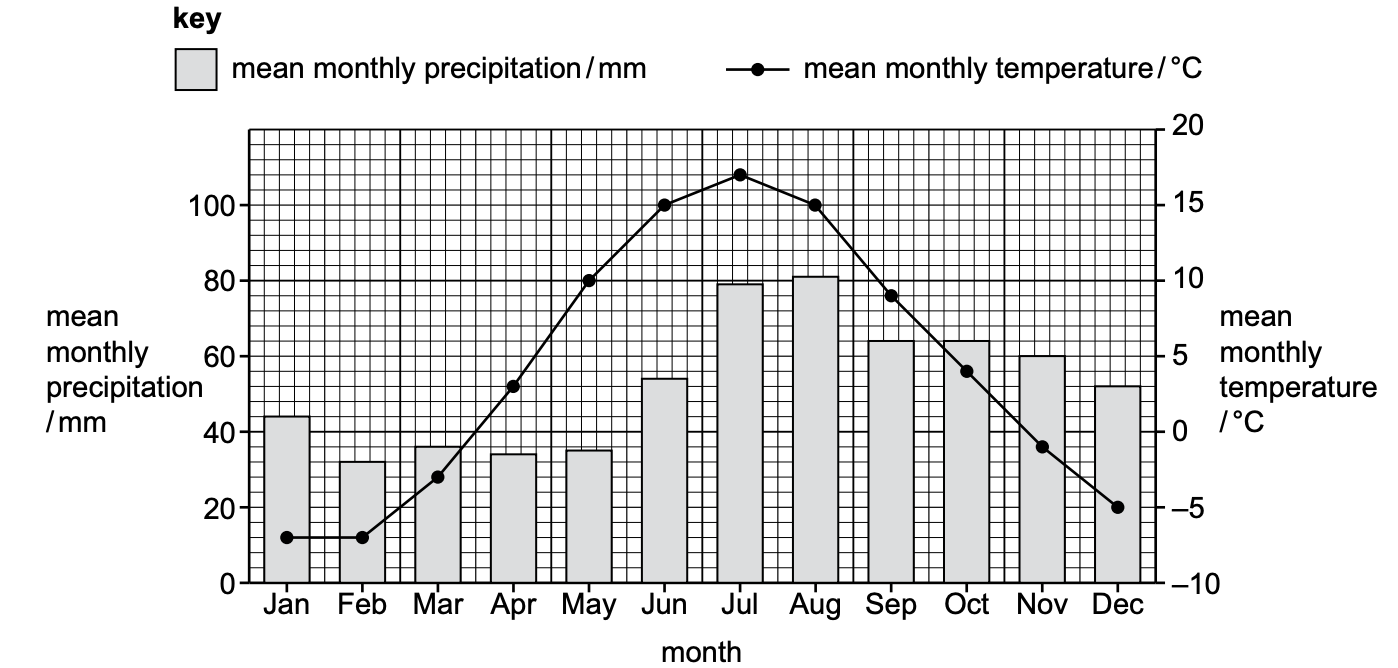
Figure 1.1 shows data collected at a farm in Finland.

Dual-axis bar-and-line chart of mean monthly precipitation and temperature in Finland. Precipitation Jan–Dec is 44, 32, 36, 34, 35, 54, 79, 81, 64, 64, 60 and 52 mm; October and November temperatures are 4 and minus 1 degrees Celsius.
Figure 1.1 -NASA's Earth Observatory

A student uses the data in Figure 1.1 to make two conclusions:

  • February is always the wettest month in Finland.

  • The temperature in October is always higher than the temperature in November in Finland.

Suggest two limitations of these conclusions.

Explain these limitations.

4
1 mark

In 2022, two populations of giant African land snails were found in the state of Florida, USA.

Figure 2.2 shows the location of these two populations.

Map of Florida showing two giant African land snail populations, marked by black dots labelled 1 in the south-east and 2 on the west coast. A scale bar shows 0–75 kilometres; north, south, east and west are marked.
Figure 2.2

Give the direction of population 2 from population 1.

5
5 marks

A scientist wants to use a random sampling strategy to estimate the population of giant African land snails in Florida.

Describe a random sampling strategy to estimate the population of giant African land snails in Florida.

In your answer include a method to:

  • select the area to sample

  • collect and record your data

  • estimate the population of giant African land snails in Florida.

6
3 marks

The scientist also uses a systematic sampling strategy to estimate the population of giant African land snails.

Suggest benefits and limitations of using a systematic sampling strategy to estimate the population of giant African land snails in Florida.

7
2 marks

The scientist investigates the effect of three different fertilisers on the crop yield of maize plants.

Table 3.1 shows the results of the investigation.

Table 3.1

fertiliser used

formula for ion

days until harvest

crop yield / thousand kg per Ha

nitrate

..........

94

31

phosphate

..........

98

28

potassium

K⁺

95

25

control

96

18

The scientist concludes:

'Adding fertiliser to maize crops decreases the number of days until harvest.'

Explain one way the data:

supports the conclusion

does not support the conclusion

8
2 marks

The scientist investigates the effect of three different fertilisers on the crop yield of maize plants.

Table 3.1 shows the results of the investigation.

Table 3.1

fertiliser used

formula for ion

days until harvest

crop yield / thousand kg per Ha

nitrate

..........

94

31

phosphate

..........

98

28

potassium

K⁺

95

25

control

96

18

Give one conclusion about the effect of fertilisers on the crop yield of maize.

Justify your conclusion.

9
1 mark

The scientist investigates the effect of three different fertilisers on the crop yield of maize plants.

Table 3.1 shows the results of the investigation.

Table 3.1

fertiliser used

formula for ion

days until harvest

crop yield / thousand kg per Ha

nitrate

..........

94

31

phosphate

..........

98

28

potassium

K⁺

95

25

control

96

18

State the independent variable in this investigation.

10
1 mark

The scientist investigates the effect of three different fertilisers on the crop yield of maize plants.

Table 3.1 shows the results of the investigation.

Table 3.1

fertiliser used

formula for ion

days until harvest

crop yield / thousand kg per Ha

nitrate

..........

94

31

phosphate

..........

98

28

potassium

K⁺

95

25

control

96

18

State one dependent variable in this investigation.

11
2 marks

The scientist investigates the effect of three different fertilisers on the crop yield of maize plants.

Table 3.1 shows the results of the investigation.

Table 3.1

fertiliser used

formula for ion

days until harvest

crop yield / thousand kg per Ha

nitrate

..........

94

31

phosphate

..........

98

28

potassium

K⁺

95

25

control

96

18

State two control variables in this investigation.