Concavity (College Board AP® Precalculus): Study Guide

Concavity of a function
How is rate of change defined for a non-linear graph?
On the graph of a non-linear function (i.e. a curve rather than a straight line)
the rate of change at a point on the graph
is defined as the slope of the straight tangent line drawn at that point
If the slope of the tangent line is positive then the rate of change is positive
This occurs when the function is increasing
If the slope of the tangent line is negative then the rate of change is negative
This occurs when the function is decreasing
The rate of change is greater when the graph is steeper
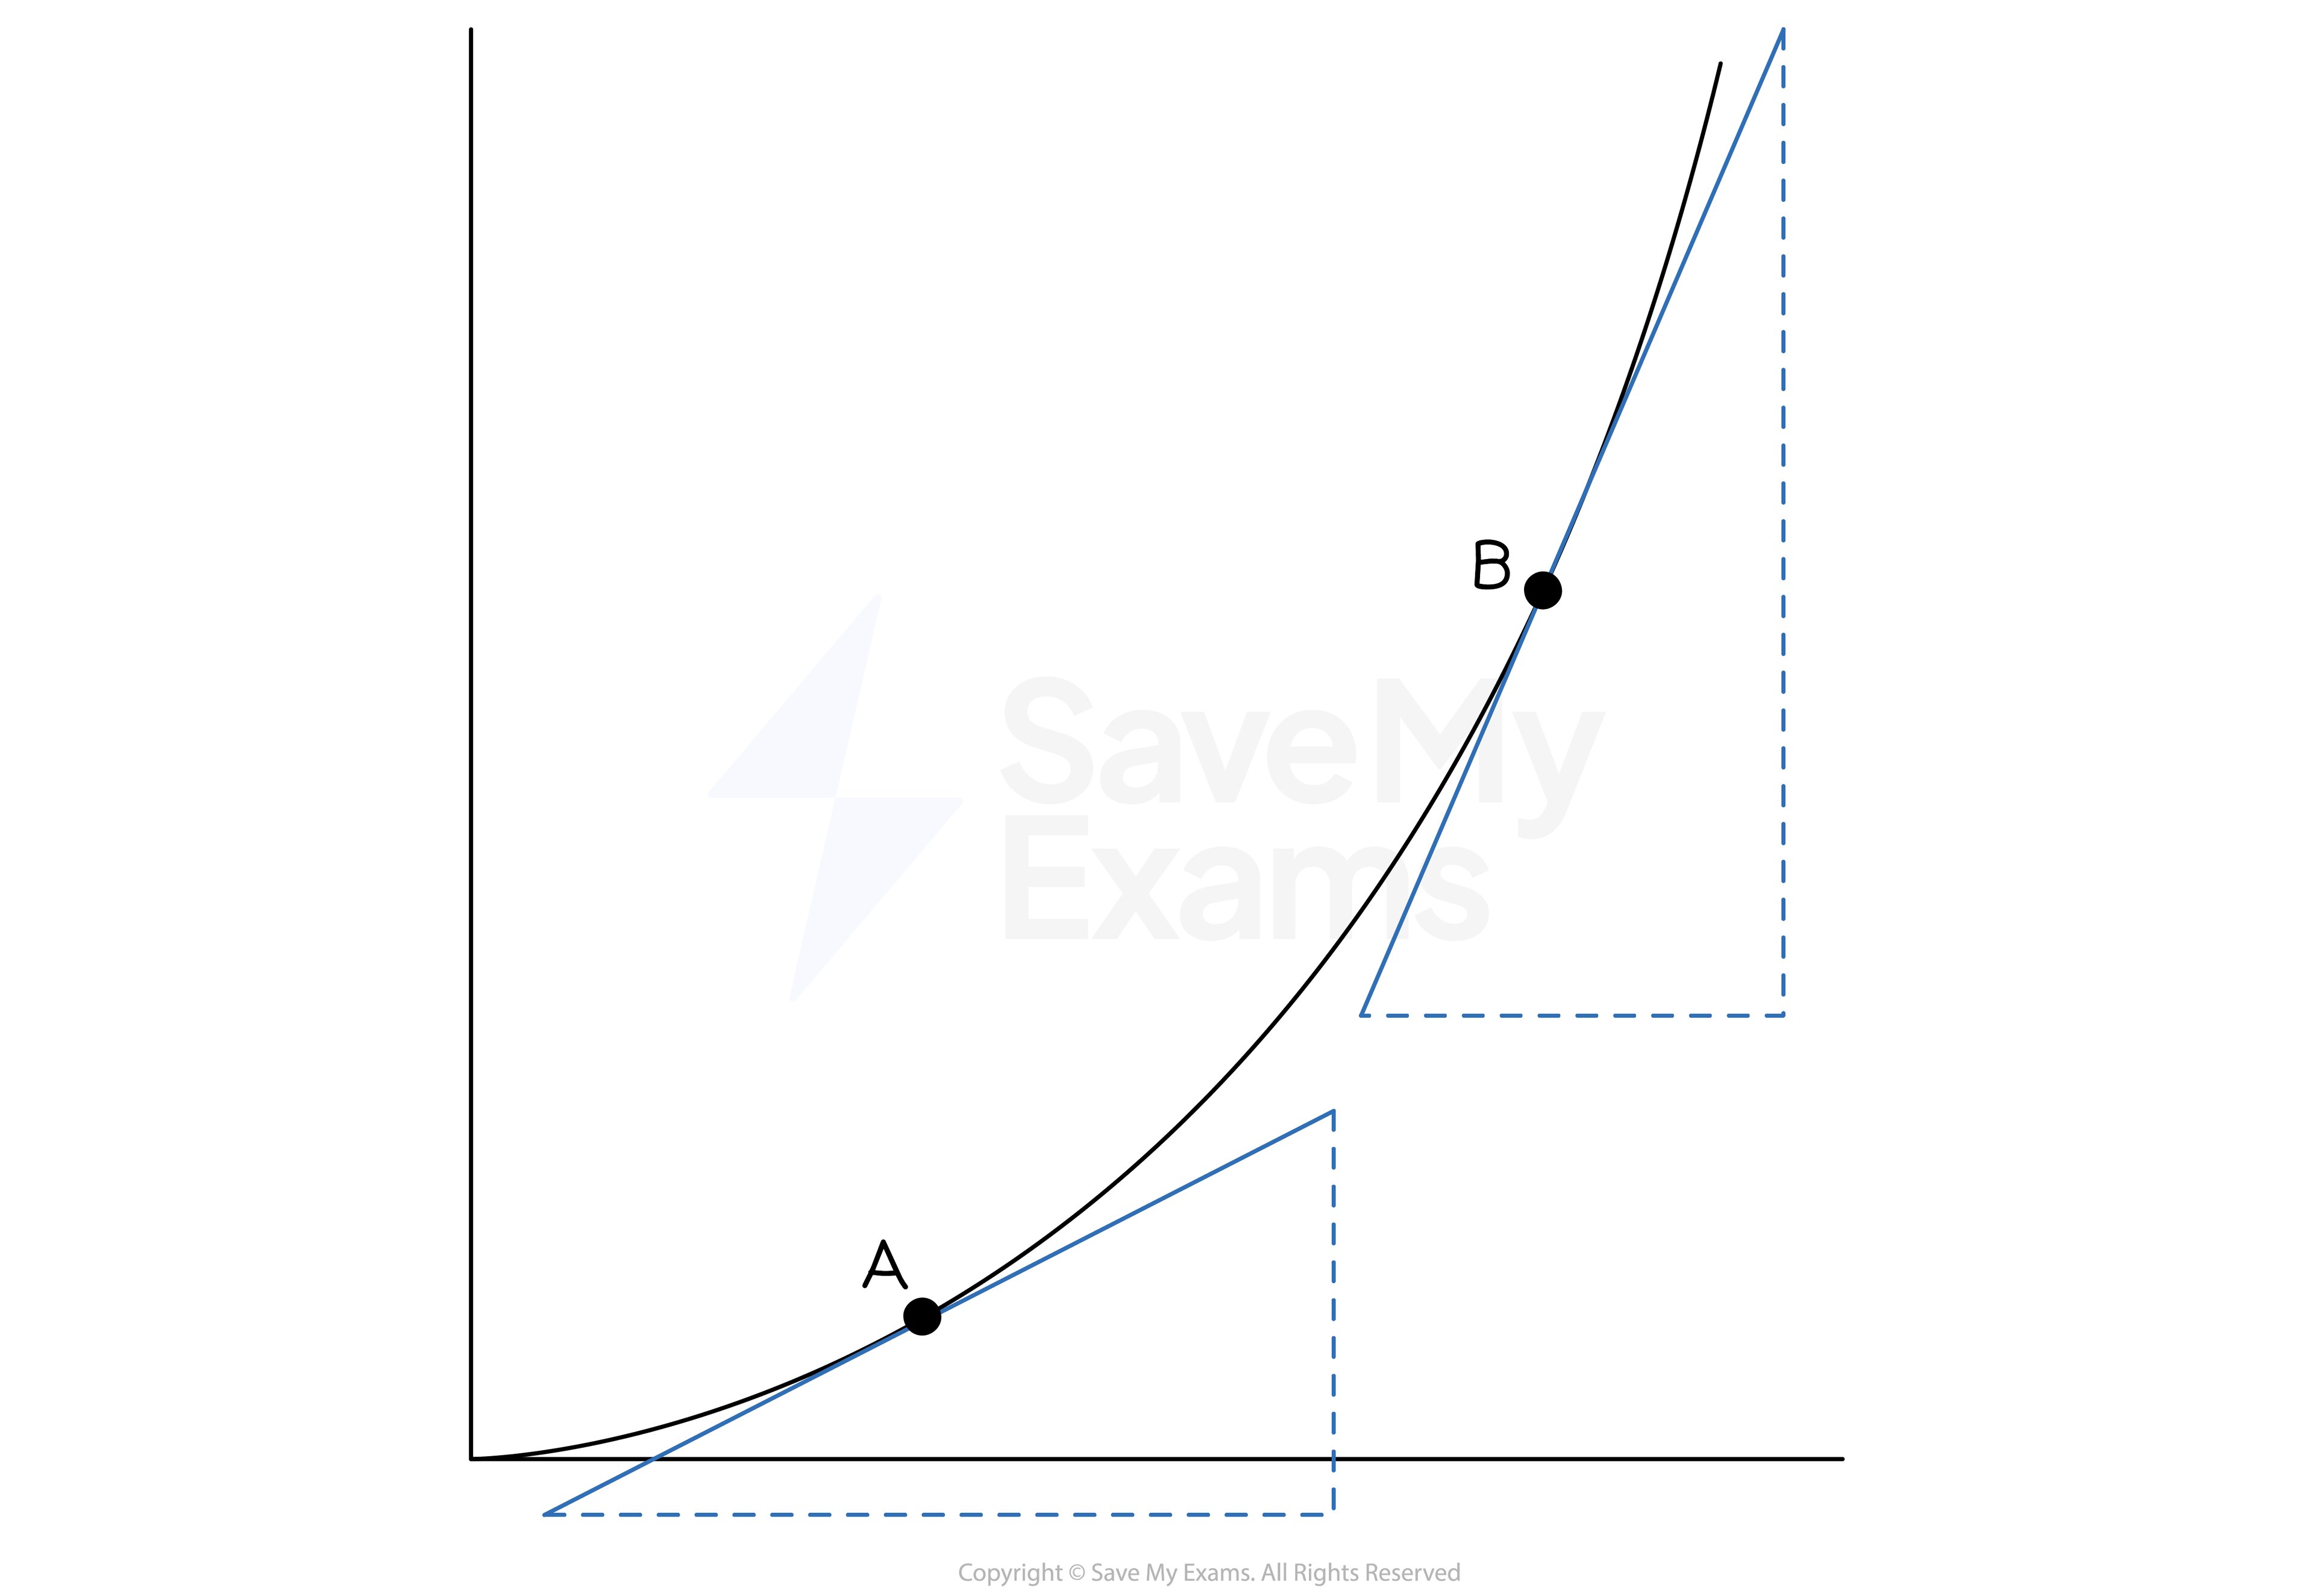
E.g. in the image below
tangents drawn at points A and B show that the rate of change is positive at both those points
But the graph is steeper at B
therefore the rate of change at B is greater
What does it mean for the graph of a function to be concave up?
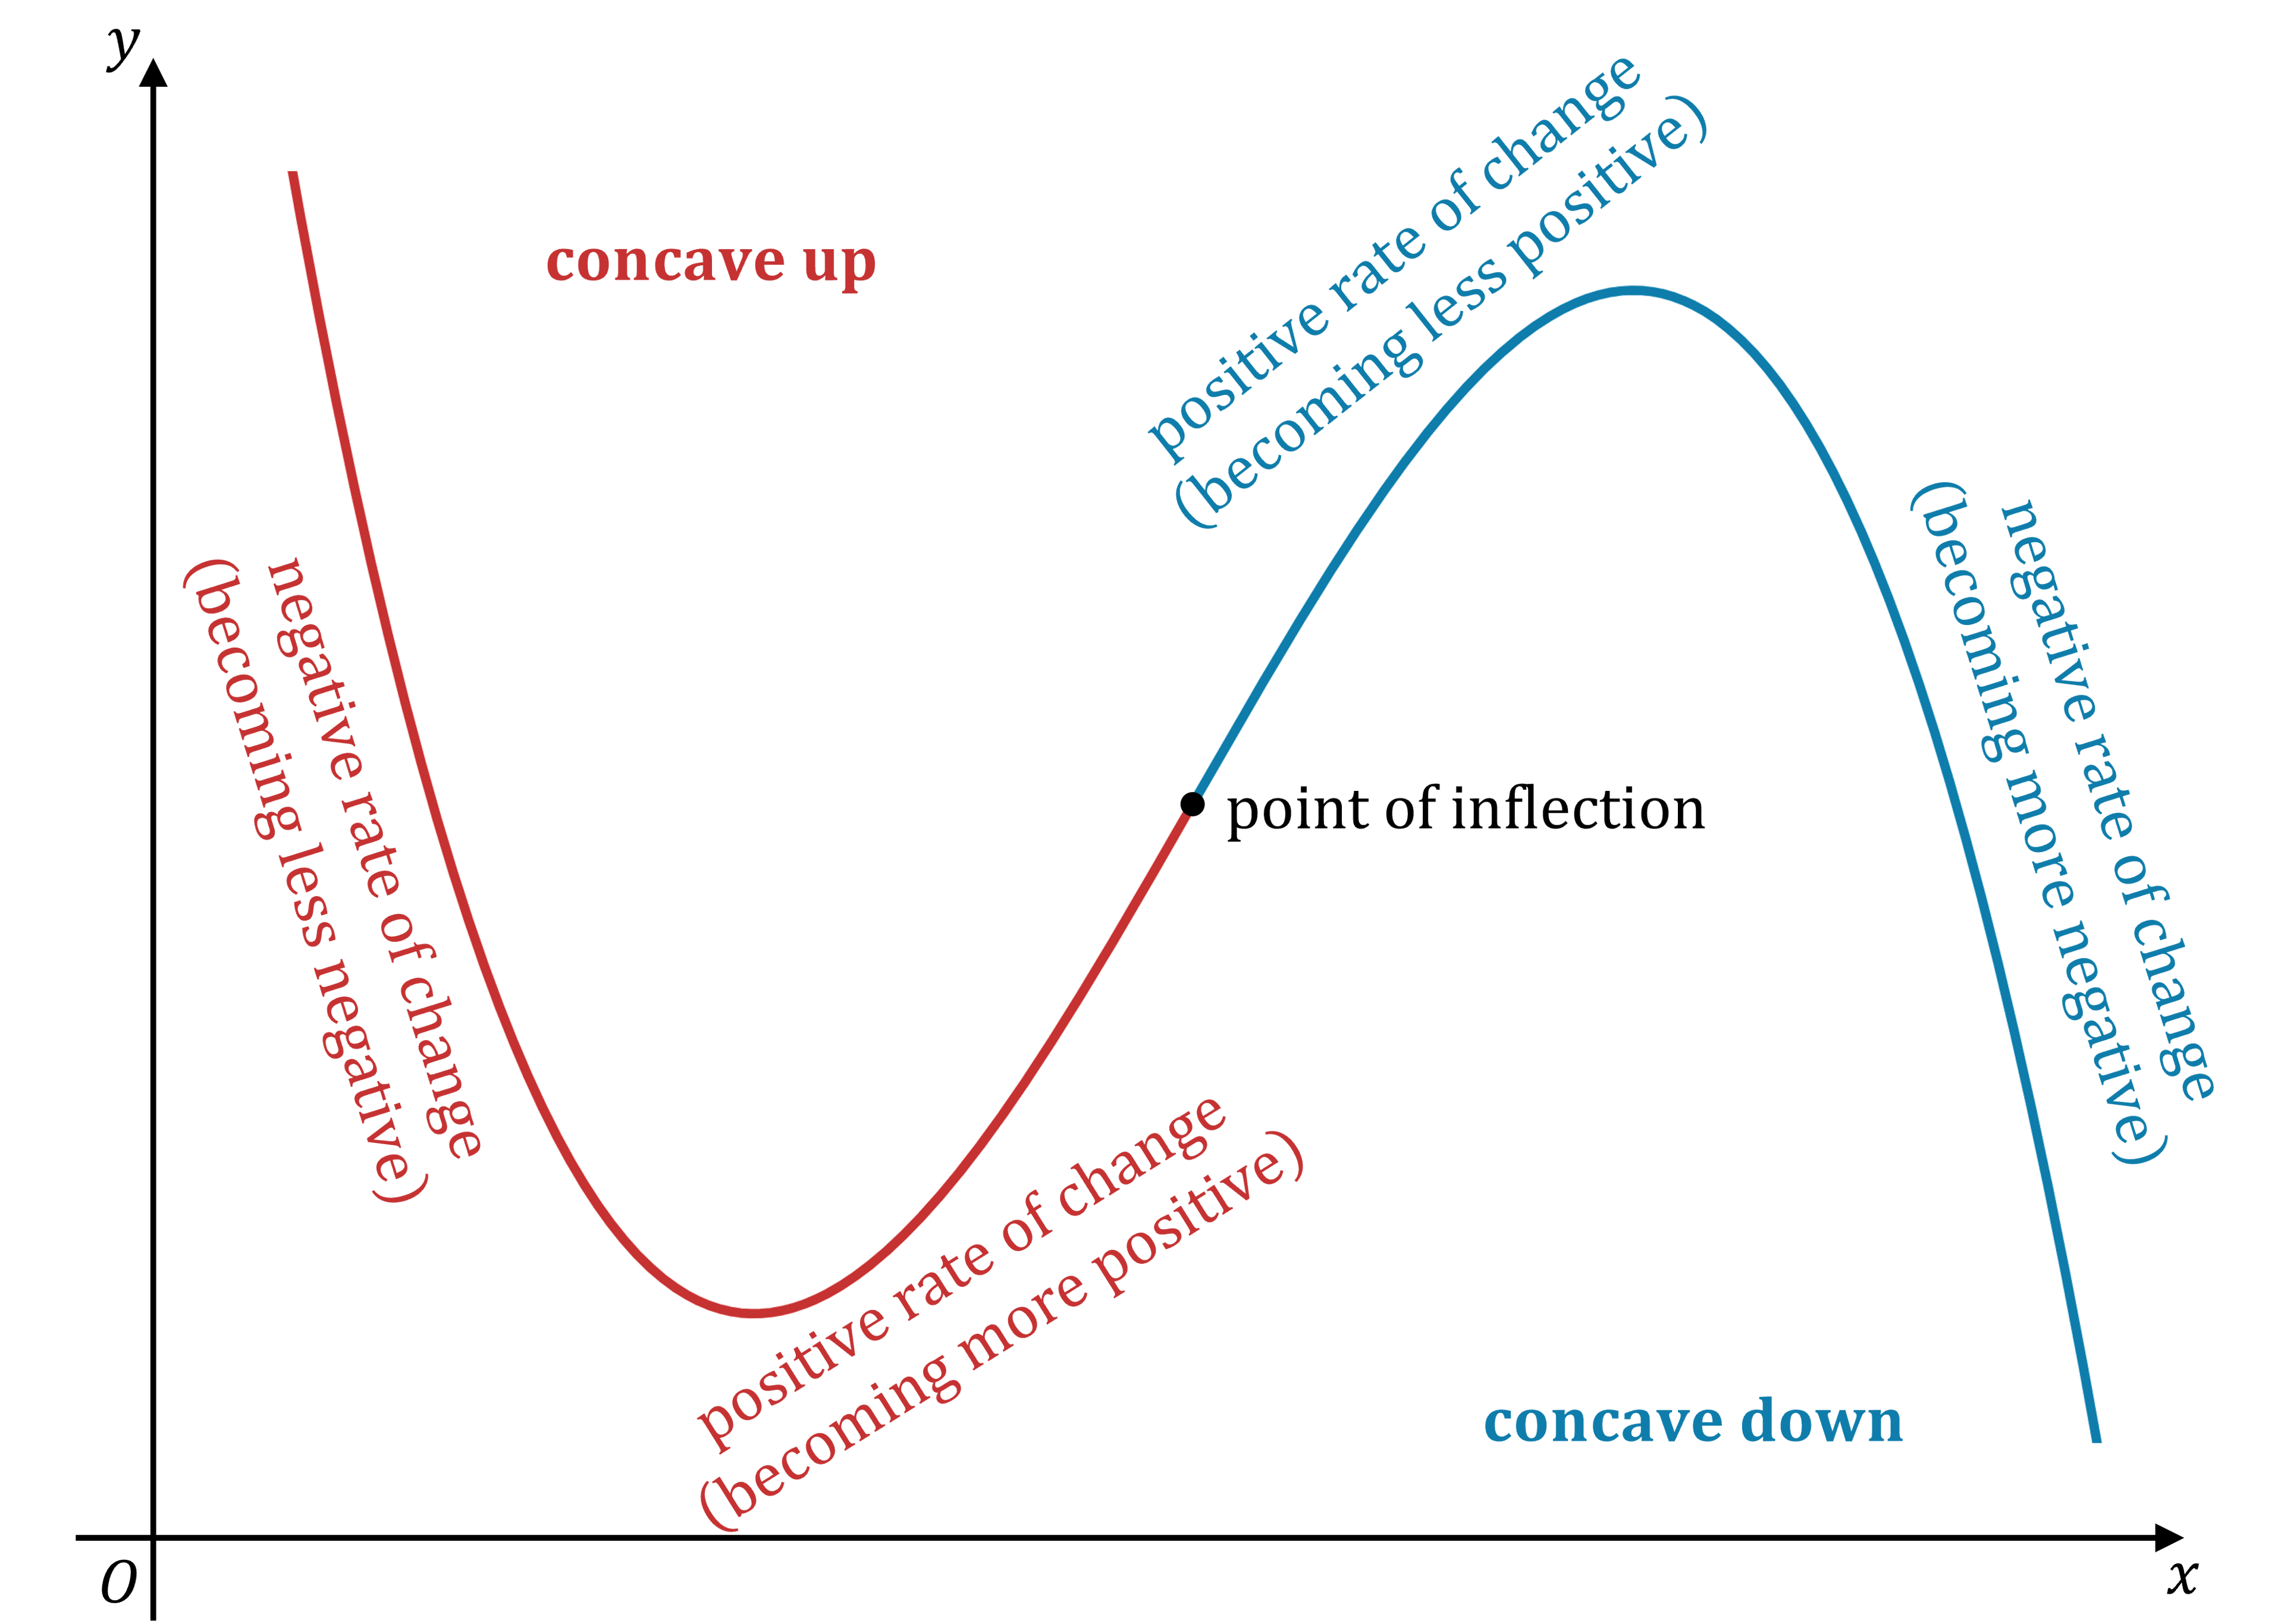
The graph of a function is said to be concave up on an interval where the rate of change is increasing
This may mean that a positive rate of change is becoming more positive
or that a negative rate of change is becoming less negative
A concave up section on a graph is often 'cup' or
format('truetype')%3Bfont-weight%3Anormal%3Bfont-style%3Anormal%3B%7D%3C%2Fstyle%3E%3C%2Fdefs%3E%3Ctext%20font-family%3D%22math1b8002139cdde66b87638f7f91d%22%20font-size%3D%2216%22%20text-anchor%3D%22middle%22%20x%3D%228.5%22%20y%3D%2216%22%3E%26%23x222A%3B%3C%2Ftext%3E%3C%2Fsvg%3E) -shaped
-shaped
What does it mean for the graph of a function to be concave down?
The graph of a function is said to be concave down on an interval where the rate of change is decreasing
This may mean that a positive rate of change is becoming less positive
or that a negative rate of change is becoming more negative
A concave down section on a graph is often 'upside down cup' or
format('truetype')%3Bfont-weight%3Anormal%3Bfont-style%3Anormal%3B%7D%3C%2Fstyle%3E%3C%2Fdefs%3E%3Ctext%20font-family%3D%22math10fd600c953cde8121262e322ef%22%20font-size%3D%2216%22%20text-anchor%3D%22middle%22%20x%3D%228.5%22%20y%3D%2216%22%3E%26%23x2229%3B%3C%2Ftext%3E%3C%2Fsvg%3E) -shaped
-shaped
What is a point of inflection?
A point of inflection is a point where the graph of a function
changes from concave down to concave up
or changes from concave up to concave down
Worked Example
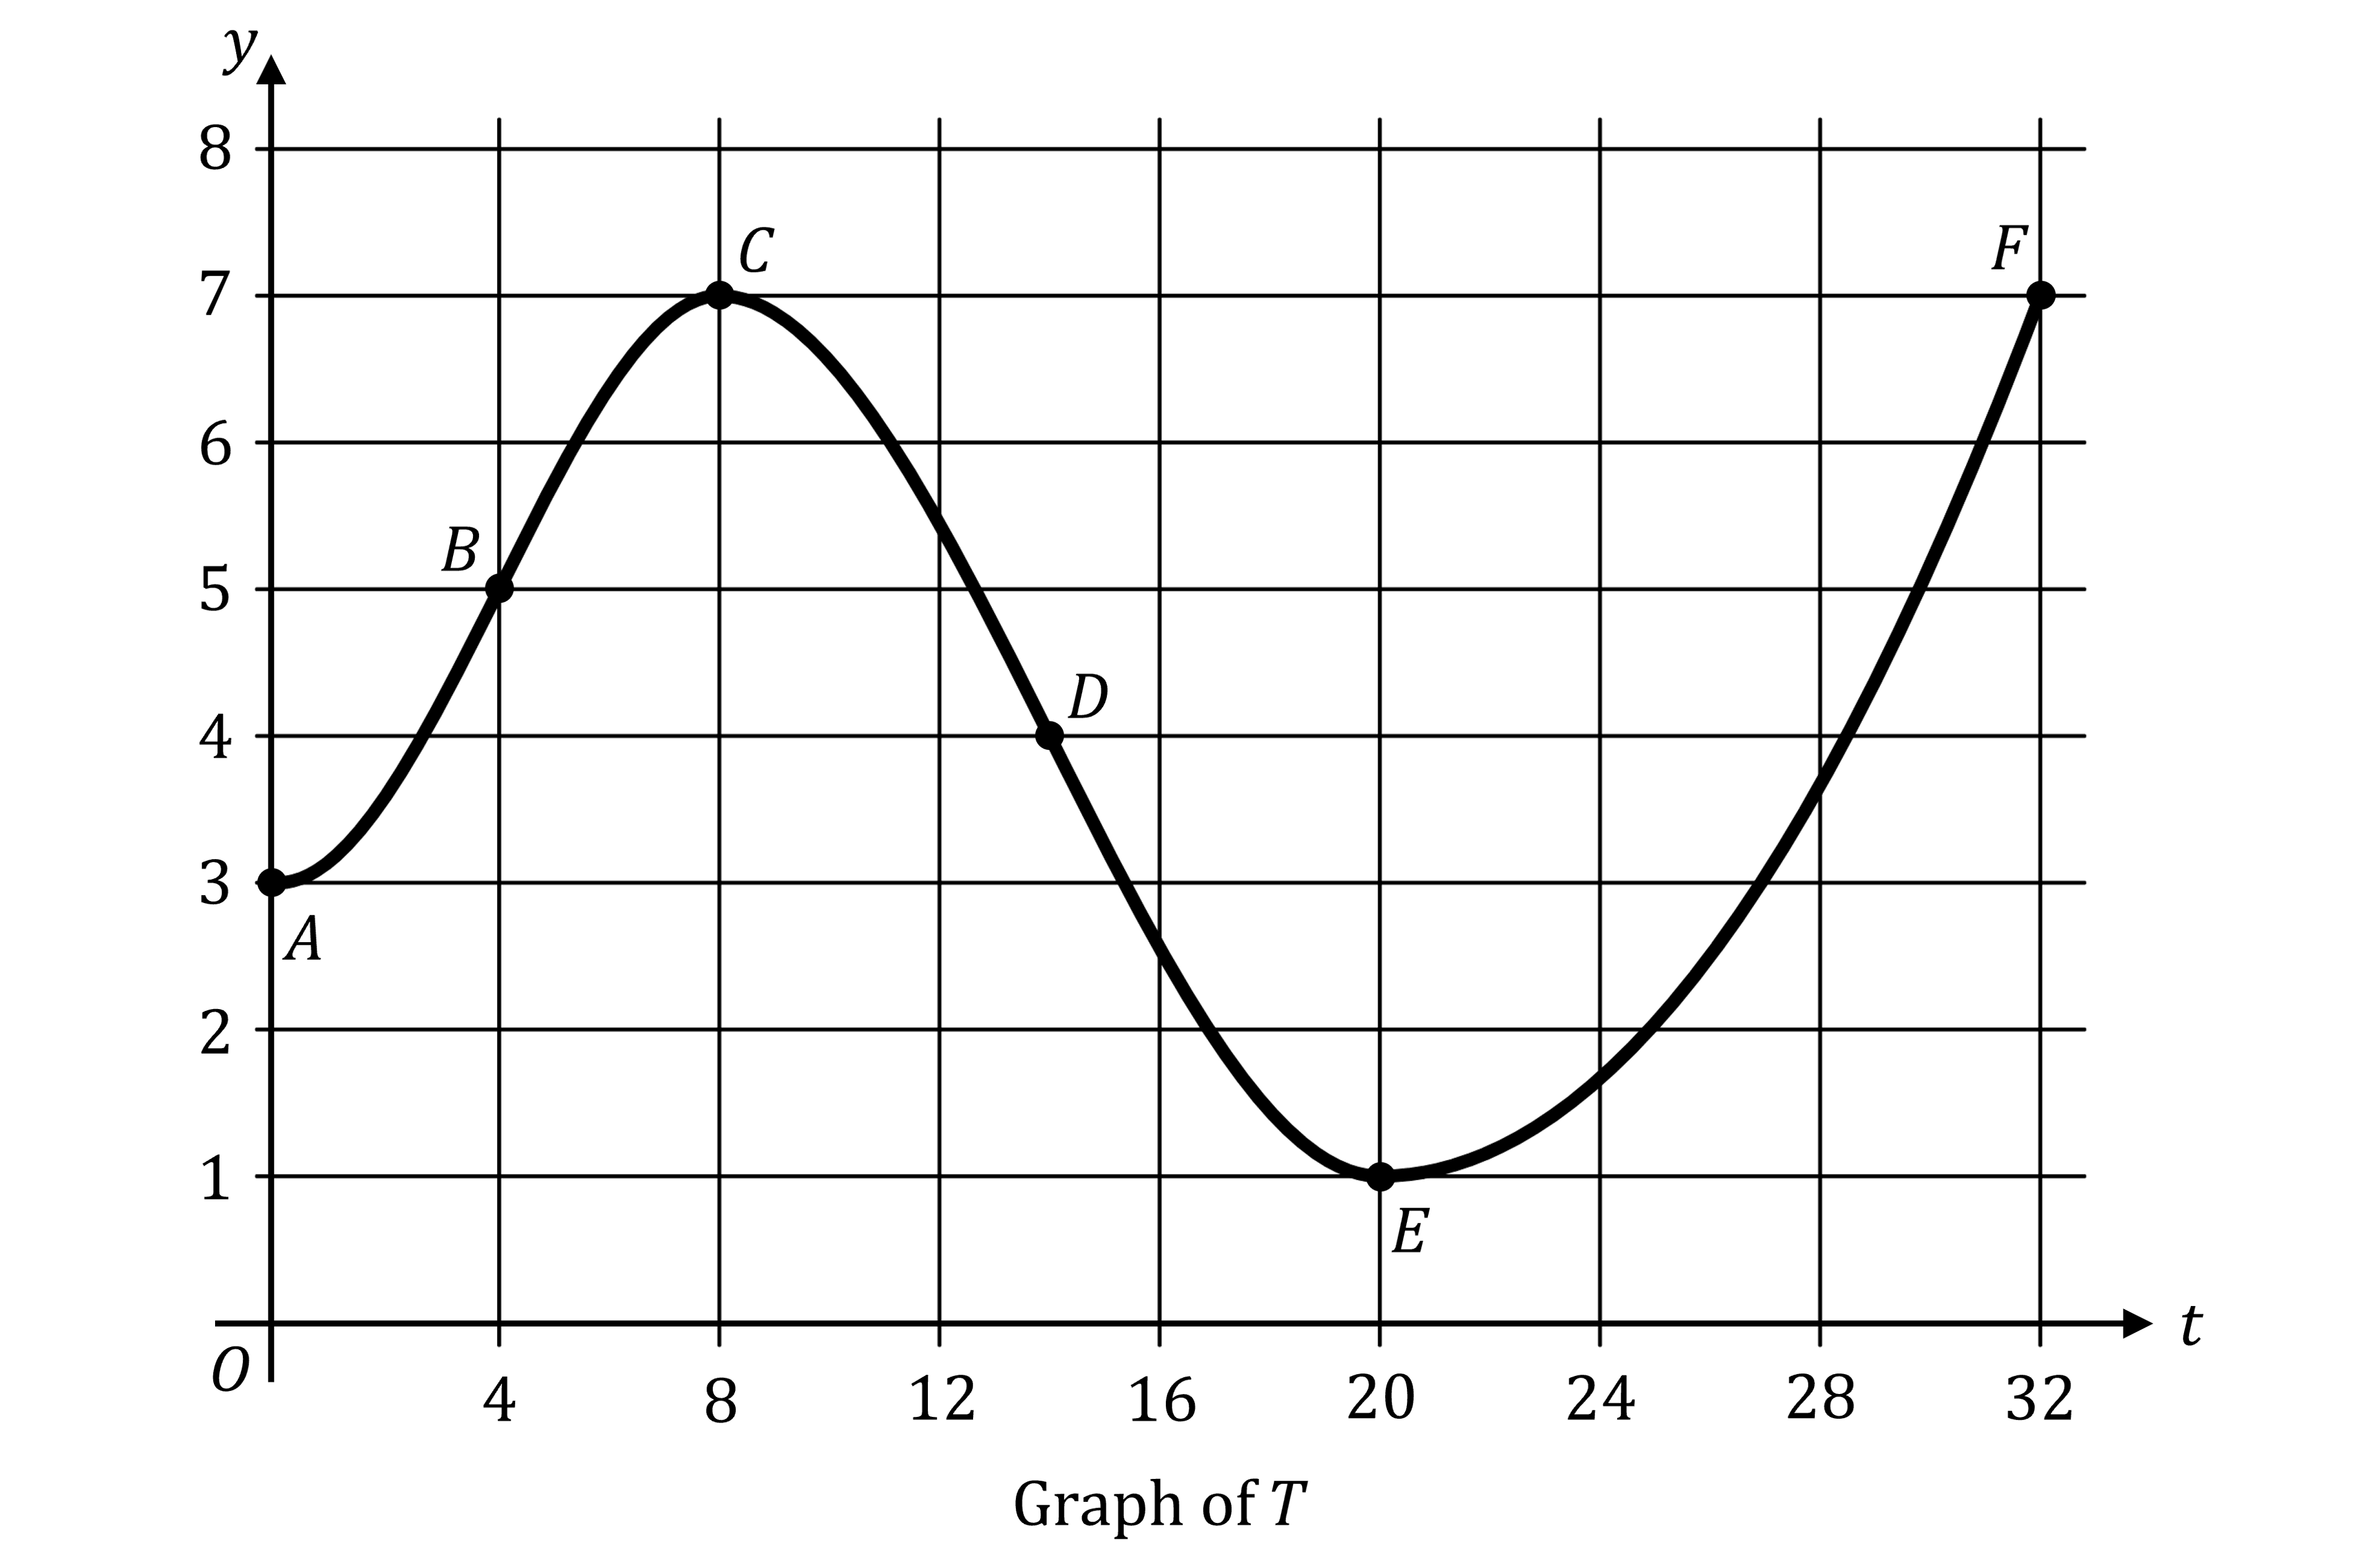
The temperature, in degrees Celsius, at a weather station is modeled by a function ![]() . The graph of
. The graph of ![]() is shown for
is shown for ![]() , where
, where ![]() is the number of hours since midnight.
is the number of hours since midnight.
(a) Of the following, on which interval is ![]() decreasing and the graph of
decreasing and the graph of ![]() concave up?
concave up?
(A) the interval from ![]() to
to ![]()
(B) the interval from ![]() to
to ![]()
(C) the interval from ![]() to
to ![]()
(D) the interval from ![]() to
to ![]()
Answer:
The function is decreasing between ![]() and
and ![]()
and it is concave up between
 and
and 
The only place where both those things are true is between ![]() and
and ![]()
(C) the interval from ![]() to
to ![]()
(b) What are all the intervals on which the temperature is increasing at a decreasing rate?
(A) the interval from ![]() to
to ![]() only
only
(B) the interval from ![]() to
to ![]()
(C) the interval from ![]() to
to ![]() and the interval from
and the interval from ![]() to
to ![]() only
only
(D) the interval from ![]() to
to ![]() and the interval from
and the interval from ![]() to
to ![]()
Answer:
'Increasing at a decreasing rate' means the function is:
increasing
but also concave down (because concave down means the rate of change is decreasing)
The function is increasing on the intervals ![]() and
and ![]()
and it is concave down on the interval
format('truetype')%3Bfont-weight%3Anormal%3Bfont-style%3Anormal%3B%7D%40font-face%7Bfont-family%3A'round_brackets18549f92a457f2409'%3Bsrc%3Aurl(data%3Afont%2Ftruetype%3Bcharset%3Dutf-8%3Bbase64%2CAAEAAAAMAIAAAwBAT1MvMjwHLFQAAADMAAAATmNtYXDf7xCrAAABHAAAADxjdnQgBAkDLgAAAVgAAAASZ2x5ZmAOz2cAAAFsAAABJGhlYWQOKih8AAACkAAAADZoaGVhCvgVwgAAAsgAAAAkaG10eCA6AAIAAALsAAAADGxvY2EAAARLAAAC%2BAAAABBtYXhwBIgEWQAAAwgAAAAgbmFtZXHR30MAAAMoAAACOXBvc3QDogHPAAAFZAAAACBwcmVwupWEAAAABYQAAAAHAAAGcgGQAAUAAAgACAAAAAAACAAIAAAAAAAAAQIAAAAAAAAAAAAAAAAAAAAAAAAAAAAAAAAAAAAAACAgICAAAAAo8AMGe%2F57AAAHPgGyAAAAAAACAAEAAQAAABQAAwABAAAAFAAEACgAAAAGAAQAAQACACgAKf%2F%2FAAAAKAAp%2F%2F%2F%2F2f%2FZAAEAAAAAAAAAAAFUAFYBAAAsAKgDgAAyAAcAAAACAAAAKgDVA1UAAwAHAAA1MxEjEyMRM9XVq4CAKgMr%2FQAC1QABAAD%2B0AIgBtAACQBNGAGwChCwA9SwAxCwAtSwChCwBdSwBRCwANSwAxCwBzywAhCwCDwAsAoQsAPUsAMQsAfUsAoQsAXUsAoQsADUsAMQsAI8sAcQsAg8MTAREAEzABEQASMAAZCQ%2FnABkJD%2BcALQ%2FZD%2BcAGQAnACcAGQ%2FnAAAQAA%2FtACIAbQAAkATRgBsAoQsAPUsAMQsALUsAoQsAXUsAUQsADUsAMQsAc8sAIQsAg8ALAKELAD1LADELAH1LAKELAF1LAKELAA1LADELACPLAHELAIPDEwARABIwAREAEzAAIg%2FnCQAZD%2BcJABkALQ%2FZD%2BcAGQAnACcAGQ%2FnAAAQAAAAEAAPW2NYFfDzz1AAMIAP%2F%2F%2F%2F%2FVre7u%2F%2F%2F%2F%2F9Wt7u4AAP7QA7cG0AAAAAoAAgABAAAAAAABAAAHPv5OAAAXcAAA%2F%2F4DtwABAAAAAAAAAAAAAAAAAAAAAwDVAAACIAAAAiAAAAAAAAAAAAAkAAAAowAAASQAAQAAAAMACgACAAAAAAACAIAEAAAAAAAEAABNAAAAAAAAABUBAgAAAAAAAAABAD4AAAAAAAAAAAACAA4APgAAAAAAAAADAFwATAAAAAAAAAAEAD4AqAAAAAAAAAAFABYA5gAAAAAAAAAGAB8A%2FAAAAAAAAAAIABwBGwABAAAAAAABAD4AAAABAAAAAAACAA4APgABAAAAAAADAFwATAABAAAAAAAEAD4AqAABAAAAAAAFABYA5gABAAAAAAAGAB8A%2FAABAAAAAAAIABwBGwADAAEECQABAD4AAAADAAEECQACAA4APgADAAEECQADAFwATAADAAEECQAEAD4AqAADAAEECQAFABYA5gADAAEECQAGAB8A%2FAADAAEECQAIABwBGwBSAG8AdQBuAGQAIABiAHIAYQBjAGsAZQB0AHMAIAB3AGkAdABoACAAYQBzAGMAZQBuAHQAIAAxADgANQA0AFIAZQBnAHUAbABhAHIATQBhAHQAaABzACAARgBvAHIAIABNAG8AcgBlACAAUgBvAHUAbgBkACAAYgByAGEAYwBrAGUAdABzACAAdwBpAHQAaAAgAGEAcwBjAGUAbgB0ACAAMQA4ADUANABSAG8AdQBuAGQAIABiAHIAYQBjAGsAZQB0AHMAIAB3AGkAdABoACAAYQBzAGMAZQBuAHQAIAAxADgANQA0AFYAZQByAHMAaQBvAG4AIAAyAC4AMFJvdW5kX2JyYWNrZXRzX3dpdGhfYXNjZW50XzE4NTQATQBhAHQAaABzACAARgBvAHIAIABNAG8AcgBlAAAAAAMAAAAAAAADnwHPAAAAAAAAAAAAAAAAAAAAAAAAAAC5B%2F8AAY2FAA%3D%3D)format('truetype')%3Bfont-weight%3Anormal%3Bfont-style%3Anormal%3B%7D%3C%2Fstyle%3E%3C%2Fdefs%3E%3Ctext%20font-family%3D%22round_brackets18549f92a457f2409%22%20font-size%3D%2218%22%20text-anchor%3D%22middle%22%20x%3D%223.5%22%20y%3D%2216%22%3E(%3C%2Ftext%3E%3Ctext%20font-family%3D%22round_brackets18549f92a457f2409%22%20font-size%3D%2218%22%20text-anchor%3D%22middle%22%20x%3D%2244.5%22%20y%3D%2216%22%3E)%3C%2Ftext%3E%3Ctext%20font-family%3D%22Times%20New%20Roman%22%20font-size%3D%2218%22%20text-anchor%3D%22middle%22%20x%3D%2210.5%22%20y%3D%2216%22%3E4%3C%2Ftext%3E%3Ctext%20font-family%3D%22math1f7177163c833dff4b38fc8d287%22%20font-size%3D%2216%22%20text-anchor%3D%22middle%22%20x%3D%2217.5%22%20y%3D%2216%22%3E%2C%3C%2Ftext%3E%3Ctext%20font-family%3D%22Times%20New%20Roman%22%20font-size%3D%2218%22%20text-anchor%3D%22middle%22%20x%3D%2233.5%22%20y%3D%2216%22%3E14%3C%2Ftext%3E%3C%2Fsvg%3E)
But it is only increasing and concave down on ![]()
(A) the interval from ![]() to
to ![]() only
only

Unlock more, it's free!
Join the 100,000+ Students that ❤️ Save My Exams
the (exam) results speak for themselves:

Was this revision note helpful?
