Electromagnetic Induction (Edexcel IGCSE Science (Double Award) (Modular): Physics Unit 2): Exam Questions

Exam code: 4XSD1

32 mins5 questions
1
4 marks

The diagram shows an electric motor and the direction of current.

A three-dimensional diagram of an electric motor. Two flat rectangular blocks, each labelled magnet, face each other across a gap; neither block is marked with a pole. A rectangular wire loop labelled coil sits in the gap with its long sides running between the two magnets. The lower ends of the loop connect to a split-ring commutator drawn as a short cylinder, which has one contact extending to the left and another to the right. An arrow on the left contact points right, towards the commutator, and an arrow on the right contact points right, away from it. The label current sits below the left-hand arrow.

Explain how the current produces movement of the coil.

2a
3 marks

Photograph E shows a rechargeable torch.

Photograph E, a greyscale photograph of a rechargeable shake torch lying at an angle with the lens at the lower left and a wrist strap at the upper right. Label lines point to three parts: battery, inside the clear plastic body towards the lens end; coil, a band around the body just past the middle; and magnet, inside the clear tube at the strap end. The caption below the photograph reads Photograph E.

When a student shakes the torch, the magnet moves through the coil and back again.

This induces a voltage across the ends of the coil.

The voltage is used to provide current to recharge the battery.

Line diagram of a coil of wire drawn as about ten turns, labelled coil by a line to its upper left. A bar magnet, labelled magnet, lies horizontally to the right of the coil with its left end inside the right-hand turns of the coil; the magnet is marked N at its left end and S at its right end. A second, greyed dashed outline of the same magnet is drawn to the left of the coil, also marked N at its left end and S at its right end, showing the magnet's other position. A double-headed arrow between the two positions points both left and right across the left-hand turns of the coil, showing the magnet moving in and out along the axis of the coil.

(i) Explain why a voltage is induced.

[2]

(ii) State one way to increase this voltage.

[1]

2b
2 marks

Photograph F shows the components inside the torch.

Photograph F, a greyscale photograph of the components taken out of the torch, lying at an angle. Label lines point to four parts: LED, a small bulb at the lower left end; battery, in the clear plastic housing next to the LED; coil, a band wound around the clear tube in the middle; and magnet, a cylinder inside the tube at the upper right end. The caption below the photograph reads Photograph F.

The torch uses a light-emitting diode (LED) to provide light.

The manufacturer of the torch states that

"An LED is a more efficient source of light than a filament lamp."

Explain this statement in terms of energy transfer.

3a
5 marks

A student investigates how to produce a voltage. He hangs a magnet from a spring, above a coil that is connected to a data logger.

A spring hangs from a fixed point at the top, with a bar magnet suspended from its lower end. The magnet is labelled N at its top end and S at its bottom end, and carries the label magnet. Directly below the magnet is a horizontal coil of wire, labelled coil, connected by a twisted pair of wires to a rectangular box with a small display, labelled data logger. A double-headed vertical arrow runs through the centre of the coil, pointing both up and down. Below the coil, a dashed rectangle the same size and shape as the magnet is labelled X.

The student pulls the magnet through the coil to X and then releases it. The magnet moves up and down through the coil. The data logger produces this graph of voltage against time.

A graph of voltage against time. The vertical axis is labelled voltage in mV and is scaled from minus 1.5 to 1.5 in steps of 0.5. The horizontal axis is labelled time and carries gridlines but no numbers. A solid curve starts at zero and oscillates above and below the time axis, crossing it repeatedly. Successive peaks fall from about 0.95 mV to 0.80 mV, then 0.65 mV, then 0.52 mV, and successive troughs rise from about minus 0.88 mV to minus 0.73 mV, then minus 0.60 mV, so the oscillation keeps roughly the same spacing but steadily decreases in amplitude.

(i) Explain why the data logger records a varying voltage.

[2]

(ii) Which feature of the graph shows that the voltage is alternating?

[1]

(iii) Suggest why the voltage changes as shown by the graph.

[2]

3b
3 marks

The student repeats the experiment using two magnets taped together.

Compared to one magnet, these two magnets take a longer time to move up and down. The dotted line on the grid shows the original graph for one magnet.

On the same grid, sketch the graph that would be produced using two magnets.
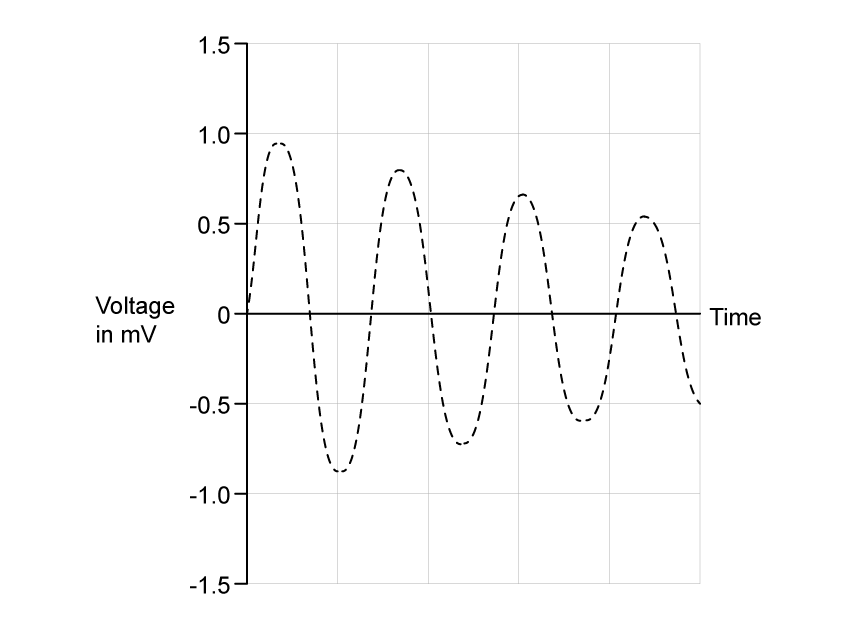
A grid for sketching. The vertical axis is labelled voltage in mV and is scaled from minus 1.5 to 1.5 in steps of 0.5. The horizontal axis is labelled time and carries gridlines but no numbers. A grey dotted curve shows the original graph for one magnet: it starts at zero and oscillates above and below the time axis, with peaks falling from about 0.95 mV to 0.80 mV, then 0.65 mV, then 0.52 mV, and troughs rising from about minus 0.88 mV to minus 0.73 mV, then minus 0.60 mV.
4a
4 marks

The diagram shows a magnet held above a coil. The coil is connected to a voltmeter.

A vertical bar magnet held above an upright cylindrical coil of wire. The magnet is labelled magnet, with S at its upper end and N at its lower end, which faces the coil. The coil is wound with many turns of wire. Both ends of the coil are joined by wires to a meter drawn as a circle labelled mV, forming a closed circuit. No arrows or distances are marked.

The magnet is released and falls into the coil.

(i) Explain why the voltmeter shows a reading.

[2]

(ii) The magnet is released from a greater height. How does this affect the voltmeter? Explain your answer.

[2]

4b
3 marks

State how the voltmeter reading changes when the same magnet

(i) moves more slowly into the coil.

[1]

(ii) moves into a coil with more turns.

[1]

(iii) is reversed so the S-pole enters the coil first.

[1]

5a
2 marks

A student uses this apparatus to investigate electromagnetic induction.

A bar magnet held vertically above a flat coil of wire. The upper end of the magnet is labelled N and the lower end is labelled S. A vertical arrow beside the magnet points downwards, towards the coil. The coil is drawn as a stack of five horizontal loops and is labelled "coil of wire". Two wires run from the coil to a circular meter on the right, labelled "sensitive ammeter". Its scale reads 3, 2, 1, 0, 1, 2, 3 from left to right and the needle points straight up at 0. The left terminal below the dial is marked with a plus sign and the right terminal is marked with a minus sign.

When the S pole of the magnet is moved into the coil, the pointer on the sensitive ammeter moves to the left.

Describe two ways that the student can make the pointer move to the right.

5b
6 marks

The student has a bicycle with a dynamo (generator) that supplies electricity for its lights. The diagram shows the dynamo. The friction wheel, W, presses against the bicycle tyre. When the student pedals, the friction wheel turns and causes part Y to rotate.

On the left, a table headed Key with four rows. The row labelled W reads "friction wheel", the row labelled X reads "axle", and the rows labelled Y and Z are both blank. On the right, a cut-away diagram of the dynamo. A small wheel at the far left is labelled W. A horizontal shaft running to the right from that wheel is labelled X. Inside the casing, a large shaded cylinder mounted on the shaft is labelled Y, and a densely wound helical winding immediately to its right is labelled Z. A plain grey block sits above them and another below them. The outer casing is labelled "metal casing". Two terminals on the right of the casing are connected by wires to a lamp, drawn as a circle with a cross inside it.

(i) Complete the key for the diagram by giving the names of parts Y and Z.

[2]

(ii) The graph shows how the output voltage of the dynamo varies with time as the student pedals steadily.
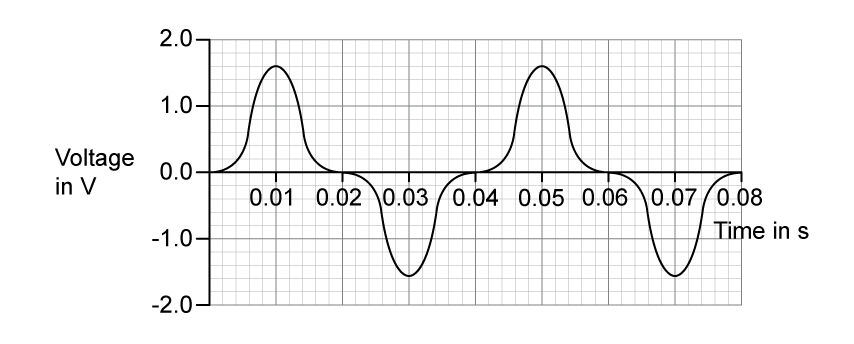
A graph of voltage against time drawn on a fine grid. The vertical axis is labelled "voltage in V" and is marked from minus 2.0 to 2.0 in steps of 1.0. The horizontal axis is labelled "time in s" and is marked from 0.01 to 0.08 in steps of 0.01. The curve starts at zero, rises to a peak of 1.6 V at 0.01 s, returns to zero, falls to a trough of minus 1.6 V at 0.03 s and returns to zero. The same pattern then repeats, with a peak at 0.05 s and a trough at 0.07 s.

State the maximum output voltage of the dynamo.

[1]

Maximum output voltage = ........................... V

(iii) Calculate the frequency of the output voltage.

[2]

Frequency = ........................ Hz

(iv) Apart from changing the speed of the friction wheel, suggest how the output voltage of the dynamo can be increased.

[1]