Muscular Movement (Edexcel International A Level (IAL) Biology): Exam Questions

Exam code: YBI11

2 hours13 questions
1a
3 marks

Many athletes train to improve muscle strength.

In an experiment, the effect on a muscle of 12 weeks of low or moderate training was investigated.

The graphs show the effect of 12 weeks of training on muscle strength and muscle cross-sectional area. 

q2-unit-5-january-2021-edexcel-ial-biology

The muscle strength of the athlete before moderate training was 12.5 a.u.

Calculate the muscle strength of the athlete after 12 weeks of moderate training.

Give your answer to 3 significant figures.

1b
6 marks

The types of muscle fibre present in samples taken before the training and after 12 weeks of low and moderate training were determined.

Fibre type

Percentage of fibres (%)

Before training

After 12 weeks of training

Low

Moderate

  Slow twitch

44

44

44

  Fast twitch

6

2

1

  Intermediate

50

54

55

Intermediate fibres have structural properties between those of slow and fast twitch fibres.

(i) Describe how the structure of an intermediate fibre will differ from the structure of a slow twitch fibre.

(3)

(ii) Comment on the effect of exercise on this muscle.

Use the information in the graphs and the table to support your answer.

(3)

2a
2 marks

A student used a spirometer to investigate the effect of exercise on the breathing of a healthy, 18-year-old, male participant. The spirometer chamber contained soda lime throughout the investigation.

  • The participant rested for 5 minutes, after which a 60-second spirometer trace was recorded

  • The participant then completed 5 minutes of moderate-intensity cycling on a stationary bicycle

  • Immediately after exercise, a second 60-second spirometer trace was recorded

The student identified soda lime as a hazard in their risk assessment.

State the risk associated with this hazard and describe one precaution the student should take.

2b
2 marks

A second student suggested removing the soda lime from the spirometer chamber.

Explain why removing the soda lime would make it impossible to calculate oxygen consumption from the spirometer trace alone.

2c
2 marks

The participant rested for 5 minutes before the first spirometer trace was recorded.

Explain why this was necessary.

2d
2 marks

The following data was extracted from the traces:

Measurement

Resting trace

Exercise trace

Number of breaths in 60 seconds

12

22

Mean tidal volume / dm³

0.5

1.8

Volume of gas in spirometer chamber at start of trace / dm³

5.8

6.2

Volume of gas in spirometer chamber at end of trace / dm³

5.5

3.5

Calculate the respiratory minute ventilation for the participant during exercise. Give your answer to two significant figures.

2e
3 marks

Calculate the rate of oxygen consumption during exercise in cm³ s⁻¹. Give your answer in standard form.

2f
3 marks

Evaluate the validity of the experimental method used in this investigation.

3
4 marks

Skeletal muscles function to move the limbs of an organism.

The diagram represents a sarcomere from skeletal muscle.

q4a-unit-5-january-2021-edexcel-ial-biology

(i) Which protein forms the structure labelled X?

(1)

☐

A

Actin

☐

B

Myosin

☐

C

Tropomyosin

☐

D

Troponin

(II) Which part becomes shorter when the muscle contracts?

(1)

☐ A W

☐ B X

☐ C Y

☐ D Z

(iii) How many of the following statements are correct when a sarcomere contracts?

  • Calcium ions bind to troponin

  • Calcium ions are released from the sarcoplasmic reticulum

  • Myosin changes shape

(1)

☐ A None

☐ B One

☐ C Two

☐ D Three

(iv) Which molecule contains an enzyme that hydrolyses ATP?

(1)

☐ A Actin

☐ B Myosin

☐ C Tropomyosin

☐ D Troponin

4a
3 marks

Exercise affects the cardiac output of a person.

The graph shows the change in heart rate following exercise for an unfit person and for a fit person.

q6-unit-5-january-2021-edexcel-ial-biology

The heart rate of the unfit person decreased by 16%, 120 seconds after exercise.

Calculate the difference in percentage decrease in heart rate of these two people, 120 seconds after exercise.

Give your answer to an appropriate number of decimal places.

4b
3 marks

Calculate the heart rate of the unfit person at 5 minutes.

The change in heart rate of the unfit person is a linear relationship.

Use the equation for a straight line y = mx + c.

4c
3 marks

Explain the difference in the time it would take for these two individuals to recover from the exercise.

4d
4 marks

Describe how heart rate is controlled in response to changes in the blood, following exercise.

5a
2 marks

Many people swim as part of their regular exercise.

The table gives some information about the effect of the intensity of exercise on heart rat

Intensity of exercise / a.u.

Heart rate / bpm

4

118

6

120

8

138

10

150

12

155

14

160

Describe the relationship between the intensity of exercise and heart rate.

5b
3 marks

Regular swimming affects resting heart rate and cardiac output.

cardiac output = stroke volume × heart rate

The table shows the mean resting cardiac output and mean resting stroke volume for a group of regular swimmers and a control group.

Group

Mean resting cardiac output / dm3 min–1

Mean resting stroke volume / cm3

Regular swimmers

4.43

74.40

Control

4.21

58.40

Using the data in the table, calculate the difference in resting heart rate between these two groups.

Give your answer to 2 decimal places with appropriate units.

5c
6 marks

Explain the role of the heart in responding to regular exercise.

Use the information in both tables and your own knowledge to support your answer.

6a
3 marks

Researchers investigated how groups of rats, treated with drugs, responded to stress.

Groups of rats were stressed by moving them into a new environment. The rats were then treated with a salt solution, drug A or drug B.

Group

Treatment

1

Salt solution

2

Drug A

3

Drug B

The graph shows the change in mean heart rate measured over a 15‐minute period.

q7-unit-5-oct-2021-edexcel-ial-biology

Calculate the percentage difference in the change in heart rate when using drug B between 5 and 12.5 minutes.

Answer ...................................................%

6b
3 marks

Compare and contrast the effects of drug A and drug B on the heart rate during the investigation.

6c
3 marks

Explain the effect of these drugs on the control of the heart rate.

7a
2 marks

Skeletal muscle is made of bundles of fibres.

Describe the role of calcium ions in producing contraction of a muscle fibre.

7b
4 marks

The table shows some features of slow and fast twitch muscle fibres.

Feature of fibre

Slow twitch fibre

Fast twitch fibre

Number of mitochondria per fibre

Many

Few

Number of myoglobin molecules per fibre

Many

Few

Capillary network

Larger

Smaller

Contraction

Slow and sustained

Rapid and intense

Olympic marathon runners have a high proportion of slow twitch fibres in their muscles.

Explain how the features of slow twitch fibres, shown in the table, are of benefit to an Olympic marathon runner.

7c
2 marks

The graph shows the rate of heat loss at rest and during exercise.

q1c-unit-5-oct-2021-edexcel-ial-biology

Comment on the rate of heat loss during exercise.

8a
2 marks

In humans the sinoatrial node, atrioventricular node and bundle of His are involved in regulation and coordination of the cardiac cycle.

The diagram shows a human heart.

q6a-unit-5-june-2021-edexcel-ial-biology

(i) Which one of the following statements is correct?

(1)

☐

A

Q is the sinoatrial node (SAN) and R is the atrioventricular node (AVN)

☐

B

Q is the sinoatrial node (SAN) and P is the atrioventricular node (AVN) 

☐

C

Q is the bundle of His and R is the sinoatrial node (SAN) 

☐

D

R is the sinoatrial node (SAN) and P is the Purkinje fibres 

(ii) The electrical impulse that initiates the cardiac cycle begins without the need for a nerve impulses.

What is the term for this process?

(1)

☐ A diastole

☐ B myogenic 

☐ C polarisation 

☐ D systole 

8b
8 marks

A football player undertook regular exercise as part of a training programme.

During exercise there is a change in the duration of the cardiac cycle.

(i) Explain why there is a change in the cardiac cycle during this exercise.

(3)

(ii) The table shows the effect of the training programme on the cardiac output and resting heart rate of this football player.

When measurements were made

Cardiac output / cm3 min-1

Resting heart rate / bpm

Before training

4500

72

After training

4500

51

Calculate the stroke volume of this football player, after training.

(1)

(iii) After training, the footballer had an ECG.

This ECG trace is shown in the diagram.

q6biii-unit-5-june-2021-edexcel-ial-biology

Calculate the heart rate of the footballer using the ECG in this diagram.

(1)

(iv) Two hours later a second ECG was recorded.

q6biv-unit-5-june-2021-edexcel-ial

Comment on the changes that have occurred in the activity of the heart as shown in these two ECG traces.

(3)

9a
2 marks

Muscles, bones and joints enable movement of the skeleton.

(i) Which structure attaches one bone to another bone at a flexible joint?

(1)

☐

A

Actin

☐

B

Ligament 

☐

C

Synapse 

☐

D

Tendon 

(ii) How many of the statements about joints are correct?

(1)

  • Antagonistic pairs of muscles move the bones at a joint

  • Muscles acting on a joint are myogenic

  • Tendons are more elastic than ligaments 

☐

A

0

☐

B

1 

☐

C

2 

☐

D

3 

9b
4 marks

The athlete Usain Bolt’s world record of 9.58 seconds for the 100m men’s sprint is unbeaten.

usain-bolt-16082009-berlin

Erik van Leeuwen (GFDL <http://www.gnu.org/copyleft/fdl.html> or GFDL <http://www.gnu.org/copyleft/fdl.html>), via Wikimedia Commons

(i) What is the role of myoglobin in muscle fibres?

(1)

☐

A

It is an enzyme that reacts with myosin

☐

B

It is part of the sarcolemma involved in the release of calcium ions 

☐

C

To act as an immediate source of energy 

☐

D

To provide oxygen for muscles 

(ii) Explain why the muscles of a sprinter have a high percentage of fast twitch fibres.

(3)

9c
3 marks

In an investigation, an athlete ran for 10 minutes on a running machine moving at constant speed.

The investigation was repeated at seven running speeds.

At each speed, the heart rate and lactate concentration in the blood of the athlete were measured.

The results are shown in the graph.

q2c-unit-5-january-2022-edexcel-ial-biology

Comment on the results of this investigation.

10a
3 marks

Alpha‐1 antitrypsin (AAT) deficiency is an inherited disease that can affect different organ systems.

Alpha‐1 antitrypsin (AAT) is a protein produced in the liver.

Investigation of the breathing of a patient with AAT deficiency found that the:

  • Resting tidal volume (VT) was 500 cm3

  • Dead space (DS) was 150 cm3

  • Resting respiratory rate (RR) was 12 breaths per minute.

Calculate the volume of air that enters the alveoli (AV) each hour.

AV = (VT – DS)×RR

Give your answer to 2 significant figures with appropriate units.

10b
5 marks

Activity of the heart was investigated in the same patient.

The trace shows a normal electrocardiogram (ECG).

q7b-unit-5-january-2022-edexcel-ial-biology

(i)Name the stage of the cardiac cycle at T on this ECG.

(1)

(ii) The ECG of the patient with AAT is shown in the trace.

q7bii-unit-5-january-2022-edexcel-ial-biology

Calculate the mean heart rate shown in this ECG trace.

(1)

(iii) Compare and contrast the ECG trace of this patient with the normal ECG trace.

(3)

10c
4 marks

One potential treatment for AAT deficiency uses adenoviruses to genetically modify cells in an affected person.

Adenoviruses contain double‐stranded DNA.

Explain how adenoviruses can be used to treat AAT deficiency in a person.

11a
1 mark

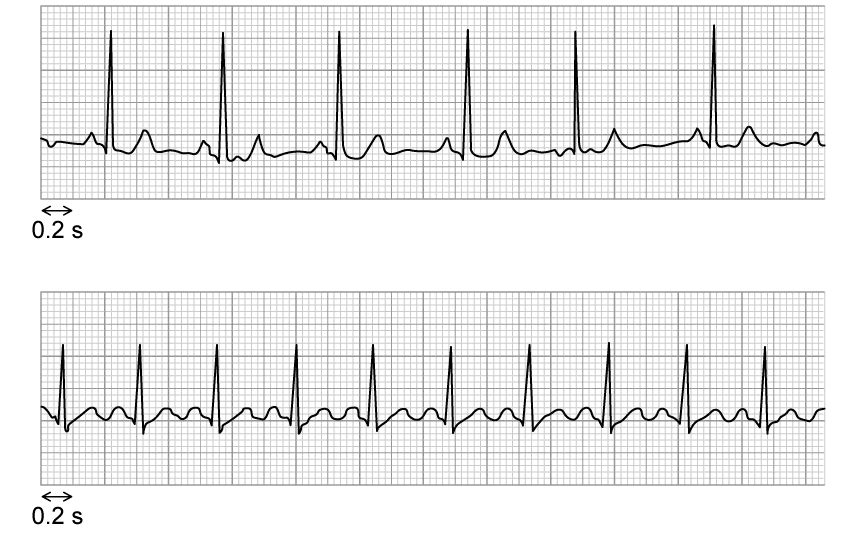
The diagram shows a pair of electrocardiogram (ECG) traces.

Two ECG strips showing heart rhythms are displayed on a grid. Both strips include repeated peaks and waves representing cardiac activity.

Which of the following statements about the ECG traces is correct?

  • trace 1 shows a mean heart rate of approximately 72 beats per minute

  • trace 2 shows a regular cardiac cycle

  • the duration of one cardiac cycle is shorter in trace 1 than in trace 2

  • trace 1 shows an abnormal heart rhythm

11b
3 marks

Describe how the electrical activity of the heart coordinates the heartbeat.

11c
2 marks

Scientists investigated the cardiovascular fitness of Sherpa highlanders living at high altitude (4200 m) and lowland controls living at sea level. The scientists recruited Sherpa highlanders who regularly undertake intense physical activity at altitude, including farming and trekking, and lowland controls with similar activity levels at sea level.

The table shows the resting cardiovascular data for the two groups.

Measurement

Sherpa highlanders (n = 18)

Lowland controls (n = 22)

Mean resting heart rate (beats min⁻¹)

58

72

Mean stroke volume (cm³)

92

68

Calculate the percentage difference in cardiac output between the Sherpa highlanders and the lowland controls.

Use the equation:

percentage difference = difference between two valuesmean of the two values × 100

11d
3 marks

At high altitude, the partial pressure of oxygen is lower, so less oxygen is available per breath.

A student concludes that the increased stroke volume of the Sherpa highlanders accounts for their increased ability to undertake intense exercise at high altitude.

Evaluate this conclusion.

12a
2 marks

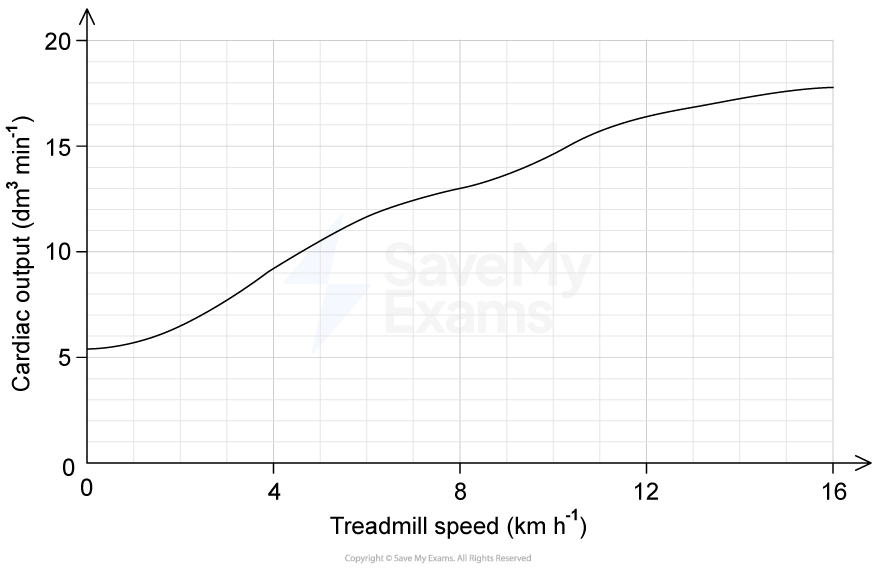
A researcher monitored the cardiac output of the patient while walking and running on a treadmill at increasing speeds. The results are shown in the graph.

Graph of cardiac output vs treadmill speed, showing a steady increase from 5 to 20 dm³ min⁻¹ as speed increases from 0 to 16 km h⁻¹.

The patient's resting stroke volume is 75 cm³.

Using Figure 2, calculate the patient's resting heart rate in beats min⁻¹.

Use the equation:

cardiac output = heart rate × stroke volume

12b
1 mark

Calculate the percentage increase in cardiac output between rest and 8 km h⁻¹.

13a
2 marks

Whales are large mammals.

The photograph shows a humpback whale and a human diver.

humpback-whale

NOAA's National Ocean Service, CC BY 2.0 <https://creativecommons.org/licenses/by/2.0>, via Wikimedia Commons

(i) A humpback whale can become habituated to human divers.

How many of the following statements about habituation are correct?

(1)

  • Habituation is an example of anatomical adaptation

  • Habituation is only observed in mammals

  • Habituation only occurs after repeated exposure to the same stimulus

☐

A

0

☐

B

1 

☐

C

2 

☐

D

3 

(ii) A humpback whale can respond to a stimulus using a spinal reflex arc.

Which row is correct?

(1)

Location of relay neurone

Location of cell body on the sensory neurone

☐ A

 grey matter of spinal cord

 at the end of the axon

☐ B

 grey matter of spinal cord 

 in the middle of the axon

☐ C

 white matter of spinal cord 

 at the end of the axon

☐ D

 white matter of spinal cord 

 in the middle of the axon

13b
6 marks

The heart rate of a whale changes when it is diving.

The graph shows the changes in heart rate that occur during dives of different durations.

The maximum heart rate at the surface is when the whale returns to the surface after a dive.

q3b-unit-5-january-2022-edexcel-ial-biology

(i) Comment on the changes in heart rate of the whale when it is diving.

(3)

(ii) Explain how the changes in heart rate are controlled when the whale returns to the surface immediately after the dive.

(3)