1a2 marks
Given
x = et and y=2t3 + 3t
find and
1b2 marks
Hence, or otherwise, find in terms of t.
Was this exam question helpful?
Exam code: YMA01
Given
x = et and y=2t3 + 3t
find and
Hence, or otherwise, find in terms of t.
Was this exam question helpful?
Find the Cartesian equation of the curve C, defined by the parametric equations
x = t-1 and y = 2 ln t
(i) Find in terms of x.
(ii) Find the gradient of C at the point where t = 1.
Hence find the equation of the tangent to C at the point where t = 1.
Was this exam question helpful?
A sketch of the graph defined by the parametric equations
x = 8t and y=t2+1
is shown below.

The point where t = t1 has x-coordinate 8.
The point where t = t2 has x-coordinate 16.
Find the values of t1 and t2.
(i) Show that the shaded area can be found using the integral
(ii) Hence find the shaded area.
Was this exam question helpful?
A particle travels along a path defined by the parametric equations
x = 6t and y=8t2-8t + 3, 0 ≤ t ≤ 1,
where (x ,y) are the coordinates of the particle at time t seconds.
Find the coordinates of the particle after 0.2 seconds.
(i) Find and .
(ii) Hence find in terms of t.
Find the coordinates of the particle when it is at its minimum point.
Was this exam question helpful?
The graph of the curve C shown below is defined by the parametric equations
x = 5 sin and y =

Find the exact coordinates of point A.
(i) Write down the value of at the origin.
(ii) Write down the value of at the points where x = -5 and x = 5.
(i) Find and
(ii) Hence find in terms of .
(iii) Find the gradient at the point where
Was this exam question helpful?
The curve C has parametric equations
x = 5t2-1 and y = 3t, t>0.
(i) Find and
(ii) Hence find in terms of t.
(i) Find the gradient of the tangent to C at the point (4,3).
(ii) Hence find the equation of the tangent to C at the point (4,3).
Was this exam question helpful?
The curve C has parametric equations
x = 2t3 and y = 4t -1, t>0.
(i) Find and
(ii) Hence find in terms of t.
(i) Find the gradient of the tangent to C at the point (16,7).
(ii) Hence find the gradient of the normal to C at the point (16,7).
(iii) Find the equation of the normal to C at the point (16,7).
Was this exam question helpful?
A company logo is in the shape of a semi-ellipse as shown in the diagram below.

The graph of the logo is defined by the parametric equations
x = 3 + 2 cost and y = -3sin t,
where x and y are measured in centimetres.
Verify that the values of t, labelled t1 and t2 on the diagram above where y = 0, are t1 = and t2 = 2
(i) Find .
(ii) Show that the shaded area is given by
(iii) Hence using your calculator or otherwise, find the area of the logo.
Was this exam question helpful?
The diagram below shows part of the curve C with parametric equations
x =t2+1 and y = 2t -4 t≥0

The point on the graph where t = t1 has x-coordinate 5.
The point on the graph where t = t2 has x-coordinate 10.
Show that t1 = 2 and t2 = 3, and find the coordinates of the corresponding points on C.
The region R shown in the diagram is bounded by C, the x-axis, and the line x = 10.
Region R is rotated through 360° about the x-axis to form a solid of revolution.
(i) Show that the volume of the solid of revolution is given by the integral
(ii) Hence find the exact volume of the solid generated.
Was this exam question helpful?
Find an expression for in terms of for the parametric equations:
The graph of against passes through the point .
(i) Find the value of at the point .
(ii) Find the gradient at the point .
(iii) What does the value of the gradient tell you about point ?
Was this exam question helpful?
The graph defined by the parametric equations
is shown below.
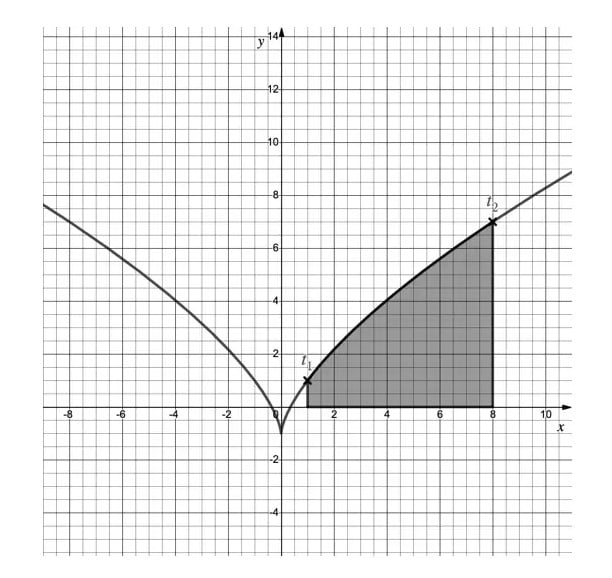
The point where has coordinates
The point where has coordinates
Find the values of and .
(i) Show that the shaded area can be found using the integral
(ii) Hence find the shaded area.
Was this exam question helpful?
A crane swings a wrecking ball along a two-dimensional path defined by the parametric equations
as shown in the diagram below.
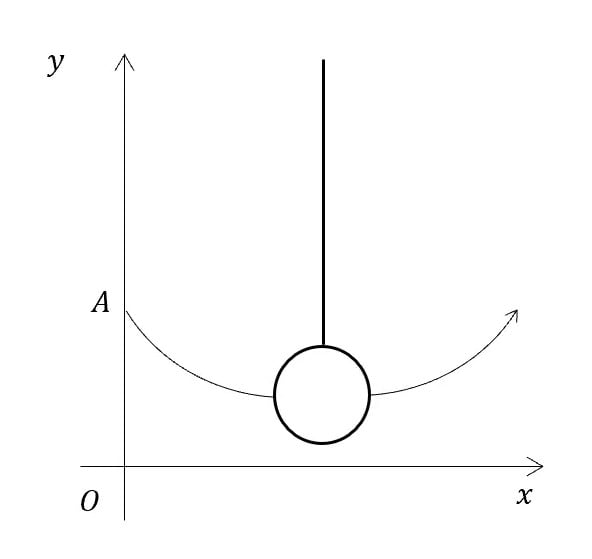
and are, respectively, the horizontal and vertical displacements in metres from the origin, , and is the time in seconds. Point indicates the initial position of the wrecking ball, at time .
Find the height of the wrecking ball after 0.3 seconds.
Find the minimum height of the wrecking ball during its motion.
Find the horizontal distances from point at the times when the wrecking ball is at a height of 2.9 m, giving your answers accurate to 1 decimal place.
Was this exam question helpful?
The graph of the curve shown below is defined by the parametric equations
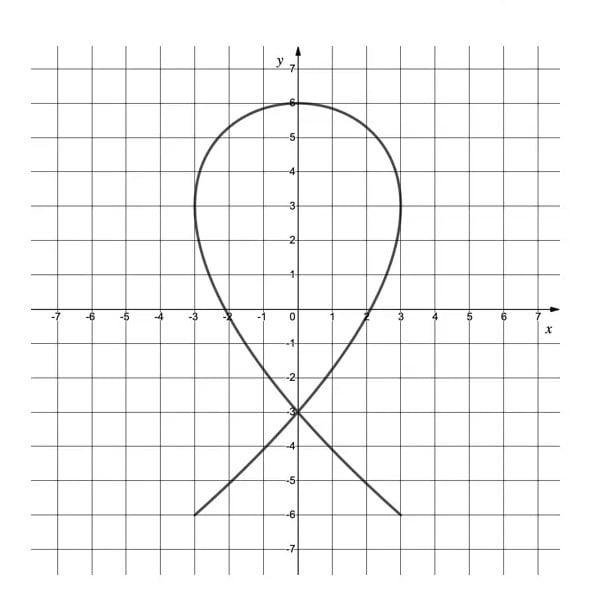
(i) Write down the value of at the point (0, 6) .
(ii) Write down the value of at the points (-3, 3) and (3, 3).
Find an expression for in terms of .
(i) Find the values of and at the point where .
(ii) Hence show the equation of the tangent to \( C \) at the point where is
Was this exam question helpful?
The curve has parametric equations
Find an expression, in terms of , for .
(i) Find the gradient of the tangent to at the point .
(ii) Hence write down the gradient of the normal to at the point .
(iii) Find the equation of the normal to at the point .
Was this exam question helpful?
The curve has parametric equations
Show that, in terms of ,
Show that the distance between the maximum and minimum points on C is
Was this exam question helpful?
A company logo is in the shape of the symbol for infinity (∞) as shown on the graph below.
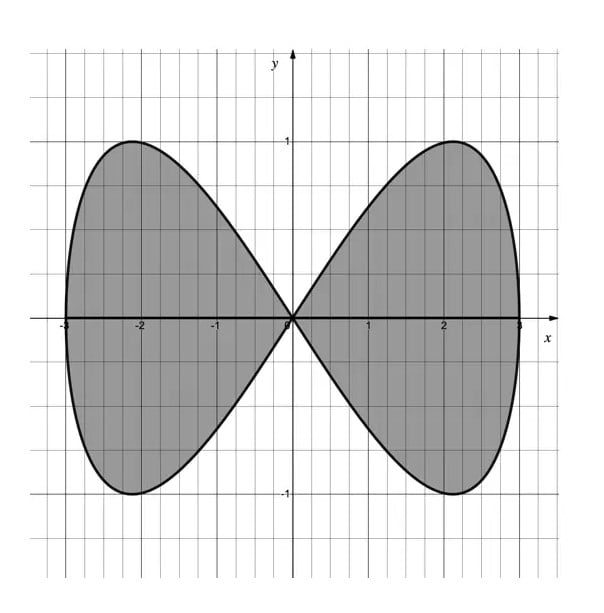
The company wishes to produce a sign of its logo and requires it to be painted, as indicated by the shading in the diagram.
The graph of the logo is defined by the parametric equations
where and are measured in metres.
(i) Show that when , , and that when , .
(ii) Find the coordinates of the point on the graph corresponding to .
(i) Using your results from part (a), along with the double angle formula show that the total area of the logo is given by
(ii) Hence find the total area of the logo that is to be painted.
Was this exam question helpful?
A model car travels on a model track along the path of the curve shown in the diagram below. The curve is defined by the parametric equations
where and are, respectively, the horizontal and vertical displacements in metres from the origin , and is the time in seconds.
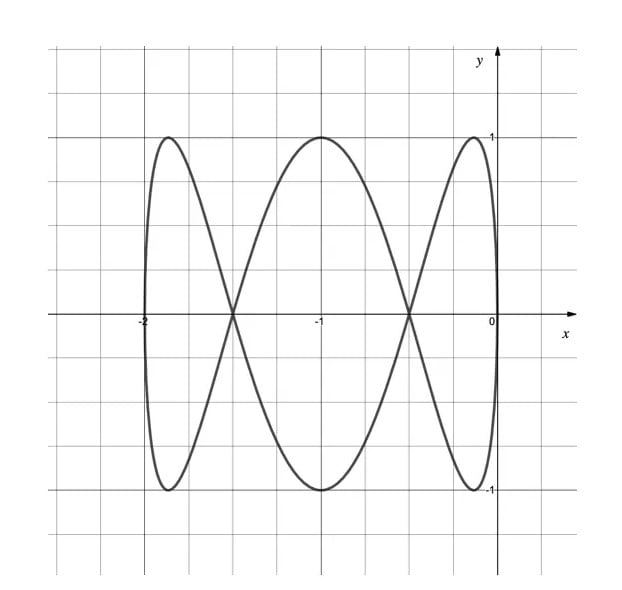
Verify that the starting position of the model car is at the origin, and find the position of the car at the times
(i) How many laps of the track does the model car complete?
(ii) Find the times at which the model car is at the point
Was this exam question helpful?
The diagram below shows part of the curve with parametric equations
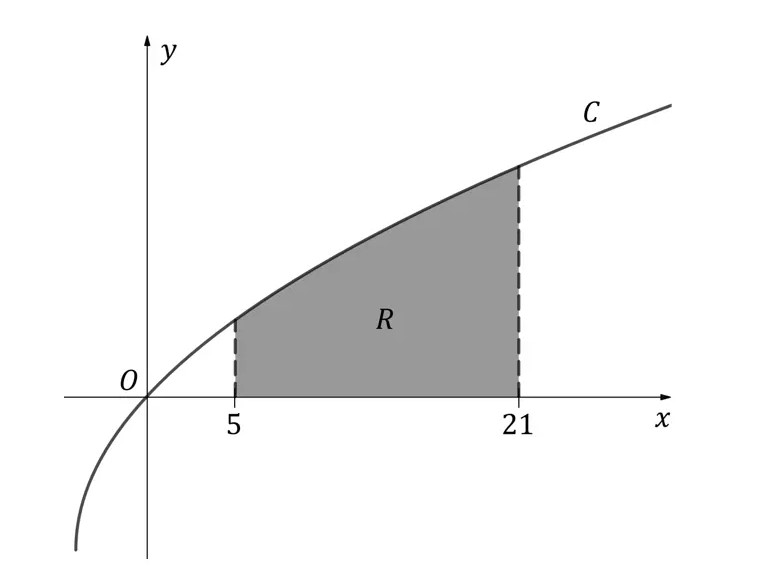
The point on the graph where has -coordinate 5.
The point on the graph where has -coordinate 21.
Determine the values of and , and find the coordinates of the corresponding points on .
The region shown in the diagram is bounded by , the -axis, and the lines and . Region is rotated through 360° about the -axis to form a solid of revolution.
(i) Show that the volume of the solid of revolution is given by the integral
(ii) Hence find the exact volume of the solid generated.
Was this exam question helpful?
Find an expression for in terms of t for the parametric equations
Verify that the graph of against y passes through the point (0, 1) and find the gradient at that point.
Was this exam question helpful?
The graph defined by the parametric equations
x=5t-1 y = t≥ 0
is shown below.

The point where t = t1 has coordinates (-1,0).
The point where t = t2 has coordinates (4, 1).
(i) Show that the shaded area can be found using the integral
(ii) Hence find the shaded area.
Was this exam question helpful?
A crane swings a wrecking ball along a two-dimensional path defined by the parametric equations
x = 8t -4 y=16t2-16t + 5 0 ≤ t ≤ 1
as shown in the diagram below.
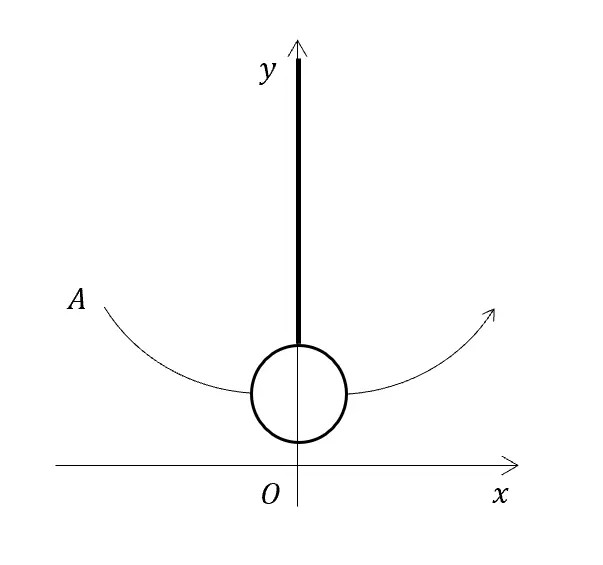
x and y are, respectively, the horizontal and vertical displacements in metres from the origin, 0, and t is the time in seconds. Point A indicates the initial position of the wrecking ball, at time t = 0.
Find a Cartesian equation of the curve in the form y = f(x), and state the domain of f(x).
Find the difference between the maximum and minimum heights of the wrecking ball during its motion.
The crane is positioned such that point A is 7 m horizontally from the wall the wrecking ball is to destroy.
Find the height at which the wrecking ball will strike the wall.
Was this exam question helpful?
The graph of the curve C shown below is defined by the parametric equations
x = 2 cos 3 y = 5 sin 0 ≤ ≤ 2

Find an expression for in terms of .
(i) Show that the gradient of the tangent to C, at the point where , is .
(ii) Hence find the equation of the tangent to C at the point where .
Was this exam question helpful?
The curve C has parametric equations
x = t>0
Find an expression, in terms of t, for
(i) Find the gradient of the tangent to C at the point where t =
(ii) Hence find the equation of the normal to C at the point where t =
Was this exam question helpful?
The curve C has parametric equations
Show that at the point (0, 6), and find the value of at this point.
The tangent at the point (0, 6) is parallel to the normal at the point P.
Find the exact coordinates of point P
Was this exam question helpful?
A curve C has parametric equations
The tangents to C at the points R and S meet at the point T, as shown in the diagram below.

Given that the x-coordinate of both points R and S is 5, find the area of the triangle RST.
Was this exam question helpful?
A model car travels on a model track along the path of the curve shown in the diagram below. The curve is defined by the parametric equations
where and are, respectively, the horizontal and vertical displacements in metres from the origin , and is the time in seconds.

(i) Write down the coordinates of the starting position of the model car.
(ii) Indicate on the graph in which direction the model car travels.
(iii) How many laps of the track will the model car complete?
Find the times during the first lap at which the model car is at a “crossroads” – indicated by points and on the graph.
Find the speed of the model car at the start of the final lap.
Was this exam question helpful?
The diagram below shows the curve with parametric equations

Find the coordinates of the points where intersects the -axis, and determine the corresponding values of .
The region shown in the diagram is bounded by and the -axis. Region is rotated through radians about the -axis to form a solid of revolution.
(i) Show that the volume of the solid of revolution is given by the integral
(ii) Hence find the exact volume of the solid generated.
Was this exam question helpful?
The shaded area in the diagram below is bounded on three of its sides by the -axis, the -axis, and the line . On the remaining side, the boundary is defined by the parametric equations

Show that the shaded area is not a trapezium.
In your work, you may use without proof the result
Was this exam question helpful?
A crane swings a wrecking ball along a two-dimensional path defined by the parametric equations
as shown in the diagram below.
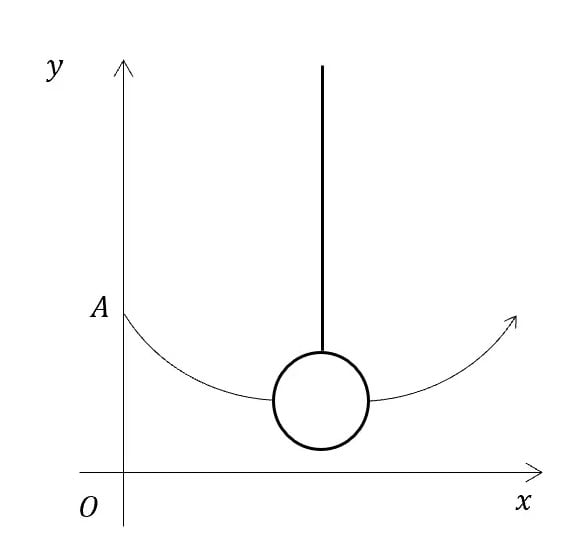
x and y are, respectively, the horizontal and vertical displacements in metres from the origin, O, and t is the time in seconds. Point A indicates the initial position of the wrecking ball.
(i) Write down the height of the wrecking ball when it is at point A.
(ii) Find the shortest distance between the wrecking ball and the ground during its motion.
The destruction of a building requires the wrecking ball to strike it at a height of 1.4 m whilst on the upward part of its path.
Find the horizontal distance from point A at which the ball hits the building.
Was this exam question helpful?
The graph of the ellipse E shown below is defined by the parametric equations:
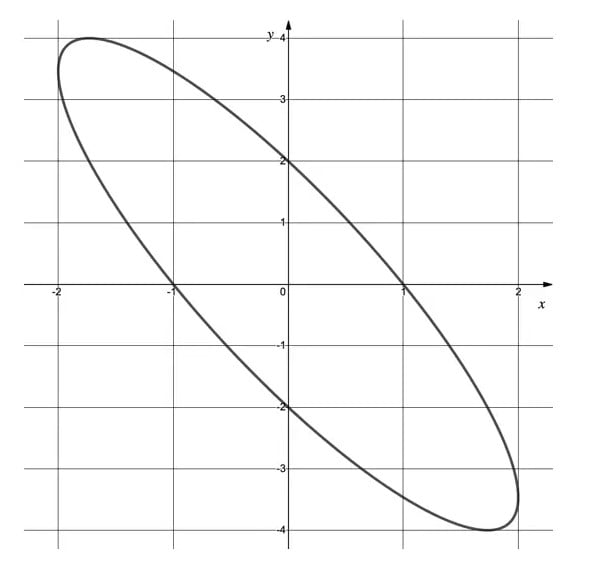
Find an expression for in terms of .
Find the equation of the tangent to E, at the point where , giving your answer in the form , where and are real numbers that should be given in exact form.
Was this exam question helpful?
The curve has parametric equations
Find the equation of the normal to at the point where intersects the line
Was this exam question helpful?
The graph of the curve defined by the parametric equations
is shown below.
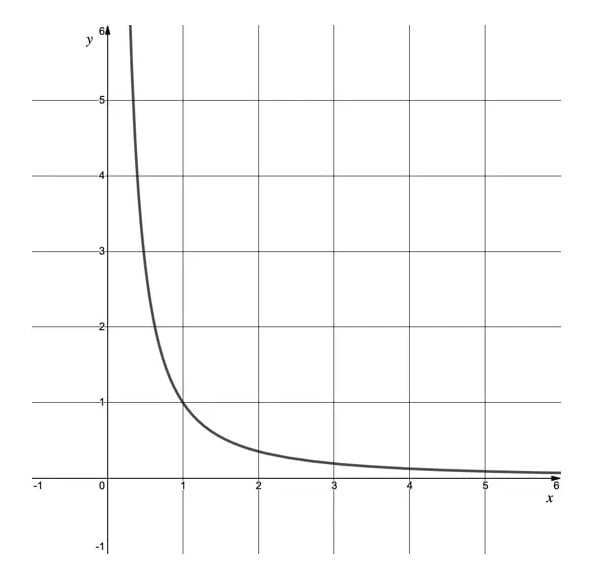
(i) Verify that the graph passes through the point .
(ii) Prove that the line with equation is not the normal to the curve at the point .
Was this exam question helpful?
The diagram below shows a sketch of the curve defined by the parametric equations
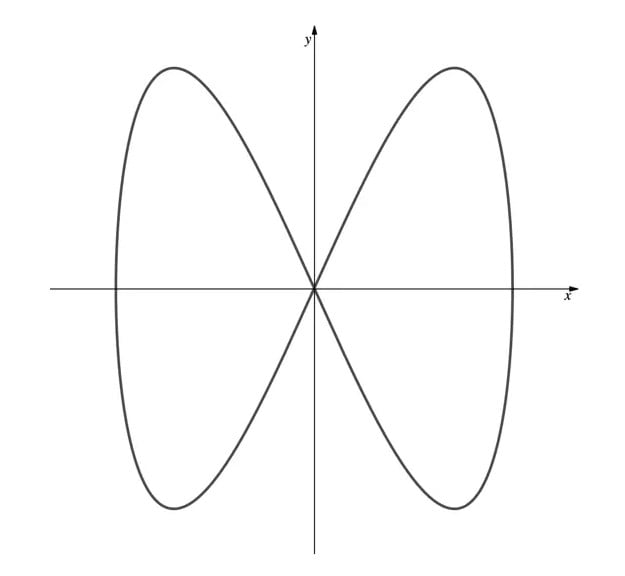
(i) Write down the equations of the two horizontal tangents to the curve.
(ii) Write down the equations of the two vertical tangents to the curve.
The four tangents from part (a) create a rectangle around the curve as shown below.
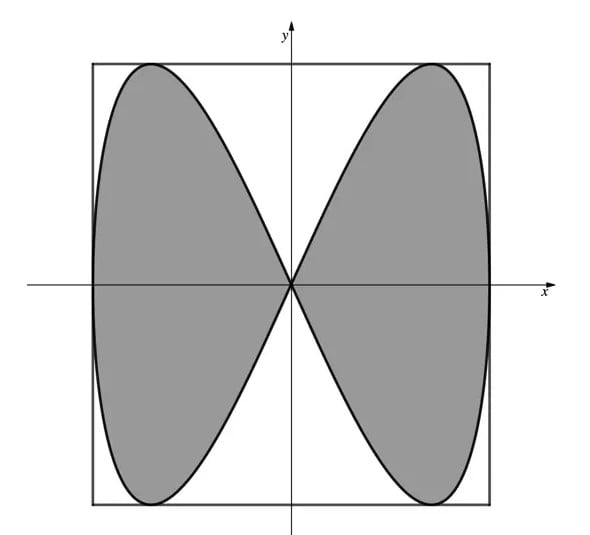
Find the percentage of the area of the rectangle enclosed by the curve (the shaded area on the diagram).
Was this exam question helpful?
The diagram below shows a sketch of the curve defined by the parametric equations
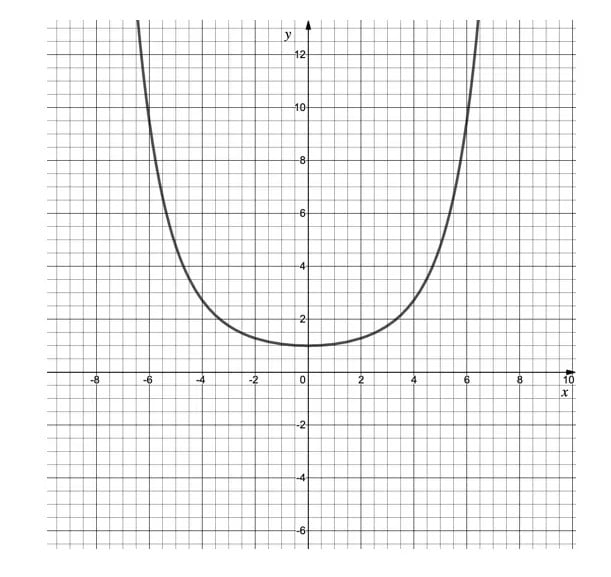
The tangents to the curve that pass through the origin meet the curve at points and .
Show that the values of at points and are
Hence, or otherwise, show that the area of the triangle is square units
Was this exam question helpful?
A model car travels on a model track along the path of the curve shown in the diagram below. The curve is defined by the parametric equations:
where and are, respectively, the horizontal and vertical displacements in metres from the origin , and is the time in seconds.
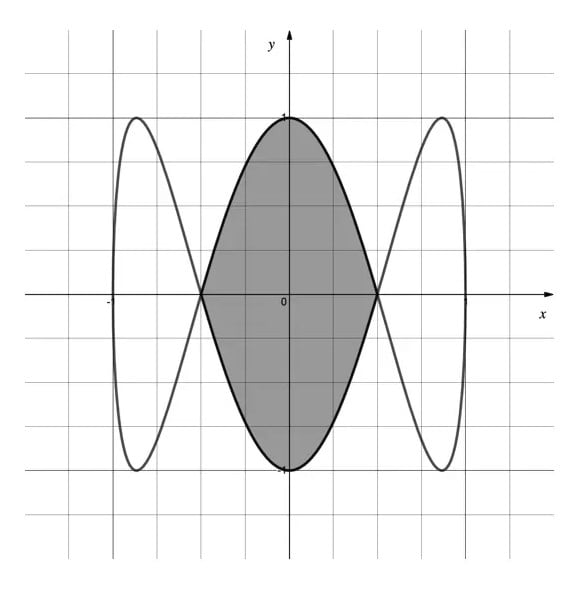
(i) Write down the coordinates of the starting position of the model car.
(ii) Indicate on the graph in which direction the model car travels.
(iii) How many laps of the track will the model car complete?
A second track is to be constructed within the central area of the original track, indicated by shading on the graph above.
The design for the second track requires an area of at least .
Determine if there is sufficient room for the second track to be built within the central area of the original track.
In your work, you may use without proof the result:
where is a constant of integration.
Was this exam question helpful?
The diagram below shows the curve with parametric equations
where is a constant.
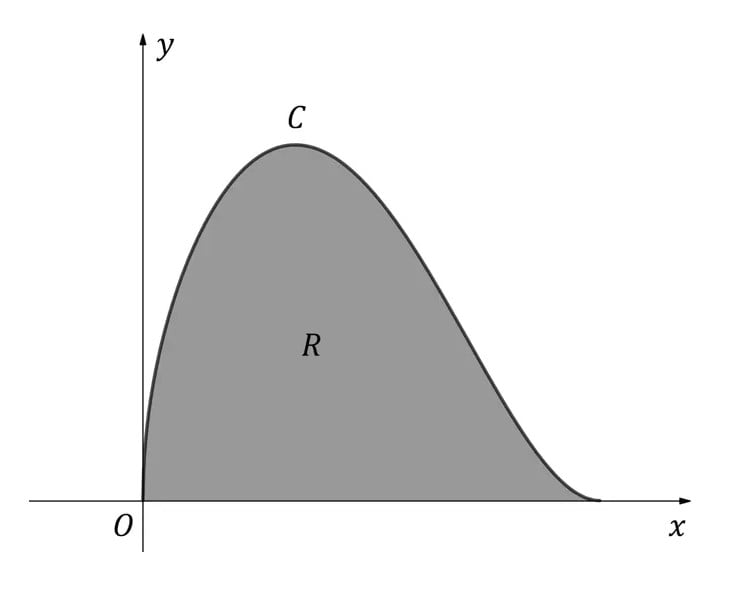
The region shown in the diagram is bounded by and the -axis. Region is rotated through radians about the -axis to form a solid of revolution.
Given that the volume of the solid generated is 10 cubic units, determine the exact value of .
Was this exam question helpful?