Goodness of Fit (Edexcel A Level Further Maths: Further Statistics 1): Revision Note
Exam code: 9FM0

Goodness of fit
What is the difference between observed values and expected values?
Goodness of fit is a measure of how well real-life observed data fits a theoretical model
For example, modelling a coin as fair then flipping it 20 times
You may observe 13 heads
You would expect 10 heads
Observed () and expected () values can be shown in a table
For example, rolling a fair die 60 times ()
Outcome
1
2
3
4
5
6
12
7
8
10
14
9
10
10
10
10
10
10
Note that
format('truetype')%3Bfont-weight%3Anormal%3Bfont-style%3Anormal%3B%7D%3C%2Fstyle%3E%3C%2Fdefs%3E%3Ctext%20font-family%3D%22math1bf249b07e0cbef67836d3ed7ae%22%20font-size%3D%2224%22%20text-anchor%3D%22middle%22%20x%3D%2211.5%22%20y%3D%2238%22%3E%26%23x2211%3B%3C%2Ftext%3E%3Ctext%20font-family%3D%22Times%20New%20Roman%22%20font-size%3D%2218%22%20font-style%3D%22italic%22%20text-anchor%3D%22middle%22%20x%3D%2228.5%22%20y%3D%2235%22%3EO%3C%2Ftext%3E%3Ctext%20font-family%3D%22Times%20New%20Roman%22%20font-size%3D%2213%22%20font-style%3D%22italic%22%20text-anchor%3D%22middle%22%20x%3D%2238.5%22%20y%3D%2243%22%3Ei%3C%2Ftext%3E%3Ctext%20font-family%3D%22math1bf249b07e0cbef67836d3ed7ae%22%20font-size%3D%2216%22%20text-anchor%3D%22middle%22%20x%3D%2249.5%22%20y%3D%2235%22%3E%3D%3C%2Ftext%3E%3Ctext%20font-family%3D%22math1bf249b07e0cbef67836d3ed7ae%22%20font-size%3D%2224%22%20text-anchor%3D%22middle%22%20x%3D%2269.5%22%20y%3D%2238%22%3E%26%23x2211%3B%3C%2Ftext%3E%3Ctext%20font-family%3D%22Times%20New%20Roman%22%20font-size%3D%2218%22%20font-style%3D%22italic%22%20text-anchor%3D%22middle%22%20x%3D%2285.5%22%20y%3D%2235%22%3EE%3C%2Ftext%3E%3Ctext%20font-family%3D%22Times%20New%20Roman%22%20font-size%3D%2213%22%20font-style%3D%22italic%22%20text-anchor%3D%22middle%22%20x%3D%2294.5%22%20y%3D%2243%22%3Ei%3C%2Ftext%3E%3Ctext%20font-family%3D%22math1bf249b07e0cbef67836d3ed7ae%22%20font-size%3D%2216%22%20text-anchor%3D%22middle%22%20x%3D%22105.5%22%20y%3D%2235%22%3E%3D%3C%2Ftext%3E%3Ctext%20font-family%3D%22Times%20New%20Roman%22%20font-size%3D%2218%22%20font-style%3D%22italic%22%20text-anchor%3D%22middle%22%20x%3D%22120.5%22%20y%3D%2235%22%3EN%3C%2Ftext%3E%3Ctext%20font-family%3D%22math1bf249b07e0cbef67836d3ed7ae%22%20font-size%3D%2216%22%20text-anchor%3D%22middle%22%20x%3D%22136.5%22%20y%3D%2235%22%3E%3D%3C%2Ftext%3E%3Ctext%20font-family%3D%22Times%20New%20Roman%22%20font-size%3D%2218%22%20text-anchor%3D%22middle%22%20x%3D%22154.5%22%20y%3D%2235%22%3E60%3C%2Ftext%3E%3C%2Fsvg%3E)
How different do observed and expected values need to be before the model is not a good fit?
You can do a hypothesis test to reach a conclusion
What are the null and alternative hypotheses?
There is no difference between the observed and the expected distribution
The observed distribution cannot be modelled by the expected distribution
Let be the significance level
How do I calculate the goodness of fit?
First, combine any columns for which expected values are less than 5 until they are greater than 5
For example
Score
1
2
3
4
15
6
4
1
12
8
4
2
The expected value of 2 is less than 5 so combine the last two columns
Score
1
2
3+
15
6
5
12
8
6
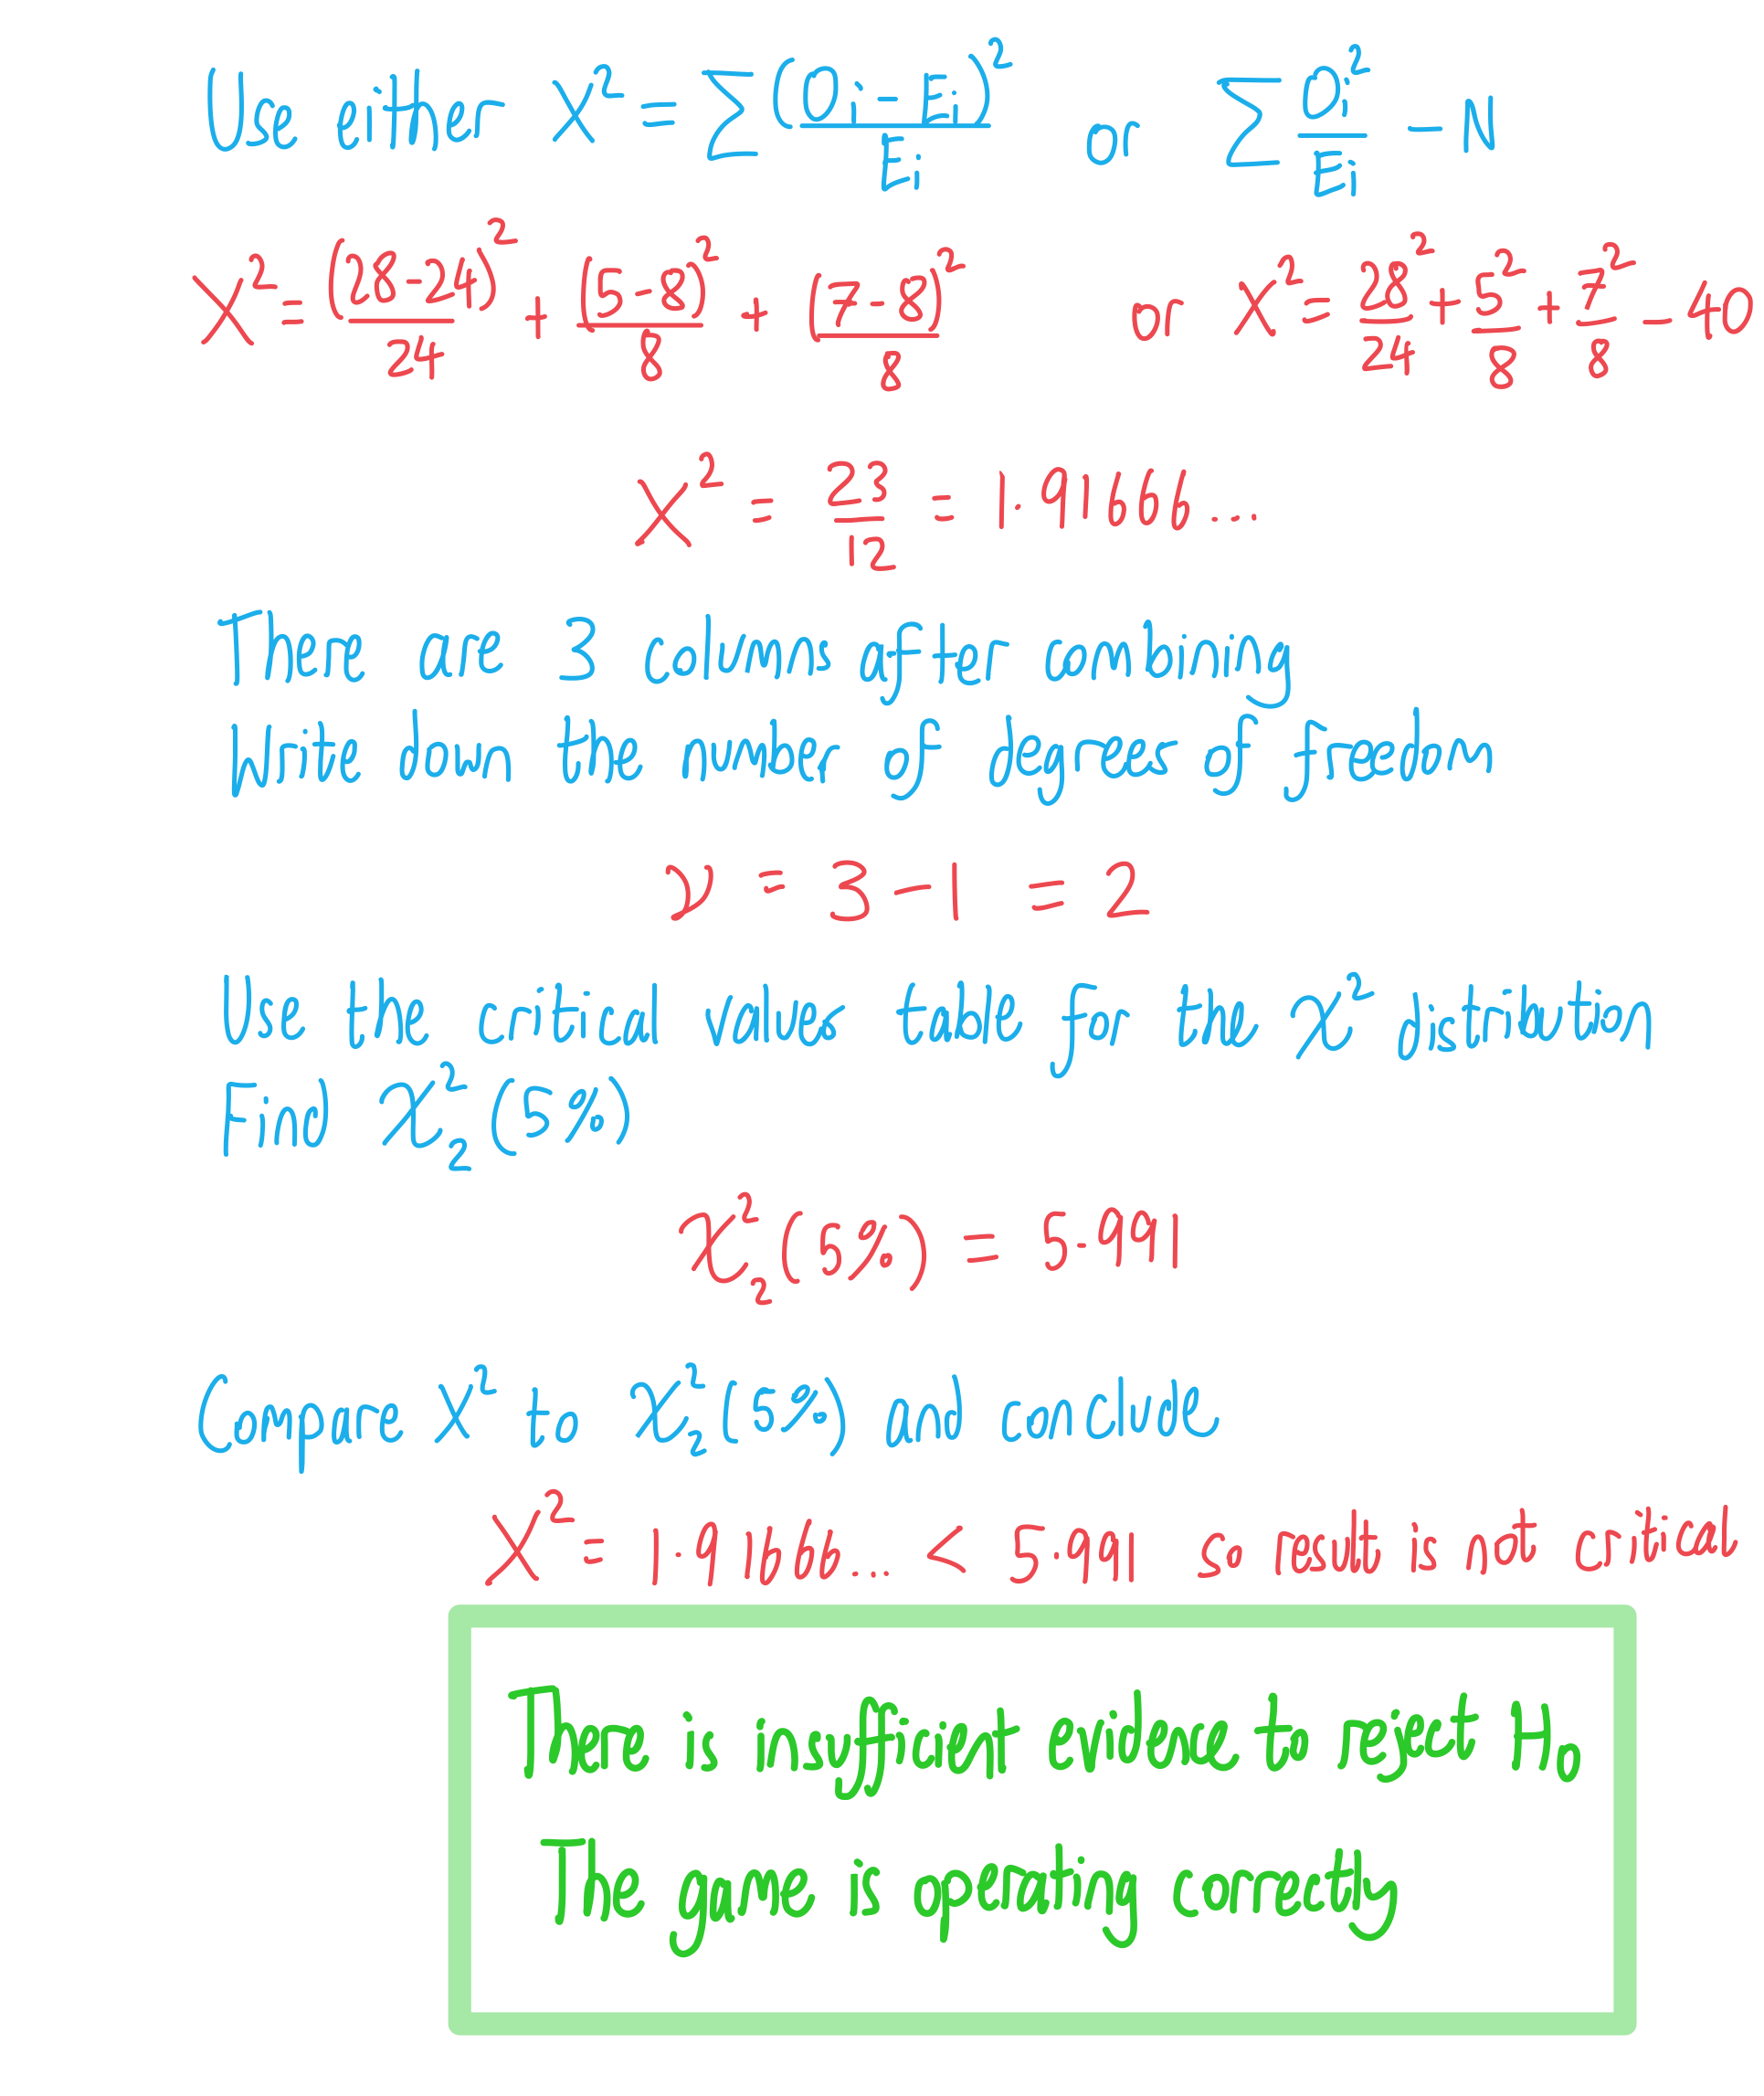
Then calculate the goodness of fit, , from the formula
An alternative version of the formula that can be easier to calculate is
format('truetype')%3Bfont-weight%3Anormal%3Bfont-style%3Anormal%3B%7D%3C%2Fstyle%3E%3C%2Fdefs%3E%3Ctext%20font-family%3D%22Times%20New%20Roman%22%20font-size%3D%2218%22%20font-style%3D%22italic%22%20text-anchor%3D%22middle%22%20x%3D%226.5%22%20y%3D%2237%22%3EX%3C%2Ftext%3E%3Ctext%20font-family%3D%22Times%20New%20Roman%22%20font-size%3D%2213%22%20text-anchor%3D%22middle%22%20x%3D%2217.5%22%20y%3D%2232%22%3E2%3C%2Ftext%3E%3Ctext%20font-family%3D%22math16e413ce556b43427c17d28c910%22%20font-size%3D%2216%22%20text-anchor%3D%22middle%22%20x%3D%2229.5%22%20y%3D%2237%22%3E%3D%3C%2Ftext%3E%3Ctext%20font-family%3D%22math16e413ce556b43427c17d28c910%22%20font-size%3D%2224%22%20text-anchor%3D%22middle%22%20x%3D%2249.5%22%20y%3D%2240%22%3E%26%23x2211%3B%3C%2Ftext%3E%3Cline%20stroke%3D%22%23000%22%20stroke-linecap%3D%22square%22%20stroke-width%3D%221%22%20x1%3D%2262.5%22%20x2%3D%2291.5%22%20y1%3D%2230.5%22%20y2%3D%2230.5%22%2F%3E%3Ctext%20font-family%3D%22Times%20New%20Roman%22%20font-size%3D%2218%22%20font-style%3D%22italic%22%20text-anchor%3D%22middle%22%20x%3D%2270.5%22%20y%3D%2217%22%3EO%3C%2Ftext%3E%3Ctext%20font-family%3D%22Times%20New%20Roman%22%20font-size%3D%2213%22%20font-style%3D%22italic%22%20text-anchor%3D%22middle%22%20x%3D%2280.5%22%20y%3D%2225%22%3Ei%3C%2Ftext%3E%3Ctext%20font-family%3D%22Times%20New%20Roman%22%20font-size%3D%2213%22%20text-anchor%3D%22middle%22%20x%3D%2286.5%22%20y%3D%2212%22%3E2%3C%2Ftext%3E%3Ctext%20font-family%3D%22Times%20New%20Roman%22%20font-size%3D%2218%22%20font-style%3D%22italic%22%20text-anchor%3D%22middle%22%20x%3D%2274.5%22%20y%3D%2248%22%3EE%3C%2Ftext%3E%3Ctext%20font-family%3D%22Times%20New%20Roman%22%20font-size%3D%2213%22%20font-style%3D%22italic%22%20text-anchor%3D%22middle%22%20x%3D%2283.5%22%20y%3D%2256%22%3Ei%3C%2Ftext%3E%3Ctext%20font-family%3D%22math16e413ce556b43427c17d28c910%22%20font-size%3D%2216%22%20text-anchor%3D%22middle%22%20x%3D%22102.5%22%20y%3D%2237%22%3E%26%23x2212%3B%3C%2Ftext%3E%3Ctext%20font-family%3D%22Times%20New%20Roman%22%20font-size%3D%2218%22%20font-style%3D%22italic%22%20text-anchor%3D%22middle%22%20x%3D%22117.5%22%20y%3D%2237%22%3EN%3C%2Ftext%3E%3C%2Fsvg%3E)
Where is the sum of all observed values
format('truetype')%3Bfont-weight%3Anormal%3Bfont-style%3Anormal%3B%7D%3C%2Fstyle%3E%3C%2Fdefs%3E%3Ctext%20font-family%3D%22Times%20New%20Roman%22%20font-size%3D%2218%22%20font-style%3D%22italic%22%20text-anchor%3D%22middle%22%20x%3D%226.5%22%20y%3D%2235%22%3EN%3C%2Ftext%3E%3Ctext%20font-family%3D%22math18a3c3e29d34cb201635f942203%22%20font-size%3D%2216%22%20text-anchor%3D%22middle%22%20x%3D%2222.5%22%20y%3D%2235%22%3E%3D%3C%2Ftext%3E%3Ctext%20font-family%3D%22math18a3c3e29d34cb201635f942203%22%20font-size%3D%2224%22%20text-anchor%3D%22middle%22%20x%3D%2242.5%22%20y%3D%2238%22%3E%26%23x2211%3B%3C%2Ftext%3E%3Ctext%20font-family%3D%22Times%20New%20Roman%22%20font-size%3D%2218%22%20font-style%3D%22italic%22%20text-anchor%3D%22middle%22%20x%3D%2259.5%22%20y%3D%2235%22%3EO%3C%2Ftext%3E%3Ctext%20font-family%3D%22Times%20New%20Roman%22%20font-size%3D%2213%22%20font-style%3D%22italic%22%20text-anchor%3D%22middle%22%20x%3D%2269.5%22%20y%3D%2243%22%3Ei%3C%2Ftext%3E%3C%2Fsvg%3E)
This is also the same as the sum of all expected values
The larger is, the more different the observed values are from the expected values
format('truetype')%3Bfont-weight%3Anormal%3Bfont-style%3Anormal%3B%7D%40font-face%7Bfont-family%3A'round_brackets22549f92a457f2409'%3Bsrc%3Aurl(data%3Afont%2Ftruetype%3Bcharset%3Dutf-8%3Bbase64%2CAAEAAAAMAIAAAwBAT1MvMjxkLiAAAADMAAAATmNtYXDf7xCrAAABHAAAADxjdnQgBAkDLgAAAVgAAAASZ2x5Zr5a4R4AAAFsAAABKWhlYWQO9ymoAAACmAAAADZoaGVhDVUVZQAAAtAAAAAkaG10eCFnAAIAAAL0AAAADGxvY2EAAARdAAADAAAAABBtYXhwBIgEWQAAAxAAAAAgbmFtZXHO2TgAAAMwAAACOXBvc3QEagIzAAAFbAAAACBwcmVwupWEAAAABYwAAAAHAAAGrgGQAAUAAAgACAAAAAAACAAIAAAAAAAAAQIAAAAAAAAAAAAAAAAAAAAAAAAAAAAAAAAAAAAAACAgICAAAAAo8AMGe%2F57AAAIzgIPAAAAAAACAAEAAQAAABQAAwABAAAAFAAEACgAAAAGAAQAAQACACgAKf%2F%2FAAAAKAAp%2F%2F%2F%2F2f%2FZAAEAAAAAAAAAAAFUAFYBAAAsAKgDgAAyAAcAAAACAAAAKgDVA1UAAwAHAAA1MxEjEyMRM9XVq4CAKgMr%2FQAC1QABAAD%2BYAJQCGAACQBNGAGwChCwA9SwAxCwAtSwChCwBdSwBRCwANSwAxCwBzywAhCwCDwAsAoQsAPUsAMQsAfUsAoQsAXUsAoQsADUsAMQsAI8sAcQsAg8MTATAgEzABMQASMABAQBwJD%2BPAQBwJD%2BRANg%2FHD%2BkAFwA5ADoAFg%2FqAAAQAA%2FmACUAhgAAkATRgBsAoQsAPUsAMQsALUsAoQsAXUsAUQsADUsAMQsAc8sAIQsAg8ALAKELAD1LADELAH1LAKELAF1LAKELAA1LADELACPLAHELAIPDEwARIBIwADEAEzAAJMBP5AkAHEBP5AkAG8A2D8cP6QAXADkAOgAWD%2BoAAAAAABAAAAAQAALiwXwl8PPPUAAwgA%2F%2F%2F%2F%2F9Wt7vT%2F%2F%2F%2F%2F1a3u9AAA%2FmAEhAhgAAAACgACAAEAAAAAAAEAAAjO%2FfEAABdwAAD%2F%2FgSEAAEAAAAAAAAAAAAAAAAAAAADANUAAAJQAAACUAAAAAAAAAAAACQAAACmAAABKQABAAAAAwAKAAIAAAAAAAIAgAQAAAAAAAQAAE0AAAAAAAAAFQECAAAAAAAAAAEAPgAAAAAAAAAAAAIADgA%2BAAAAAAAAAAMAXABMAAAAAAAAAAQAPgCoAAAAAAAAAAUAFgDmAAAAAAAAAAYAHwD8AAAAAAAAAAgAHAEbAAEAAAAAAAEAPgAAAAEAAAAAAAIADgA%2BAAEAAAAAAAMAXABMAAEAAAAAAAQAPgCoAAEAAAAAAAUAFgDmAAEAAAAAAAYAHwD8AAEAAAAAAAgAHAEbAAMAAQQJAAEAPgAAAAMAAQQJAAIADgA%2BAAMAAQQJAAMAXABMAAMAAQQJAAQAPgCoAAMAAQQJAAUAFgDmAAMAAQQJAAYAHwD8AAMAAQQJAAgAHAEbAFIAbwB1AG4AZAAgAGIAcgBhAGMAawBlAHQAcwAgAHcAaQB0AGgAIABhAHMAYwBlAG4AdAAgADIAMgA1ADQAUgBlAGcAdQBsAGEAcgBNAGEAdABoAHMAIABGAG8AcgAgAE0AbwByAGUAIABSAG8AdQBuAGQAIABiAHIAYQBjAGsAZQB0AHMAIAB3AGkAdABoACAAYQBzAGMAZQBuAHQAIAAyADIANQA0AFIAbwB1AG4AZAAgAGIAcgBhAGMAawBlAHQAcwAgAHcAaQB0AGgAIABhAHMAYwBlAG4AdAAgADIAMgA1ADQAVgBlAHIAcwBpAG8AbgAgADIALgAwUm91bmRfYnJhY2tldHNfd2l0aF9hc2NlbnRfMjI1NABNAGEAdABoAHMAIABGAG8AcgAgAE0AbwByAGUAAAAAAwAAAAAAAARnAjMAAAAAAAAAAAAAAAAAAAAAAAAAALkH%2FwABjYUA)format('truetype')%3Bfont-weight%3Anormal%3Bfont-style%3Anormal%3B%7D%3C%2Fstyle%3E%3C%2Fdefs%3E%3Ctext%20font-family%3D%22Times%20New%20Roman%22%20font-size%3D%2218%22%20font-style%3D%22italic%22%20text-anchor%3D%22middle%22%20x%3D%226.5%22%20y%3D%2237%22%3EX%3C%2Ftext%3E%3Ctext%20font-family%3D%22Times%20New%20Roman%22%20font-size%3D%2213%22%20text-anchor%3D%22middle%22%20x%3D%2217.5%22%20y%3D%2232%22%3E2%3C%2Ftext%3E%3Ctext%20font-family%3D%22math16e413ce556b43427c17d28c910%22%20font-size%3D%2216%22%20text-anchor%3D%22middle%22%20x%3D%2229.5%22%20y%3D%2237%22%3E%3D%3C%2Ftext%3E%3Ctext%20font-family%3D%22math16e413ce556b43427c17d28c910%22%20font-size%3D%2224%22%20text-anchor%3D%22middle%22%20x%3D%2249.5%22%20y%3D%2240%22%3E%26%23x2211%3B%3C%2Ftext%3E%3Cline%20stroke%3D%22%23000%22%20stroke-linecap%3D%22square%22%20stroke-width%3D%221%22%20x1%3D%2262.5%22%20x2%3D%22137.5%22%20y1%3D%2230.5%22%20y2%3D%2230.5%22%2F%3E%3Ctext%20font-family%3D%22round_brackets22549f92a457f2409%22%20font-size%3D%2218%22%20text-anchor%3D%22middle%22%20x%3D%2267.5%22%20y%3D%2222%22%3E(%3C%2Ftext%3E%3Ctext%20font-family%3D%22round_brackets22549f92a457f2409%22%20font-size%3D%2218%22%20text-anchor%3D%22middle%22%20x%3D%22125.5%22%20y%3D%2222%22%3E)%3C%2Ftext%3E%3Ctext%20font-family%3D%22Times%20New%20Roman%22%20font-size%3D%2218%22%20font-style%3D%22italic%22%20text-anchor%3D%22middle%22%20x%3D%2276.5%22%20y%3D%2217%22%3EO%3C%2Ftext%3E%3Ctext%20font-family%3D%22Times%20New%20Roman%22%20font-size%3D%2213%22%20font-style%3D%22italic%22%20text-anchor%3D%22middle%22%20x%3D%2286.5%22%20y%3D%2225%22%3Ei%3C%2Ftext%3E%3Ctext%20font-family%3D%22math16e413ce556b43427c17d28c910%22%20font-size%3D%2216%22%20text-anchor%3D%22middle%22%20x%3D%2297.5%22%20y%3D%2217%22%3E%26%23x2212%3B%3C%2Ftext%3E%3Ctext%20font-family%3D%22Times%20New%20Roman%22%20font-size%3D%2218%22%20font-style%3D%22italic%22%20text-anchor%3D%22middle%22%20x%3D%22111.5%22%20y%3D%2217%22%3EE%3C%2Ftext%3E%3Ctext%20font-family%3D%22Times%20New%20Roman%22%20font-size%3D%2213%22%20font-style%3D%22italic%22%20text-anchor%3D%22middle%22%20x%3D%22120.5%22%20y%3D%2225%22%3Ei%3C%2Ftext%3E%3Ctext%20font-family%3D%22Times%20New%20Roman%22%20font-size%3D%2213%22%20text-anchor%3D%22middle%22%20x%3D%22132.5%22%20y%3D%2212%22%3E2%3C%2Ftext%3E%3Ctext%20font-family%3D%22Times%20New%20Roman%22%20font-size%3D%2218%22%20font-style%3D%22italic%22%20text-anchor%3D%22middle%22%20x%3D%2297.5%22%20y%3D%2248%22%3EE%3C%2Ftext%3E%3Ctext%20font-family%3D%22Times%20New%20Roman%22%20font-size%3D%2213%22%20font-style%3D%22italic%22%20text-anchor%3D%22middle%22%20x%3D%22106.5%22%20y%3D%2256%22%3Ei%3C%2Ftext%3E%3C%2Fsvg%3E)
What are degrees of freedom?
The number of degrees of freedom, , is equal to
The number of columns (after combining to get ) subtract 1
If you also use the observed data to estimate a parameter, then you subtract 2 instead
For example, trying to estimate when comparing to a distribution
You are subtracting the number of constraints (or restrictions)
This is the number of times you use the observed data to help form the expected data
This is always 1 from ensuring their totals match,
format('truetype')%3Bfont-weight%3Anormal%3Bfont-style%3Anormal%3B%7D%3C%2Fstyle%3E%3C%2Fdefs%3E%3Ctext%20font-family%3D%22math1bf249b07e0cbef67836d3ed7ae%22%20font-size%3D%2224%22%20text-anchor%3D%22middle%22%20x%3D%2211.5%22%20y%3D%2238%22%3E%26%23x2211%3B%3C%2Ftext%3E%3Ctext%20font-family%3D%22Times%20New%20Roman%22%20font-size%3D%2218%22%20font-style%3D%22italic%22%20text-anchor%3D%22middle%22%20x%3D%2227.5%22%20y%3D%2235%22%3EE%3C%2Ftext%3E%3Ctext%20font-family%3D%22Times%20New%20Roman%22%20font-size%3D%2213%22%20font-style%3D%22italic%22%20text-anchor%3D%22middle%22%20x%3D%2236.5%22%20y%3D%2243%22%3Ei%3C%2Ftext%3E%3Ctext%20font-family%3D%22math1bf249b07e0cbef67836d3ed7ae%22%20font-size%3D%2216%22%20text-anchor%3D%22middle%22%20x%3D%2247.5%22%20y%3D%2235%22%3E%3D%3C%2Ftext%3E%3Ctext%20font-family%3D%22math1bf249b07e0cbef67836d3ed7ae%22%20font-size%3D%2224%22%20text-anchor%3D%22middle%22%20x%3D%2267.5%22%20y%3D%2238%22%3E%26%23x2211%3B%3C%2Ftext%3E%3Ctext%20font-family%3D%22Times%20New%20Roman%22%20font-size%3D%2218%22%20font-style%3D%22italic%22%20text-anchor%3D%22middle%22%20x%3D%2284.5%22%20y%3D%2235%22%3EO%3C%2Ftext%3E%3Ctext%20font-family%3D%22Times%20New%20Roman%22%20font-size%3D%2213%22%20font-style%3D%22italic%22%20text-anchor%3D%22middle%22%20x%3D%2294.5%22%20y%3D%2243%22%3Ei%3C%2Ftext%3E%3C%2Fsvg%3E)
Then another 1 for each parameter estimated
How do I use the chi-squared distribution?
Once you have calculated the goodness of fit,
Compare it to the critical value from the chi-squared distribution
is the number of degrees of freedom
Tables of critical values are provided in the exam
You need the significance level,
All chi-squared tests are one-tailed
If then there is insufficient evidence to reject
This means there is no difference between the observed and expected distributions
In other words, "the expected distribution is a suitable model for the data"
If then there is sufficient evidence to reject
The expected distribution is not a suitable model for the data
Alternatively, you can use your calculator to find the p-value
This is the probability of obtaining a chi-squared value of or more
If then the result is critical (reject )
Examiner Tips and Tricks
The alternative formula
format('truetype')%3Bfont-weight%3Anormal%3Bfont-style%3Anormal%3B%7D%3C%2Fstyle%3E%3C%2Fdefs%3E%3Ctext%20fill%3D%22%23000%22%20font-family%3D%22Times%20New%20Roman%22%20font-size%3D%2218%22%20font-style%3D%22italic%22%20text-anchor%3D%22middle%22%20x%3D%226.5%22%20y%3D%2237%22%3EX%3C%2Ftext%3E%3Ctext%20fill%3D%22%23000%22%20font-family%3D%22Times%20New%20Roman%22%20font-size%3D%2213%22%20text-anchor%3D%22middle%22%20x%3D%2217.5%22%20y%3D%2232%22%3E2%3C%2Ftext%3E%3Ctext%20fill%3D%22%23000%22%20font-family%3D%22math16e413ce556b43427c17d28c910%22%20font-size%3D%2216%22%20text-anchor%3D%22middle%22%20x%3D%2229.5%22%20y%3D%2237%22%3E%3D%3C%2Ftext%3E%3Ctext%20fill%3D%22%23000%22%20font-family%3D%22math16e413ce556b43427c17d28c910%22%20font-size%3D%2224%22%20text-anchor%3D%22middle%22%20x%3D%2249.5%22%20y%3D%2240%22%3E%26%23x2211%3B%3C%2Ftext%3E%3Cline%20stroke%3D%22%23000%22%20stroke-linecap%3D%22square%22%20stroke-width%3D%221%22%20x1%3D%2262.5%22%20x2%3D%2291.5%22%20y1%3D%2230.5%22%20y2%3D%2230.5%22%2F%3E%3Ctext%20fill%3D%22%23000%22%20font-family%3D%22Times%20New%20Roman%22%20font-size%3D%2218%22%20font-style%3D%22italic%22%20text-anchor%3D%22middle%22%20x%3D%2270.5%22%20y%3D%2217%22%3EO%3C%2Ftext%3E%3Ctext%20fill%3D%22%23000%22%20font-family%3D%22Times%20New%20Roman%22%20font-size%3D%2213%22%20font-style%3D%22italic%22%20text-anchor%3D%22middle%22%20x%3D%2280.5%22%20y%3D%2225%22%3Ei%3C%2Ftext%3E%3Ctext%20fill%3D%22%23000%22%20font-family%3D%22Times%20New%20Roman%22%20font-size%3D%2213%22%20text-anchor%3D%22middle%22%20x%3D%2286.5%22%20y%3D%2212%22%3E2%3C%2Ftext%3E%3Ctext%20fill%3D%22%23000%22%20font-family%3D%22Times%20New%20Roman%22%20font-size%3D%2218%22%20font-style%3D%22italic%22%20text-anchor%3D%22middle%22%20x%3D%2274.5%22%20y%3D%2248%22%3EE%3C%2Ftext%3E%3Ctext%20fill%3D%22%23000%22%20font-family%3D%22Times%20New%20Roman%22%20font-size%3D%2213%22%20font-style%3D%22italic%22%20text-anchor%3D%22middle%22%20x%3D%2283.5%22%20y%3D%2256%22%3Ei%3C%2Ftext%3E%3Ctext%20fill%3D%22%23000%22%20font-family%3D%22math16e413ce556b43427c17d28c910%22%20font-size%3D%2216%22%20text-anchor%3D%22middle%22%20x%3D%22102.5%22%20y%3D%2237%22%3E%26%23x2212%3B%3C%2Ftext%3E%3Ctext%20fill%3D%22%23000%22%20font-family%3D%22Times%20New%20Roman%22%20font-size%3D%2218%22%20font-style%3D%22italic%22%20text-anchor%3D%22middle%22%20x%3D%22117.5%22%20y%3D%2237%22%3EN%3C%2Ftext%3E%3C%2Fsvg%3E) is not given in the Formulae Booklet
is not given in the Formulae Booklet
Worked Example
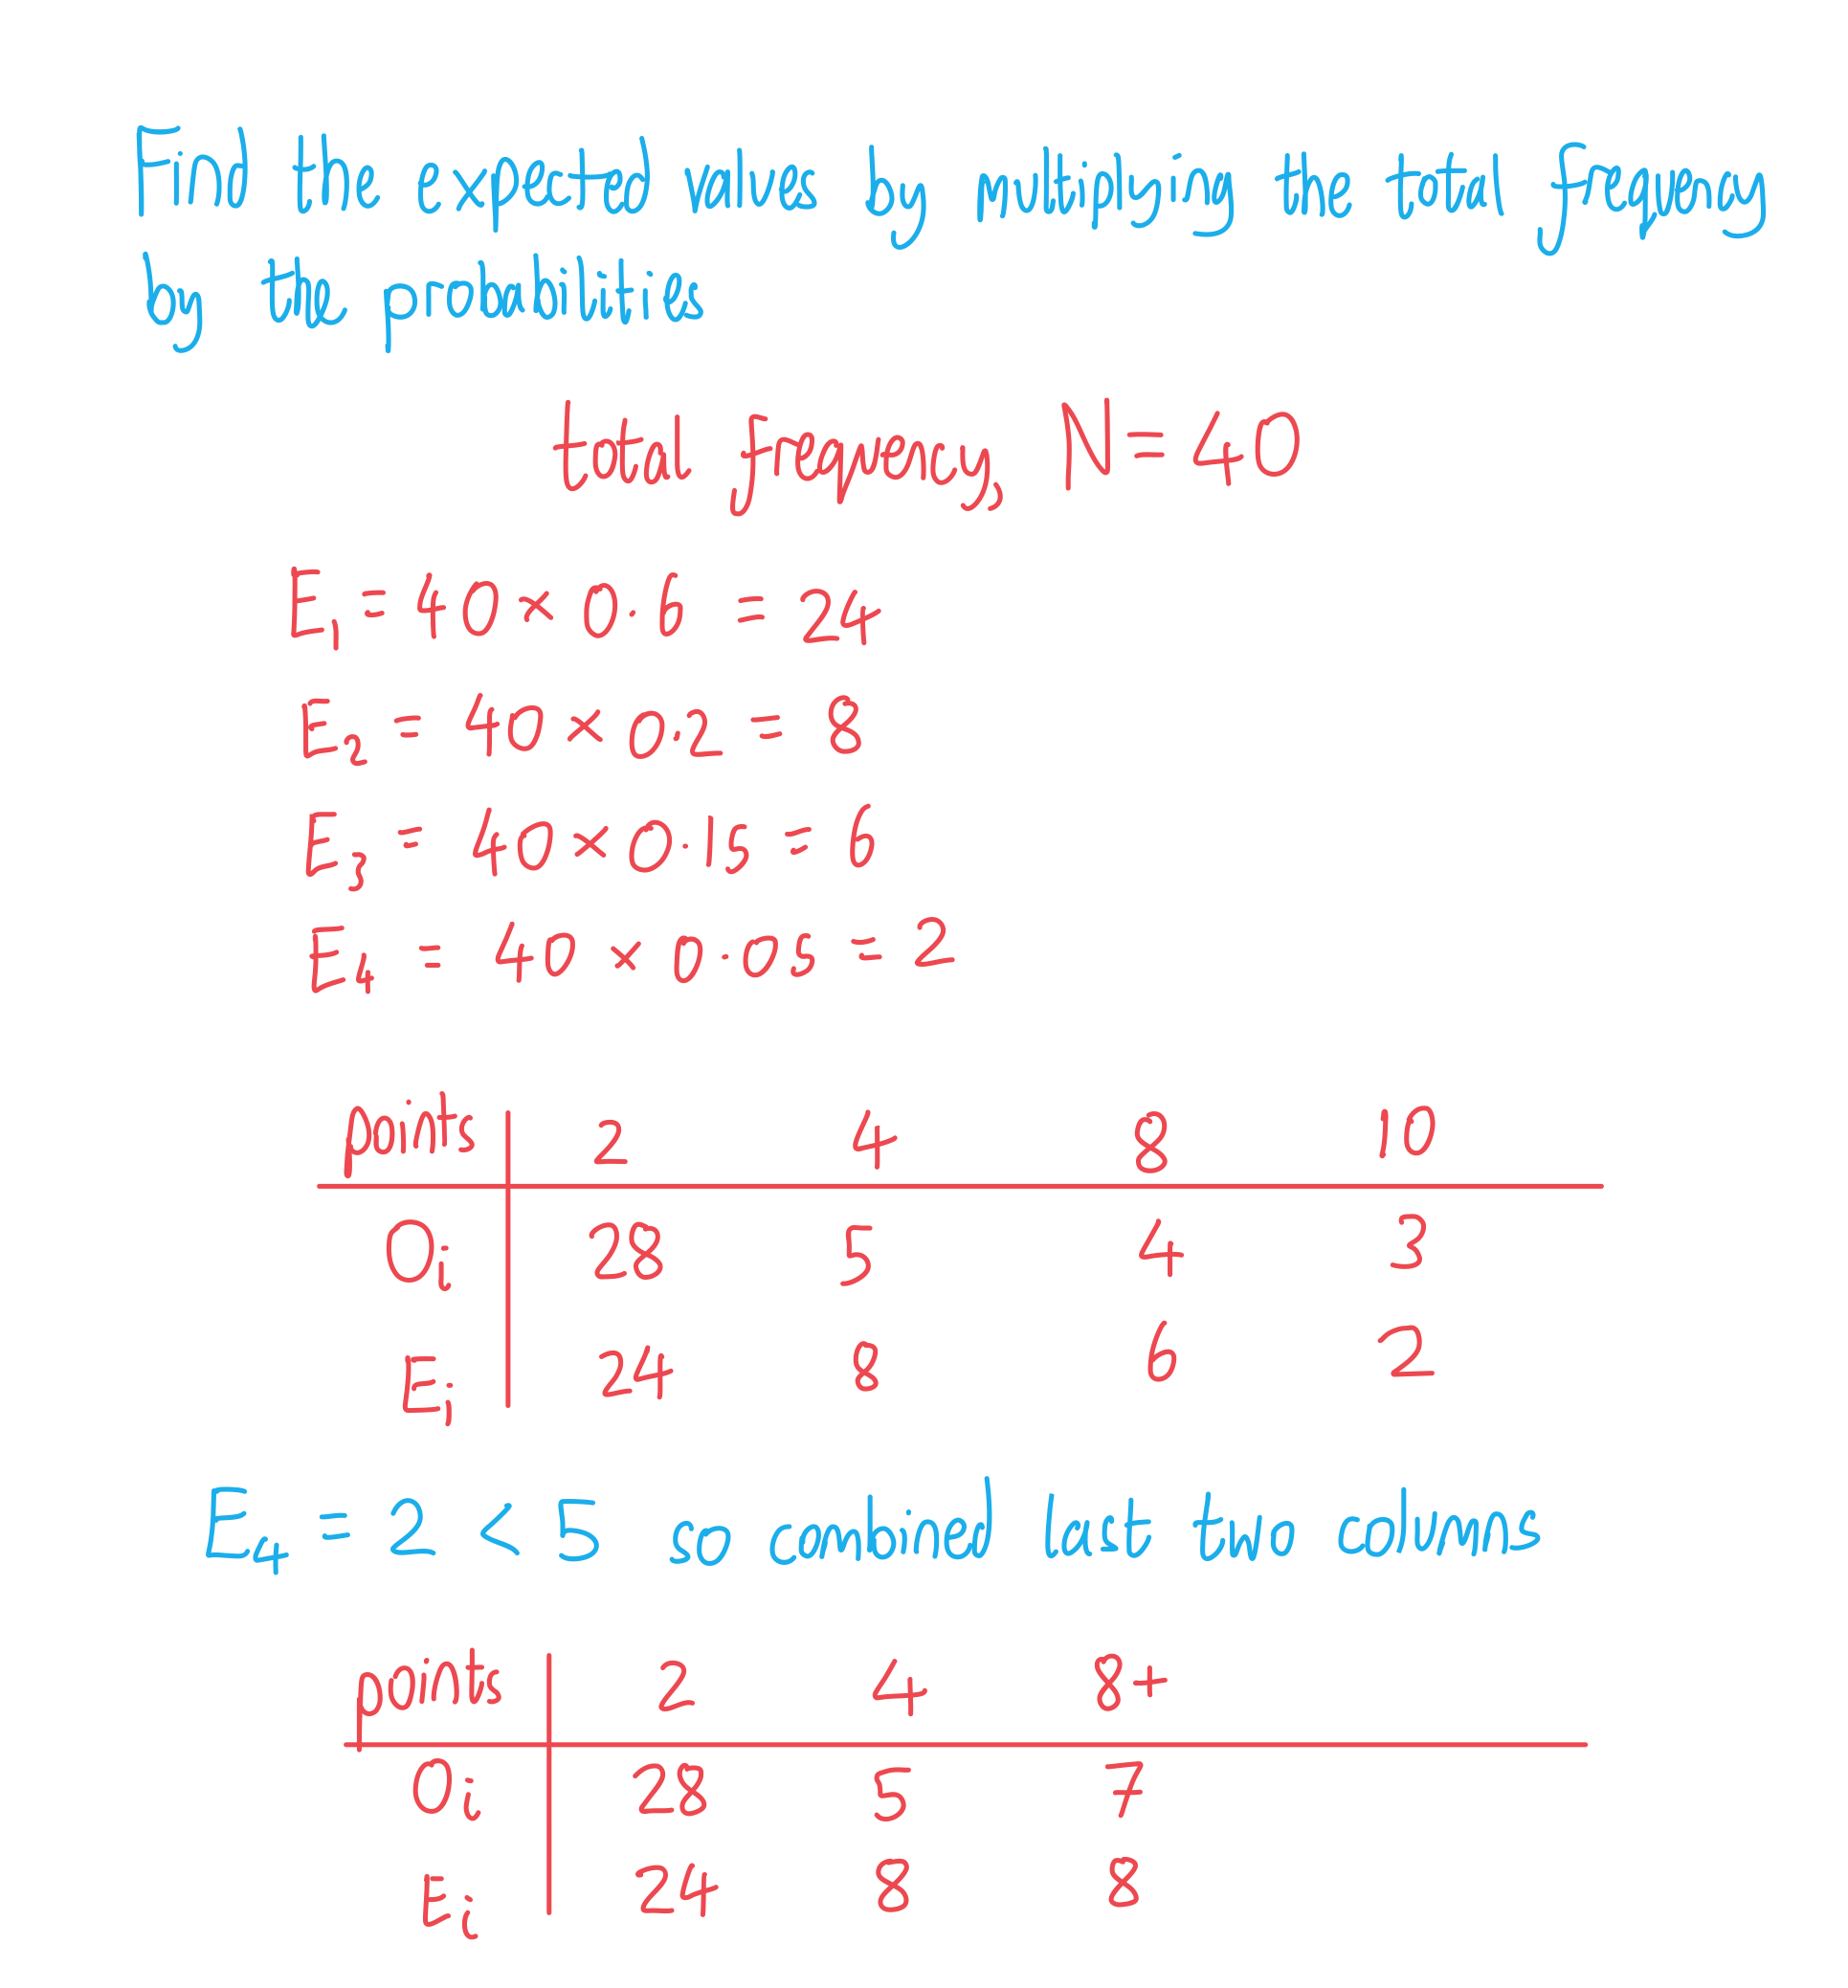
A game is meant to award points according to the probability distribution below.
Points | 2 | 4 | 8 | 10 |
Probability | 0.6 | 0.2 | 0.15 | 0.05 |
The game is played by 40 people, giving the results below.
Points | 2 | 4 | 8 | 10 |
Frequency | 28 | 5 | 4 | 3 |
Test, at the 5% level of significance, whether or not the game is operating correctly.

Unlock more, it's free!
Join the 100,000+ Students that ❤️ Save My Exams
the (exam) results speak for themselves:

Was this revision note helpful?
Build on this topic