Handling Data (OCR A Level Physics): Exam Questions

Exam code: H556

39 mins16 questions
1a
2 marks

A student investigates the motion of an air bubble rising through oil in a long vertical tube.

Two marks are drawn on the tube, a distance of 0.400 m apart. The bubble rises at a constant speed between the marks. The student uses a stopwatch to measure the time t for the bubble to rise from the lower mark to the upper mark.

The student repeats the measurement five times. The results are shown in Table 1.1.

attempt

1

2

3

4

5

t / s

2.46

2.50

2.71

2.44

2.48

Table 1.1

(i) State which value of t in Table 1.1 is anomalous.

.................................................. s

[1]

(ii) Calculate the mean value of t, ignoring the anomalous value.

mean t = .................................................. s

[1]

1b
1 mark

The student takes the absolute uncertainty in the mean value of t to be half the range of the values used to calculate it.

Calculate the absolute uncertainty in the mean value of t.

absolute uncertainty = ± .................................................. s

1c
1 mark

Calculate the speed v of the bubble.

v = .................................................. m s-1

2a
2 marks

A student determines the density ρ of cooking oil.

An empty measuring cylinder is placed on a top-pan balance. The student pours oil into the cylinder and records the volume V of oil and the reading m on the balance. More oil is added and the measurements are repeated. The results are shown in Table 1.1.

V / cm3

20.0

40.0

60.0

80.0

100.0

m / g

82.4

100.9

119.1

137.6

155.9

Table 1.1

The gradient of a graph of m against V is equal to ρ.

Use the first and last columns of results in Table 1.1 to calculate ρ.

ρ = .................................................. g cm-3

2b
2 marks

The student plots a graph of m against V. The line of best fit is straight but it does not pass through the origin.

(i) Suggest why the line does not pass through the origin.

[1]

(ii) State the type of error that causes the line not to pass through the origin.

[1]

2c
1 mark

Explain why the value of ρ found from the gradient of the graph is not affected by this error.

3a
2 marks

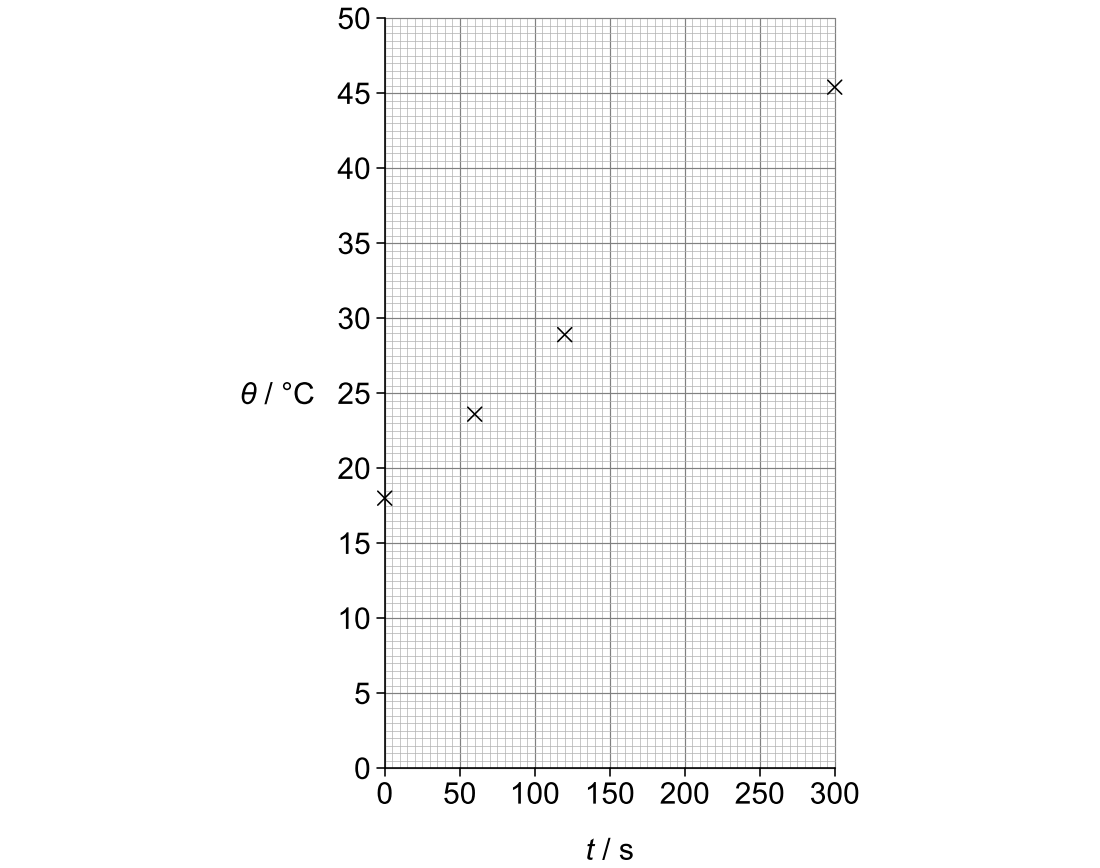
A student heats a beaker of water using an electrical immersion heater. The student stirs the water and records its temperature θ every 60 s. The results are shown in Table 1.1.

t / s

0

60

120

180

240

300

θ / °C

18.0

23.6

28.9

34.5

39.8

45.4

Table 1.1

Fig. 1.1 shows four of the results plotted on a graph of θ against t.

Graph grid: θ / °C from 0 to 50 (one small square 0.5 °C) against t / s from 0 to 300 (one small square 5 s). Crosses at (0 s, 18.0 °C), (60 s, 23.6 °C), (120 s, 28.9 °C) and (300 s, 45.4 °C).

Fig. 1.1

(i) On Fig. 1.1, plot the results for t=180 s and t=240 s.

[1]

(ii) Draw a straight line of best fit through the data points.

[1]

3b
1 mark

Use your line of best fit to determine the time at which the temperature of the water is 30.0 °C.

time = .................................................. s

3c
1 mark

The student extends the line of best fit to predict the temperature of the water at t=600 s.

Suggest why this prediction may not be correct.

1a
3 marks

As light passes through a substance its intensity decreases exponentially with distance.

Ix=I0e−μx

Ix is the intensity of light at a given thickness of jelly
I0 is the intensity of light immediately before it enters the jelly
μ is the constant of proportionality
x is the thickness of the jelly that the light has passed through.

Some students are studying the absorption of visible light by red jelly. They set up the experiment below.

Block diagram: filament bulb, then jelly of different thicknesses, then light meter, joined by arrows.
  • The power to the bulb is kept constant

  • The distance between the bulb and the light meter is kept constant

  • Blocks of jelly of different thickness are used

  • They measure the intensity of light using a light meter

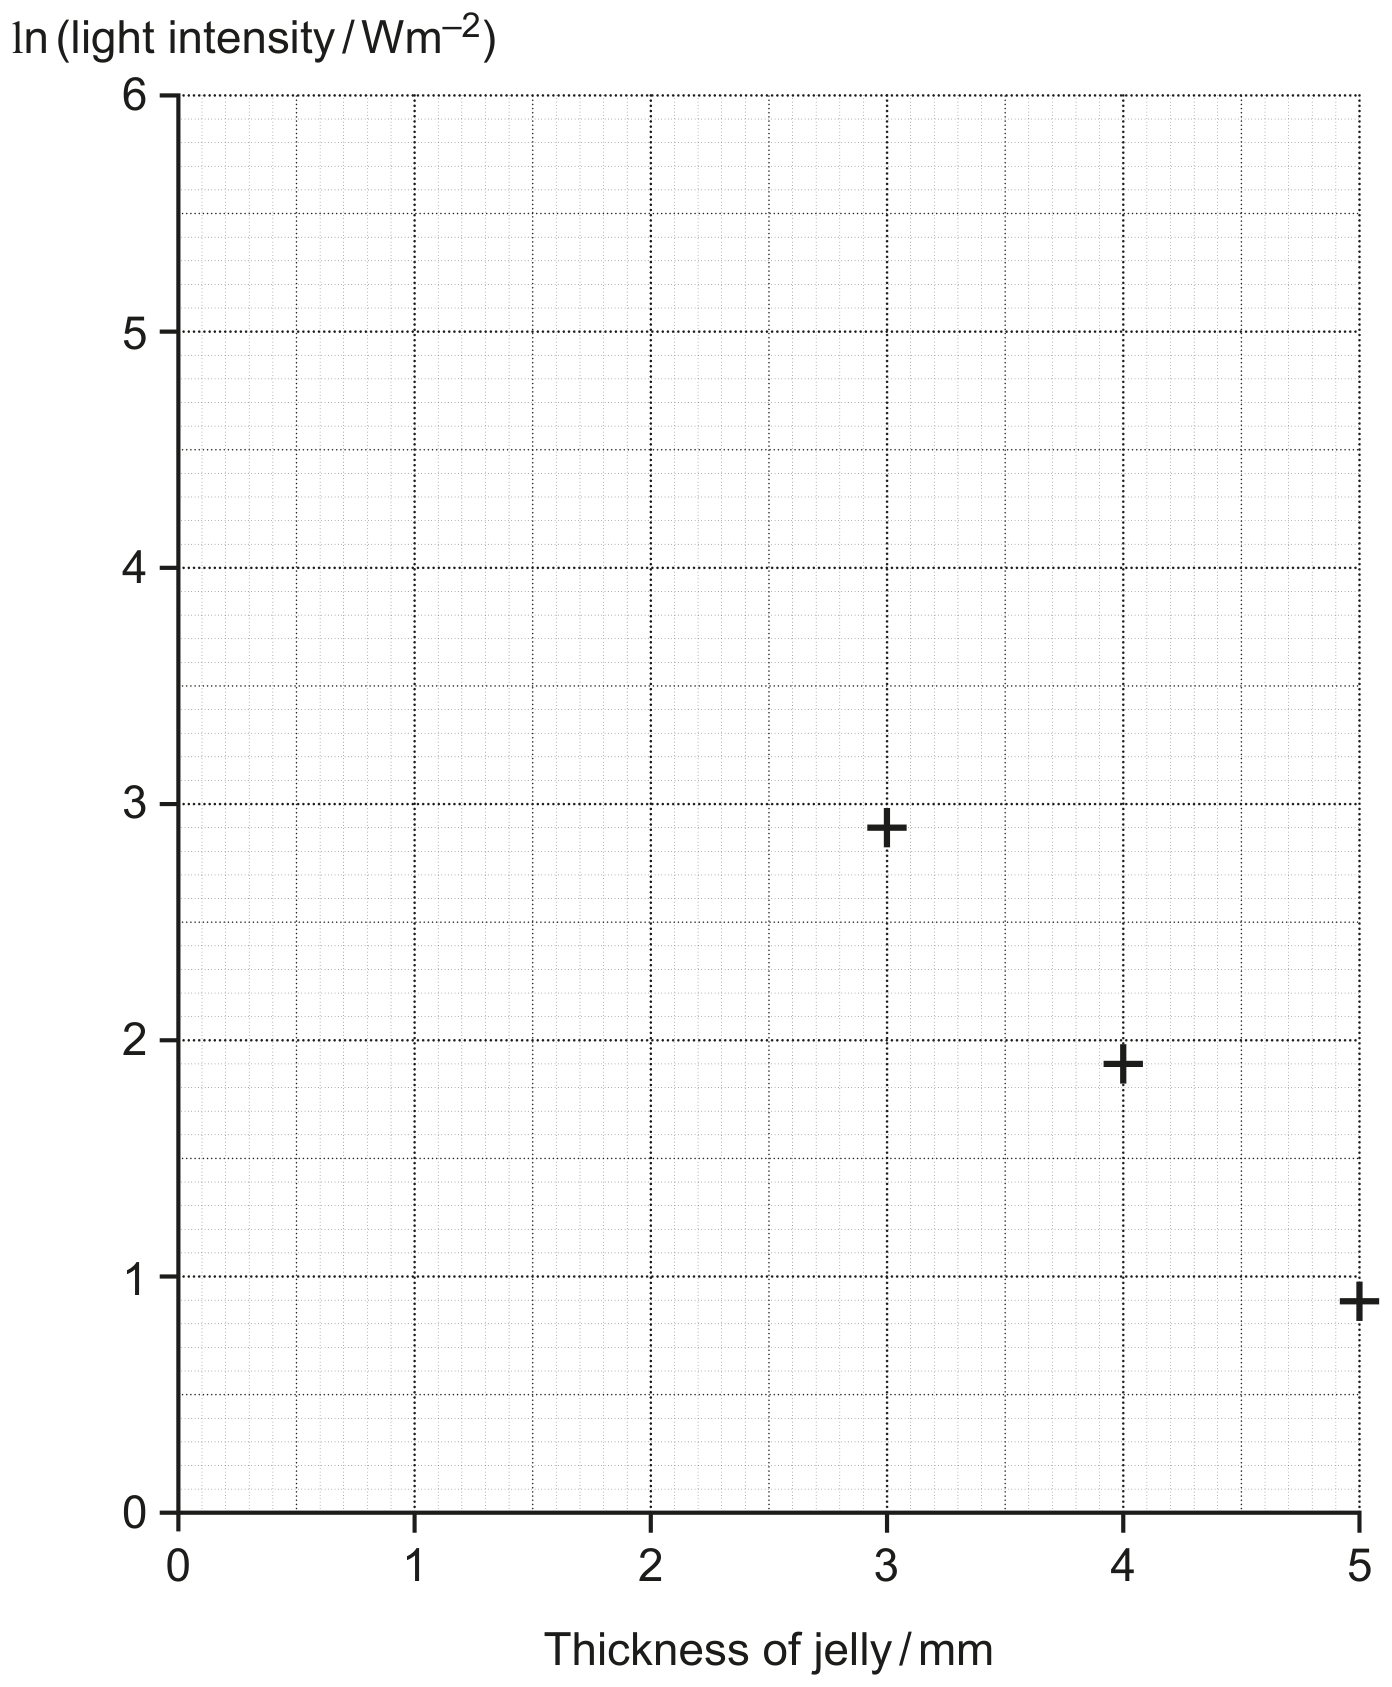
The table below shows their results and the natural log of the light intensity.

Thickness of jelly / mm

Light intensity / W m-2

ln (light intensity / W m-2)

1

122

2

46.5

3

17.8

2.88

4

6.82

1.92

5

2.62

0.960

(i) Complete the last column of the results table for the 1 mm and 2 mm thicknesses of jelly.

[1]

(ii) Plot the results from the table on the graph. Three points have already been plotted.

[1]

Graph grid: ln (light intensity / W m⁻²) from 0 to 6 against thickness of jelly / mm from 0 to 5. Small squares are 0.1 on both axes. Crosses are plotted for 3, 4 and 5 mm.

(iii) Draw a best-fit straight line through your data points.

[1]

1b
6 marks

(i) Show how the equation for exponential absorption of light can give a straight line graph with a negative gradient.

[2]

(ii) Use your graph to determine the intensity of the light I0 before it enters the jelly.

I0 = .................................... W m-2

[2]

(iii) Use your graph to determine the constant of proportionality μ in units of mm-1.

μ = .................................... mm-1

[2]

1c
5 marks

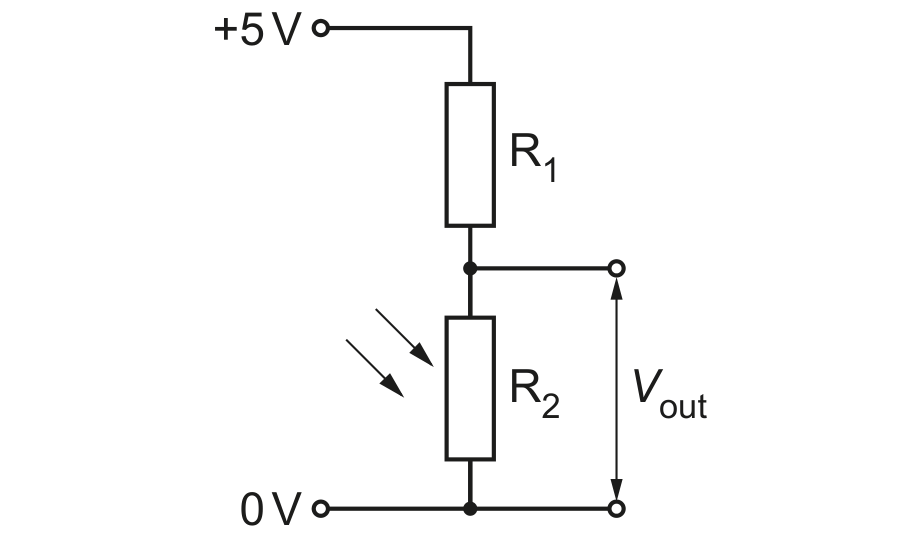
The students decide to make their own light meter using this circuit.

Potential divider: fixed resistor R1 and light-dependent resistor R2 in series between +5 V and 0 V. Vout is taken across R2.

The value of R1 is 5 kΩ. The value of R2 was 100 Ω when 1 mm jelly was used and 8 kΩ when 5 mm jelly was used.

(i) Calculate the output voltage range obtained in this experiment.

range = .................................... V

[2]

(ii) Describe two ways the output voltage range could be increased.

1 ....................................................................................................

2 ....................................................................................................

[2]

(iii) Explain how the circuit responds to a change in light intensity.

[1]