Use of Measuring Instruments & Electrical Equipment (OCR A Level Physics): Exam Questions

Exam code: H556

1 hour21 questions
1a
2 marks

A student measures the resistance R of a resistor.

The resistor is connected in series with an analogue ammeter and a d.c. power supply. A digital voltmeter is connected across the resistor.

Fig. 1.1 shows the scale of the ammeter during the experiment.
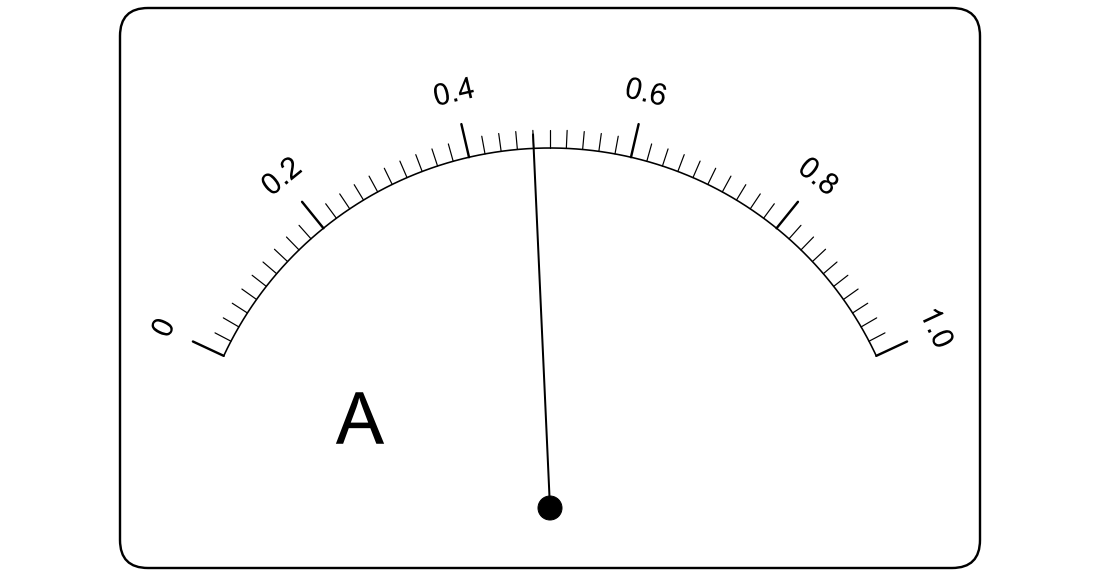
Analogue ammeter scale from 0 to 1.0 A, with labelled marks every 0.2 A and ten equal small divisions between labelled marks. The pointer lies exactly on the fourth small mark after the 0.4 label.

Fig. 1.1

(i) State the resolution of the ammeter.

resolution = .................................................. A

[1]

(ii) State the reading I on the ammeter.

I = .................................................. A

[1]

1b
2 marks

The digital voltmeter reads 3.36 V.

Calculate the resistance R of the resistor.

R = .................................................. Ω

1c
1 mark

State one precaution the student should take when reading the analogue ammeter, so that the reading is accurate.

2a
2 marks

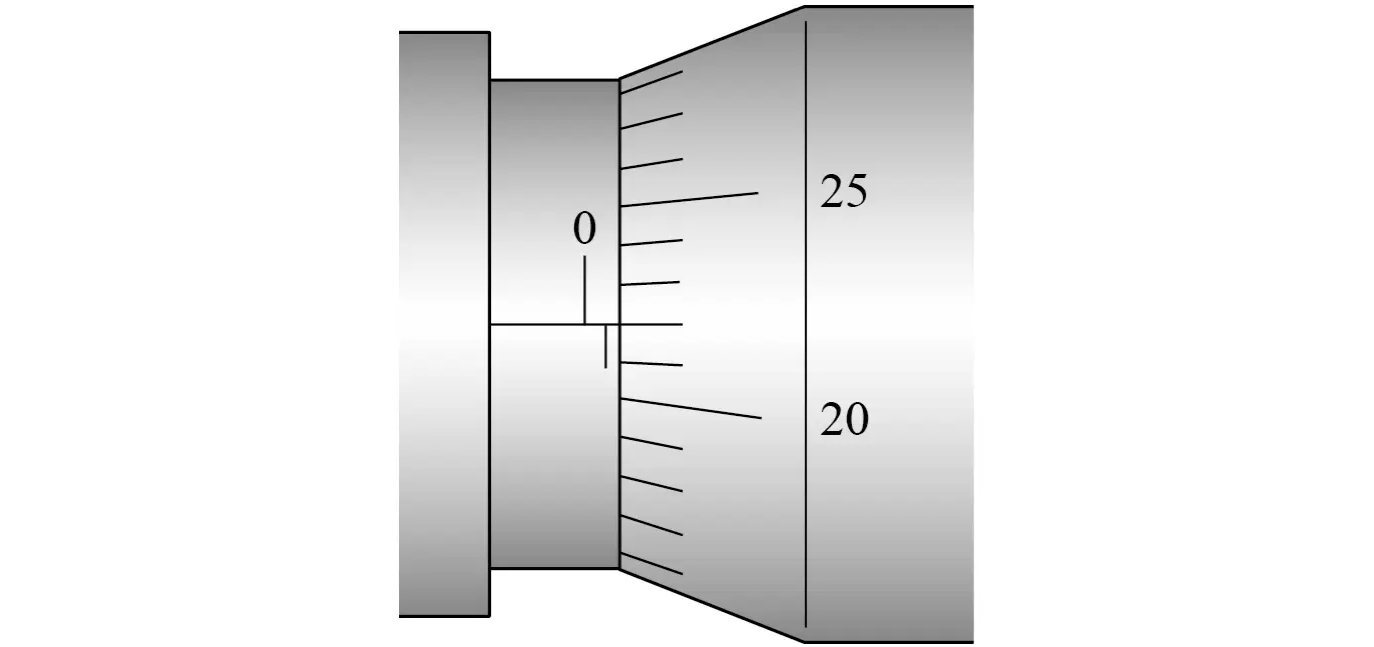
A student measures the diameter d of a thin steel wire with a micrometer. The micrometer has no zero error.

Fig. 1.1 shows the micrometer scales for one measurement of d.

Micrometer sleeve with millimetre marks above the datum line and half-millimetre marks below; the thimble edge is just past the first half-millimetre mark. Thimble of 50 divisions labelled every 5; line 22 is on the datum line.

Fig. 1.1

(i) State the reading on the micrometer.

d = .................................................. mm

[1]

(ii) The student closes the micrometer onto the wire by turning the ratchet, rather than the thimble, until the ratchet clicks.

Suggest why.

[1]

2b
2 marks

The student repeats the measurement of d at several points along the wire. At each point, she takes a second reading with the micrometer turned through 90° around the wire.

(i) Suggest why she takes readings at several points along the wire.

[1]

(ii) Suggest why she turns the micrometer through 90° at each point.

[1]

3a
1 mark

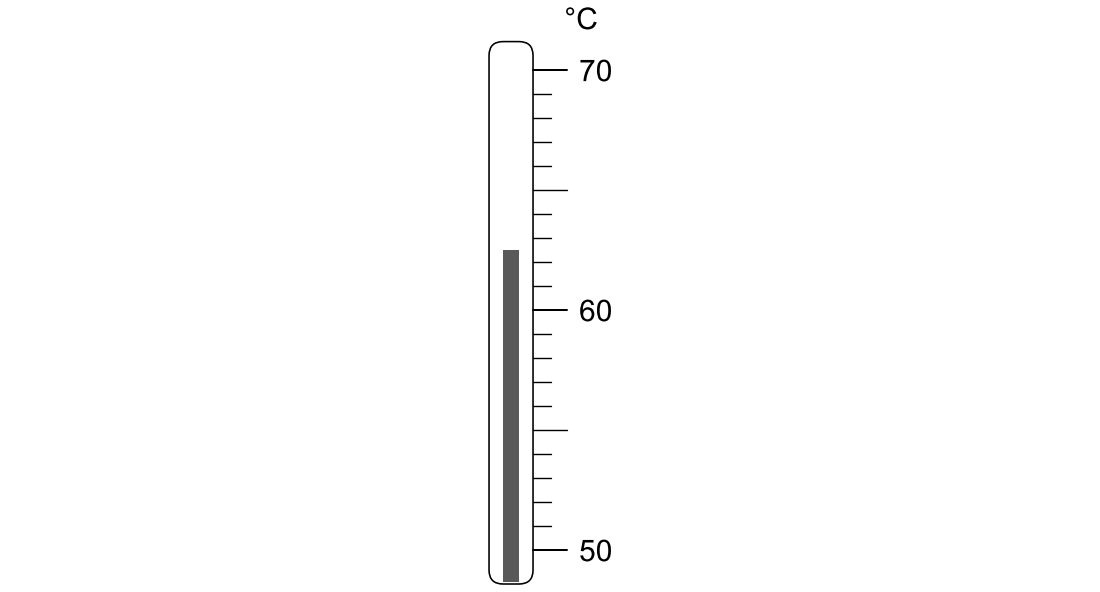
A student investigates the cooling of hot water in a beaker. A temperature sensor connected to a data logger records the temperature of the water.

To check the sensor, the student places a liquid-in-glass thermometer in the water next to the sensor. Fig. 1.1 shows part of the thermometer scale at one instant.

Thermometer scale from 50 to 70 °C, marks every 1 °C, labelled every 10 °C. The top of the liquid column is halfway between the second and third marks above the 60 label.

Fig. 1.1

State the reading on the thermometer.

temperature = .................................................. °C

3b
2 marks

At the same instant, the data logger shows a temperature of 63.4 °C.

Taking the thermometer reading as the correct value, calculate the percentage difference between the two readings.

percentage difference = .................................................. %

3c
1 mark

The data logger records the temperature every 10 s for 30 minutes.

State one advantage of using the data logger, rather than the student reading the thermometer by eye, to record the temperature.

1a
2 marks

A student investigates the oscillations of a mass hanging from a spring. She pulls the mass down a short distance and releases it. She uses a hand-held stopwatch to measure the time for 10 complete oscillations.

She repeats the timing three times. Her results are shown in Table 1.1.

timing

time for 10 oscillations / s

1

8.42

2

8.61

3

8.37

Table 1.1

Calculate the mean period T of the oscillations.

T = .................................................. s

1b
2 marks

The student estimates that the uncertainty in each timing in Table 1.1 is ± 0.2 s.

Calculate the percentage uncertainty in T.

percentage uncertainty = .................................................. %

1c
2 marks

Explain why timing 10 oscillations, rather than one oscillation, gives a smaller percentage uncertainty in T.

2a
1 mark

A student investigates the frictional force between a wooden block and a sloping board. One end of the board rests on a support so that the board slopes at a fixed angle.

The student attaches an analogue newton-meter to the block. She always holds the newton-meter parallel to the board.

State one safety precaution the student should take during this experiment.

2b
3 marks

The student pulls the block up the board at a steady speed. The newton-meter reads 4.5 N.

She then lets the block slide down the board at a steady speed, holding it back with the newton-meter. The newton-meter now reads 1.1 N.

The frictional force on the block has the same size in both cases.

Determine the frictional force F on the block.

F = .................................................. N

2c
2 marks

The student repeats the measurement of the pull needed to move the block up the board at a steady speed. Her three readings are 4.5 N, 4.8 N and 4.3 N.

Explain why the readings differ, and suggest how the student could obtain a more reliable value for the pull.

3a
3 marks

A student determines the density of the metal of a solid cylinder.

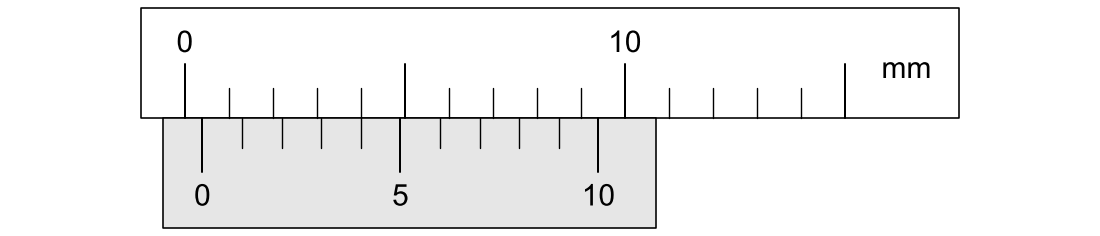
She measures the length L of the cylinder with a pair of vernier calipers. Fig. 1.1 shows the scales of the calipers when the jaws are closed, with nothing between them.

Vernier calipers, jaws closed. Main scale marked every 1 mm, labelled every 10 mm; vernier scale of 10 divisions spanning 9 mm. The vernier zero is just right of the main-scale zero; vernier line 4 lines up with a main-scale mark.

Fig. 1.1

(i) State the zero error of the calipers.

zero error = .................................................. mm

[1]

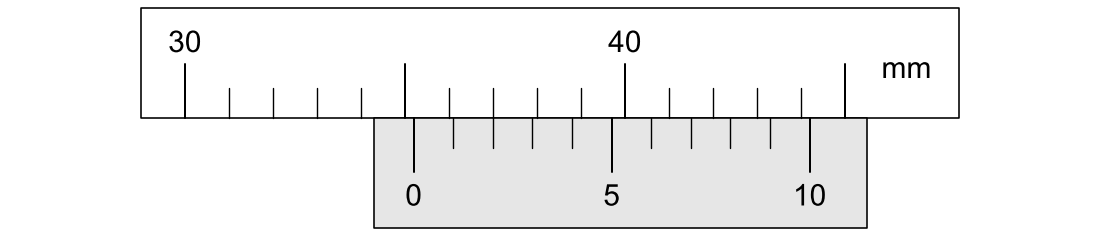
(ii) Fig. 1.2 shows the scales when the cylinder is held between the jaws.

Vernier calipers holding the cylinder. Main scale marked every 1 mm; vernier scale of 10 divisions spanning 9 mm. The vernier zero lies between the 35 and 36 mm marks; vernier line 2 lines up with a main-scale mark.

Fig. 1.2

Determine the length L of the cylinder.

L = .................................................. mm

[2]

3b
3 marks

The diameter d of the cylinder is 12.00 mm. The mass m of the cylinder, measured with a top-pan balance, is 33.5 g.

Calculate the density ρ of the metal.

ρ = .................................................. kg m-3

3c
2 marks

Another student measures the same cylinder with the same calipers, but she forgets to correct her reading for the zero error. She uses the same values of d and m.

Explain how this affects her value of the density ρ.

1a
3 marks

A student investigates the speed v of sound in air.

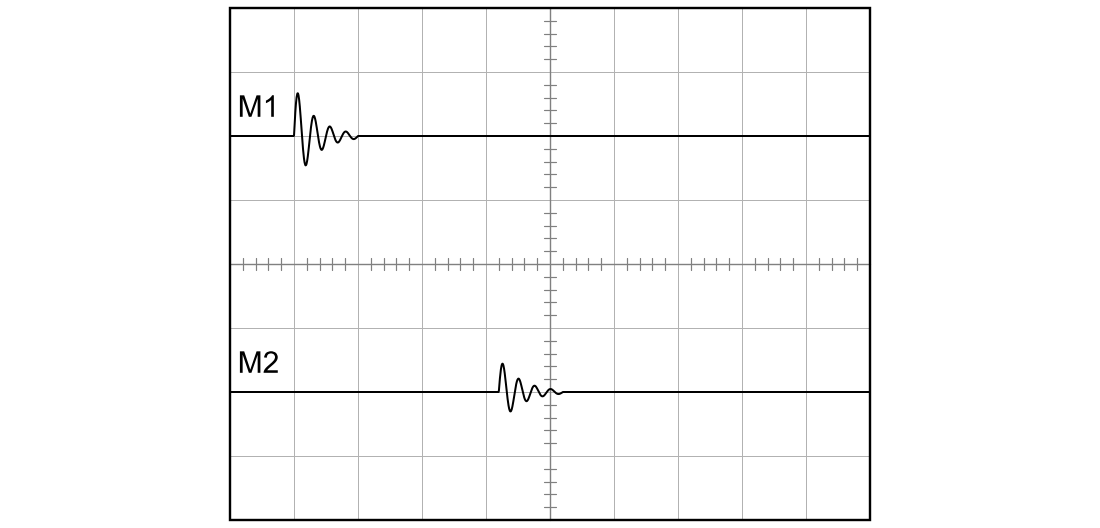
A loudspeaker connected to a signal generator emits short pulses of sound. Two microphones, M1 and M2, are placed in a straight line with the loudspeaker, with M1 nearer to the loudspeaker. The distance between the microphones is d.

Each microphone is connected to one input of a dual-trace oscilloscope. Both traces use the same time-base setting, so the time t between the start of the pulse at M1 and the start of the pulse at M2 can be measured.

Fig. 1.1 shows the two traces when d=0.50 m. The time-base is set to 0.5 ms div−1.

Oscilloscope screen 10 divisions wide and 8 high, centre lines marked every 0.2 division. Upper trace M1: flat, then a pulse starting 1.0 division from the left edge. Lower trace M2: flat, then a smaller pulse starting 4.2 divisions from the left edge.

Fig. 1.1

(i) Determine the time t.

t = .................................................. ms

[1]

(ii) The student can locate the start of each pulse to within ± 0.1 division.

Show that the percentage uncertainty in t is about 6 %.

[2]

1b
5 marks

The student varies d and measures t for each value of d. The time-base is kept at 0.5 ms div−1. Each value of t is the mean of several repeat readings. The results are shown in Table 1.1.

d / m

t / ms

0.20

0.72

0.40

1.31

0.60

1.89

0.80

2.48

1.00

3.07

1.20

3.66

Table 1.1

(i) Use the data in Table 1.1 to determine the speed v of sound in air.

v = .................................................. m s-1

[3]

(ii) The student's teacher says that the data in Table 1.1 show a systematic error.

Explain how the data show this, and suggest one possible cause of the systematic error.

[2]

1c
3 marks

Another student suggests that the time-base should be changed to 0.2 ms div−1 for every reading in Table 1.1, to reduce the percentage uncertainty in each value of t.

The oscilloscope screen is 10 divisions wide, and the pulse at M1 always starts 1.0 division from the left-hand edge of the screen.

Evaluate this suggestion.

2a
4 marks

A student is given a sealed box with two terminals. The box contains one component, which is a fixed resistor, a filament lamp or a semiconductor diode.

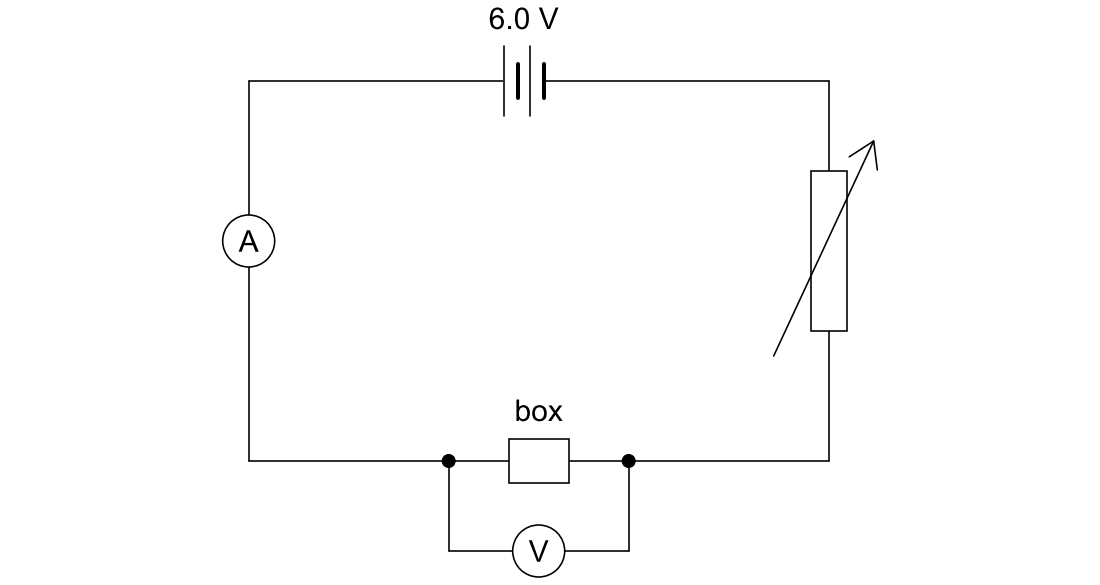
The student first sets up the circuit shown in Fig. 1.1.

Circuit diagram: a 6.0 V d.c. supply, a variable resistor, an ammeter and a box with two terminals connected in series. A voltmeter is connected across the box only.

Fig. 1.1

The power supply has an e.m.f. of 6.0 V and negligible internal resistance. The ammeter has negligible resistance. The variable resistor can be set to any resistance from zero to 30 Ω.

(i) To check the circuit, the student connects a resistor of resistance 20 Ω in place of the box.

Calculate the smallest potential difference (p.d.) that can be obtained across the 20 Ω resistor with this circuit.

p.d. = .................................................. V

[2]

(ii) The variable resistor has three terminals: one at each end of its resistance track and one on a sliding contact that can be moved along the track.

The student wants to vary the p.d. across the box from zero up to 6.0 V.

Draw a circuit diagram, using the same apparatus, that allows the student to do this.

[2]

2b
6 marks

Describe how the student should use the circuit from (a)(ii) to obtain a set of results, and explain how the results would show which component is in the box.

3a
2 marks

A student determines the acceleration of free fall g.

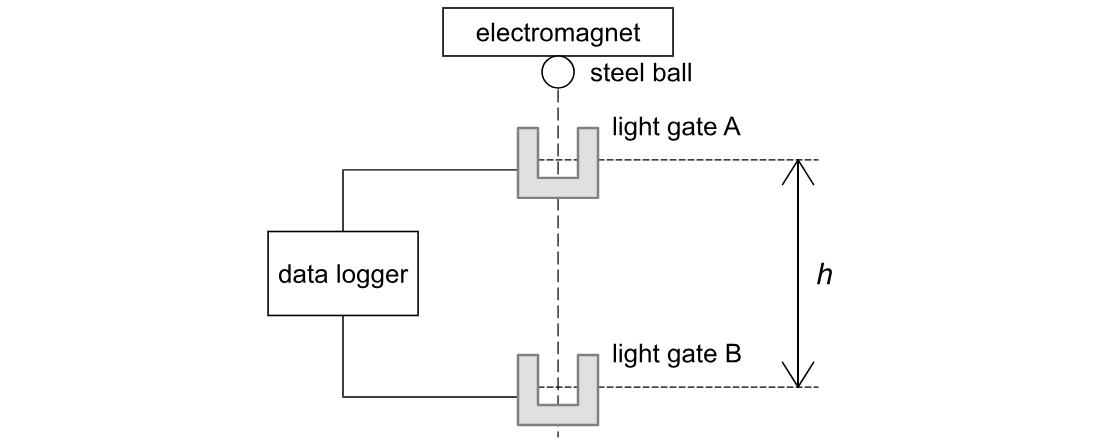
A steel ball is held by an electromagnet above two light gates, A and B, as shown in Fig. 1.1. Light gate B is directly below light gate A. When the electromagnet is switched off, the ball falls from rest through the light beam of gate A and then through the light beam of gate B.

A steel ball held under an electromagnet above two light gates, A then B, one directly below the other. The distance h between the two light beams is marked. Both gates connect to a data logger.

Fig. 1.1

Both light gates are connected to a data logger. The data logger records the time for which the ball blocks each light beam, to the nearest 0.01 ms. The student measures the diameter d of the ball with a micrometer.

The student's measurements are shown in Table 1.1.

measurement

value

diameter d of the ball

20.00 mm

vertical distance h between the two light beams

0.500 m

time tA for which the ball blocks the beam of gate A

10.85 ms

time tB for which the ball blocks the beam of gate B

5.40 ms

Table 1.1

Explain why the student uses light gates and a data logger, rather than a stopwatch, to measure tA and tB. A typical human reaction time is about 0.2 s.

3b
4 marks

Use the data in Table 1.1 to determine a value for g.

g = .................................................. m s-2

3c
2 marks

The accepted value of g is 9.81 m s−2. The student estimates that the uncertainty in her value of g is ±0.1 m s−2.

Explain what this shows about the errors in the student's experiment.

3d
4 marks

The student's value of g is greater than the accepted value.

(i) The student suggests that air resistance on the ball caused the difference between her value and the accepted value.

Evaluate this suggestion.

[2]

(ii) Suggest one other possible cause of the difference, and explain how it makes her value of g too large.

[2]