Functions & Rates of Change (College Board AP® Precalculus): Exam Questions

45 mins33 questions
1
Sme Calculator
1 mark

A function W models the volume of water in a tank, in gallons, t minutes after a valve is opened. Which of the following correctly identifies the independent variable and the dependent variable for the function W?

  • The independent variable is time, and the dependent variable is the rate of flow.

  • The independent variable is time, and the dependent variable is the volume of water.

  • The independent variable is the volume of water, and the dependent variable is the rate of flow.

  • The independent variable is the volume of water, and the dependent variable is time.

2
Sme Calculator
1 mark
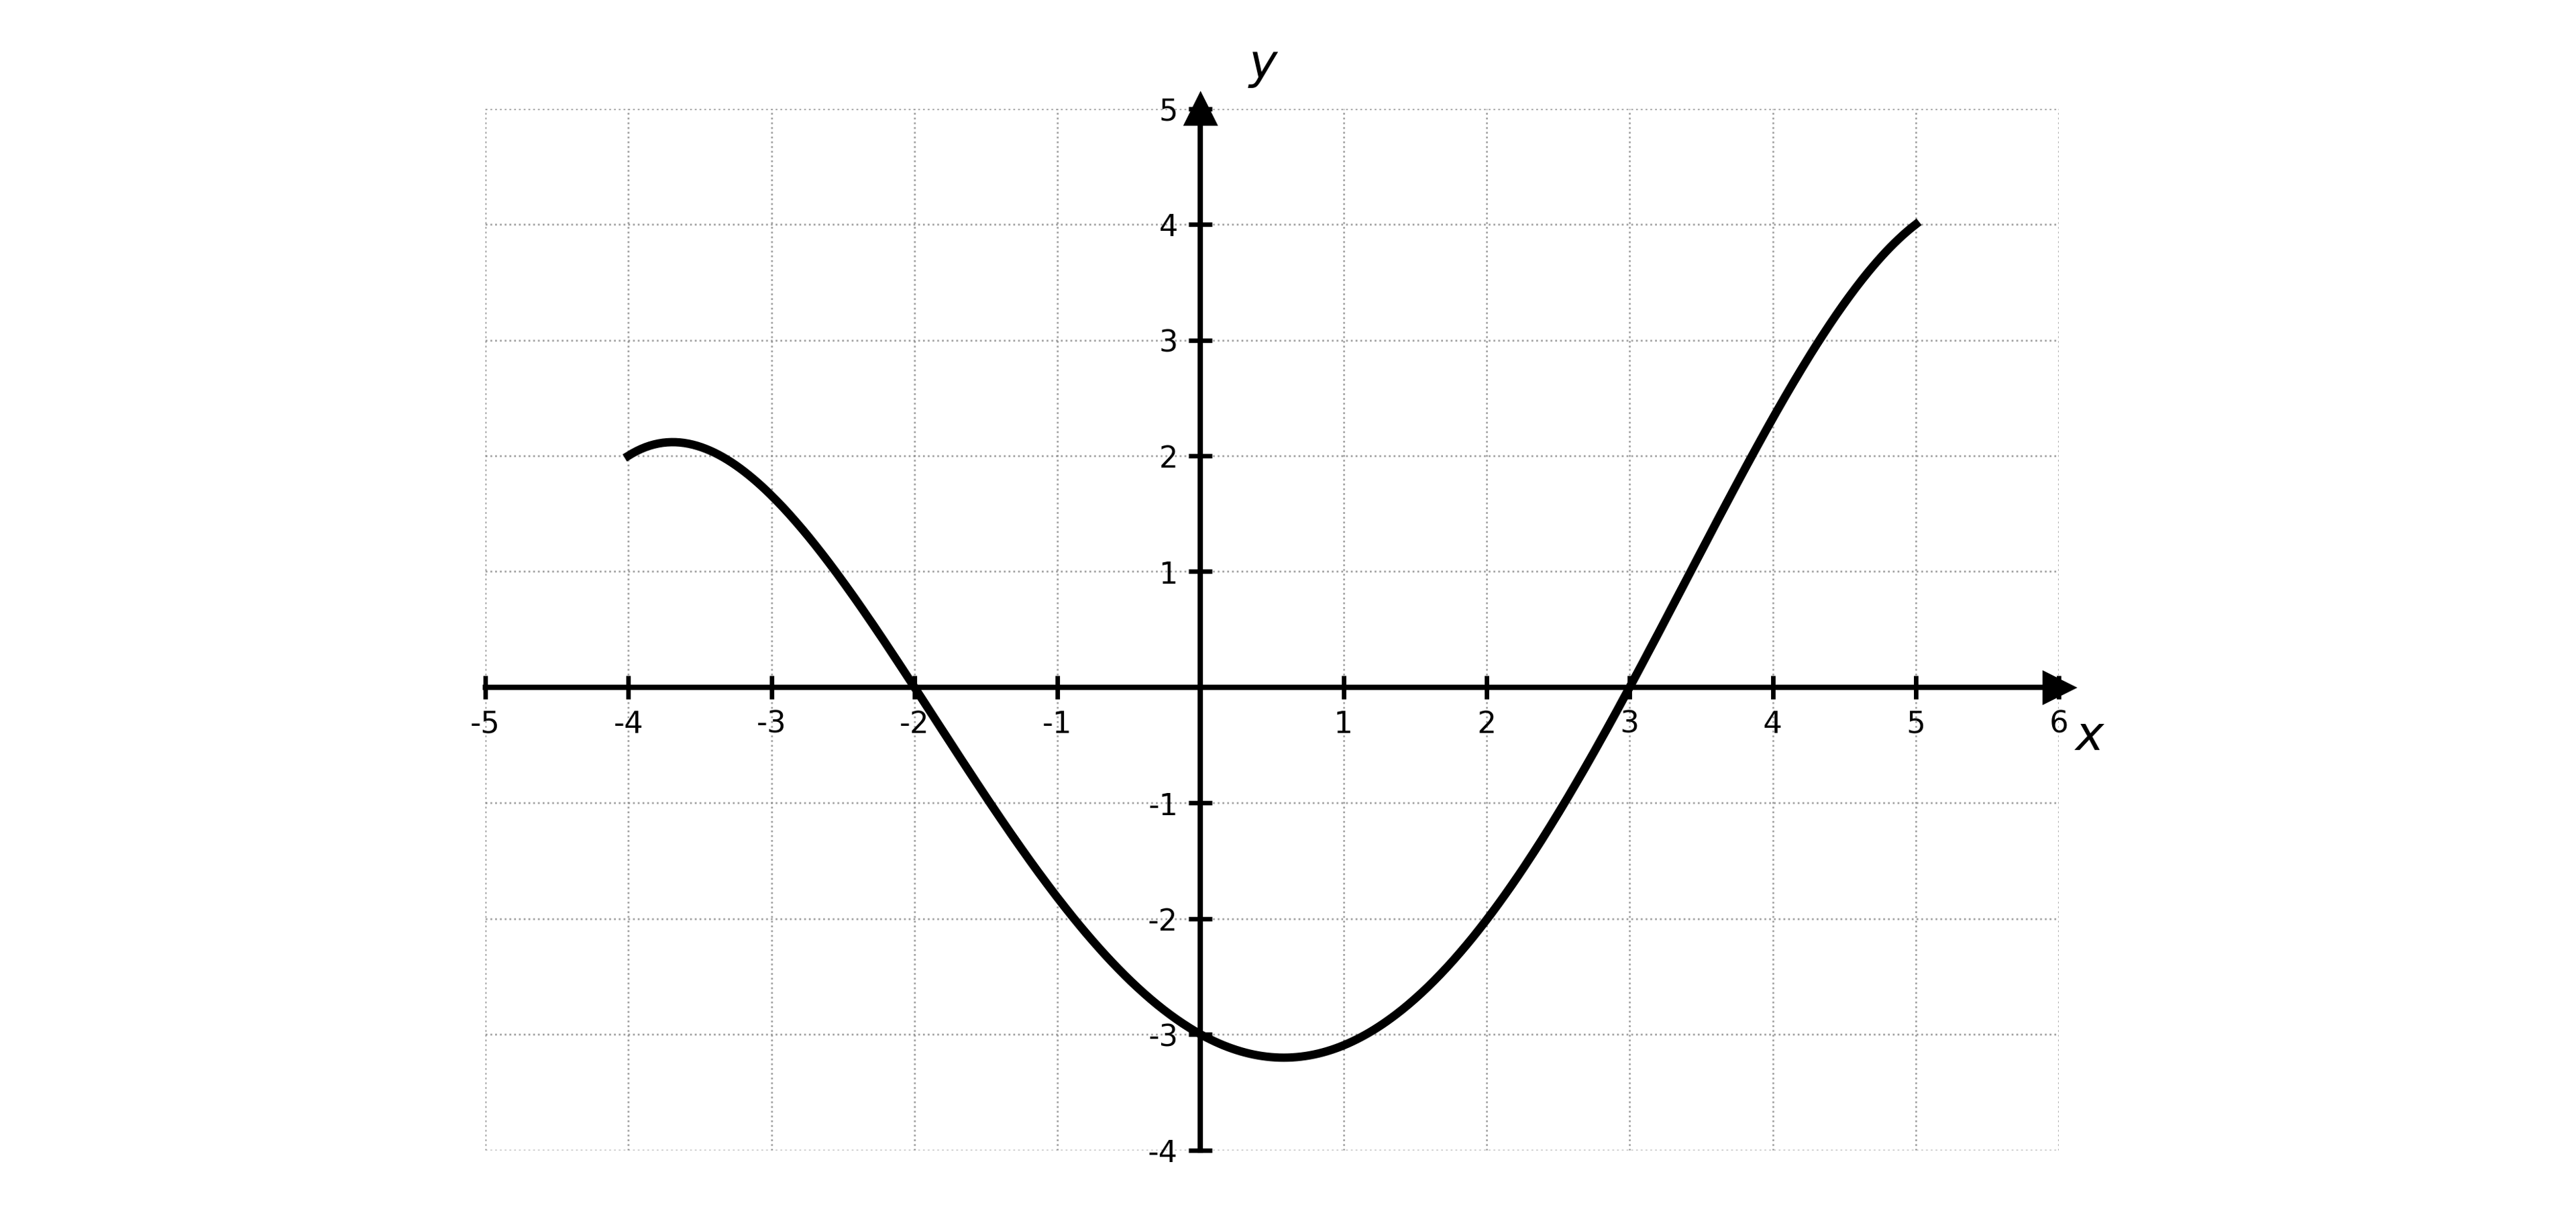
Graph of a smooth curve crossing the x-axis at x = −2 and x = 3, with a minimum near (0, −3) and increasing steeply to (5, 4).
Graph of f

The graph of a function space f is shown in the x y-plane.

What are the zeros of space f?

  • x equals 0 only

  • x equals negative 2 and x equals 3

  • space y equals negative 3 only

  • space y equals 0 and space y equals 4

3
Sme Calculator
1 mark

The table below gives selected values of a function space f.

space x

0

1

2

3

4

space f open parentheses x close parentheses

1

5

11

19

29

The values of space f are increasing as x increases. Which of the following statements about the graph of space f for 0 less or equal than x less or equal than 4 is true?

  • The graph of space f is concave down on 0 less or equal than x less or equal than 4, because the average rates of change of space f over consecutive equal-length input-value intervals are increasing.

  • The graph of space f is concave down on 0 less or equal than x less or equal than 4, because the values of space f are increasing as x increases.

  • The graph of space f is concave up on 0 less or equal than x less or equal than 4, because the average rates of change of space f over consecutive equal-length input-value intervals are increasing.

  • The graph of space f is concave up on 0 less or equal than x less or equal than 4, because the values of space f are increasing as x increases.

4
Sme Calculator
1 mark

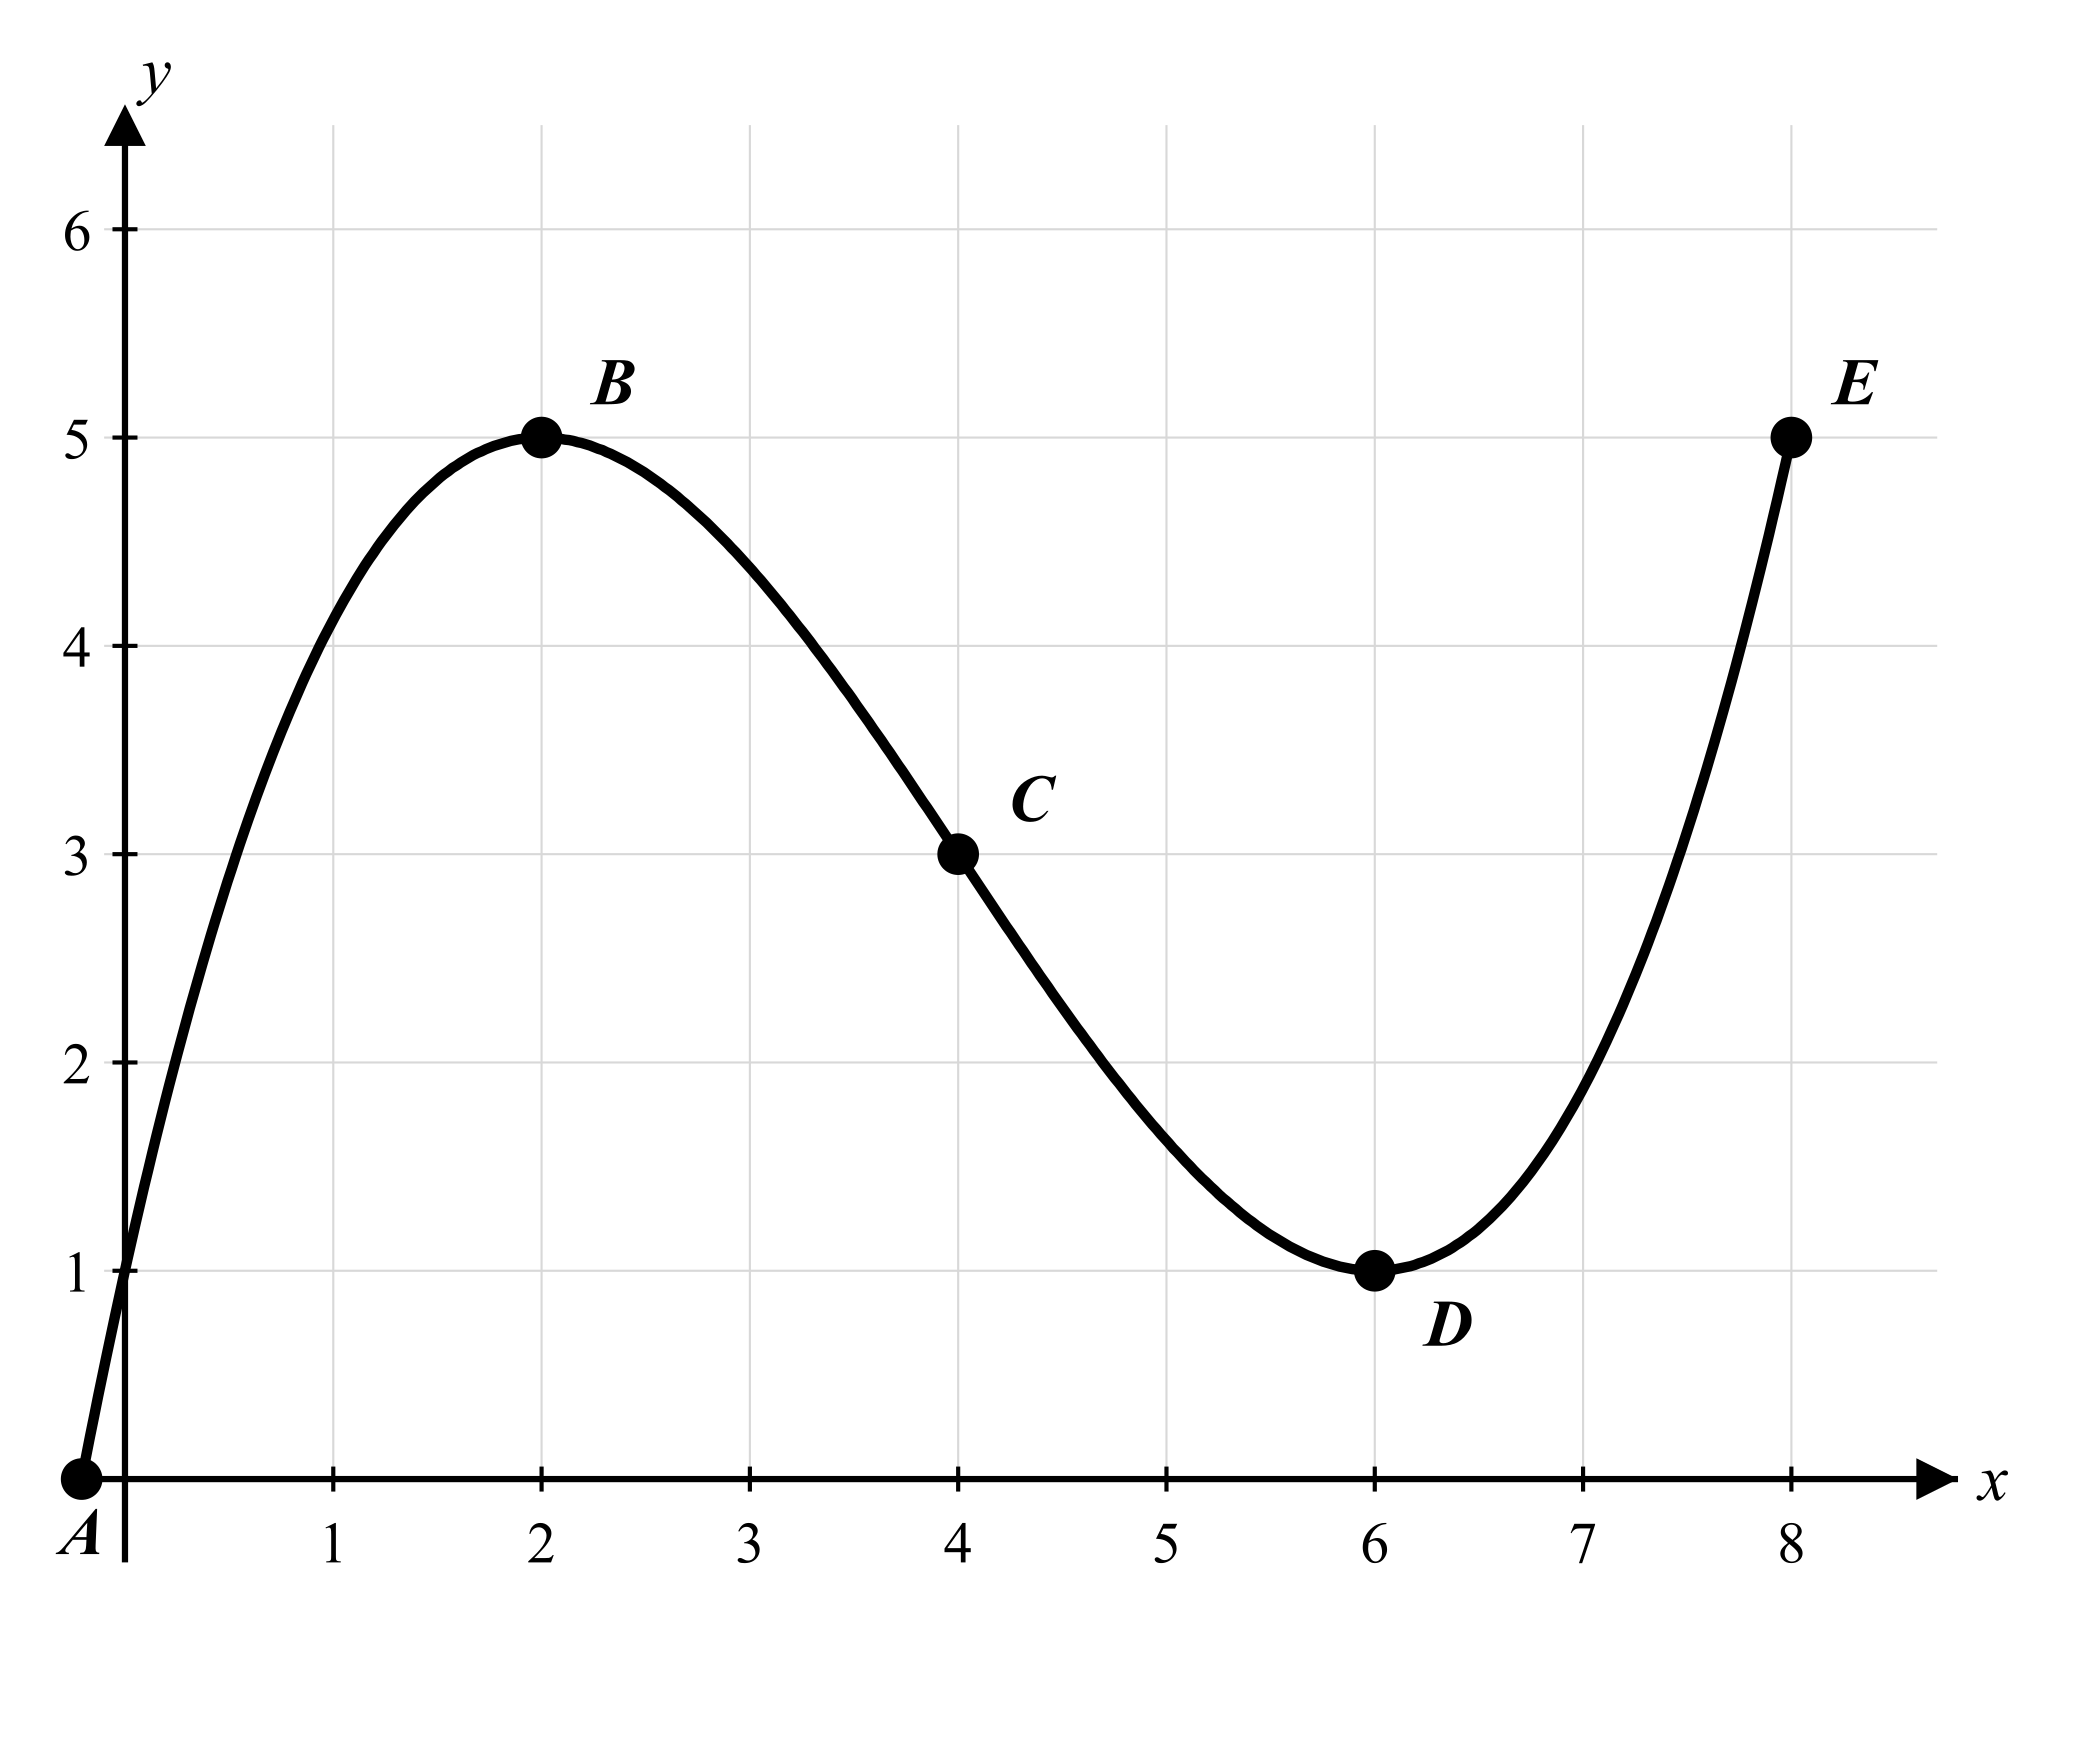
The figure shows the graph of a function g. The zero and extrema for g are labeled, and the point of inflection of the graph of g is labeled. Let A, B, C, D, and E represent the x-coordinates at those points.

Graph of cubic-looking  g on the xy-plane. The curve passes through point A (a zero near x=0), rises to a local maximum at B (2, 5), passes through point of inflection C (4, 3), decreases to a local minimum at D (6, 1), then rises to E  (8, 5).
Graph of g

Of the following, on which interval is g decreasing and the graph of g concave up?

  • the interval from A to B

  • the interval from B to C

  • the interval from C to D

  • the interval from D to E

5
Sme Calculator
1 mark

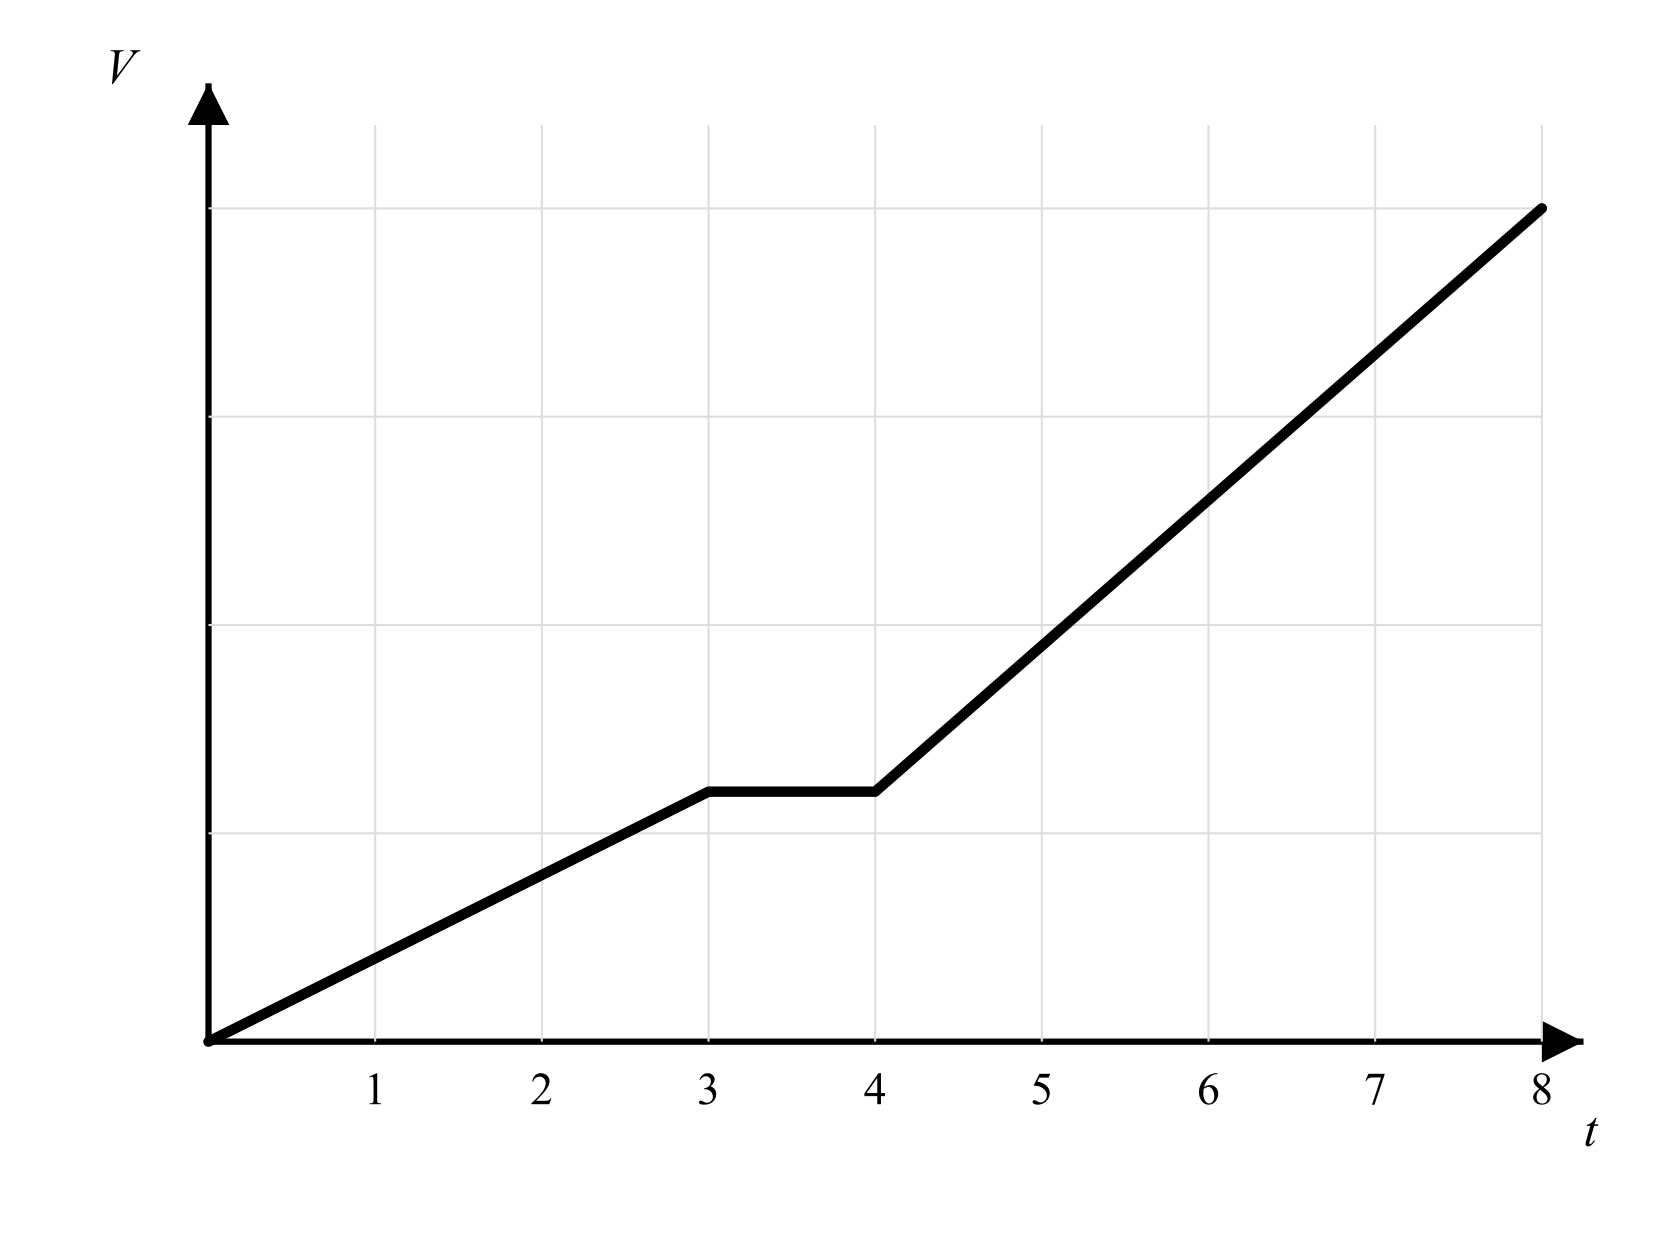
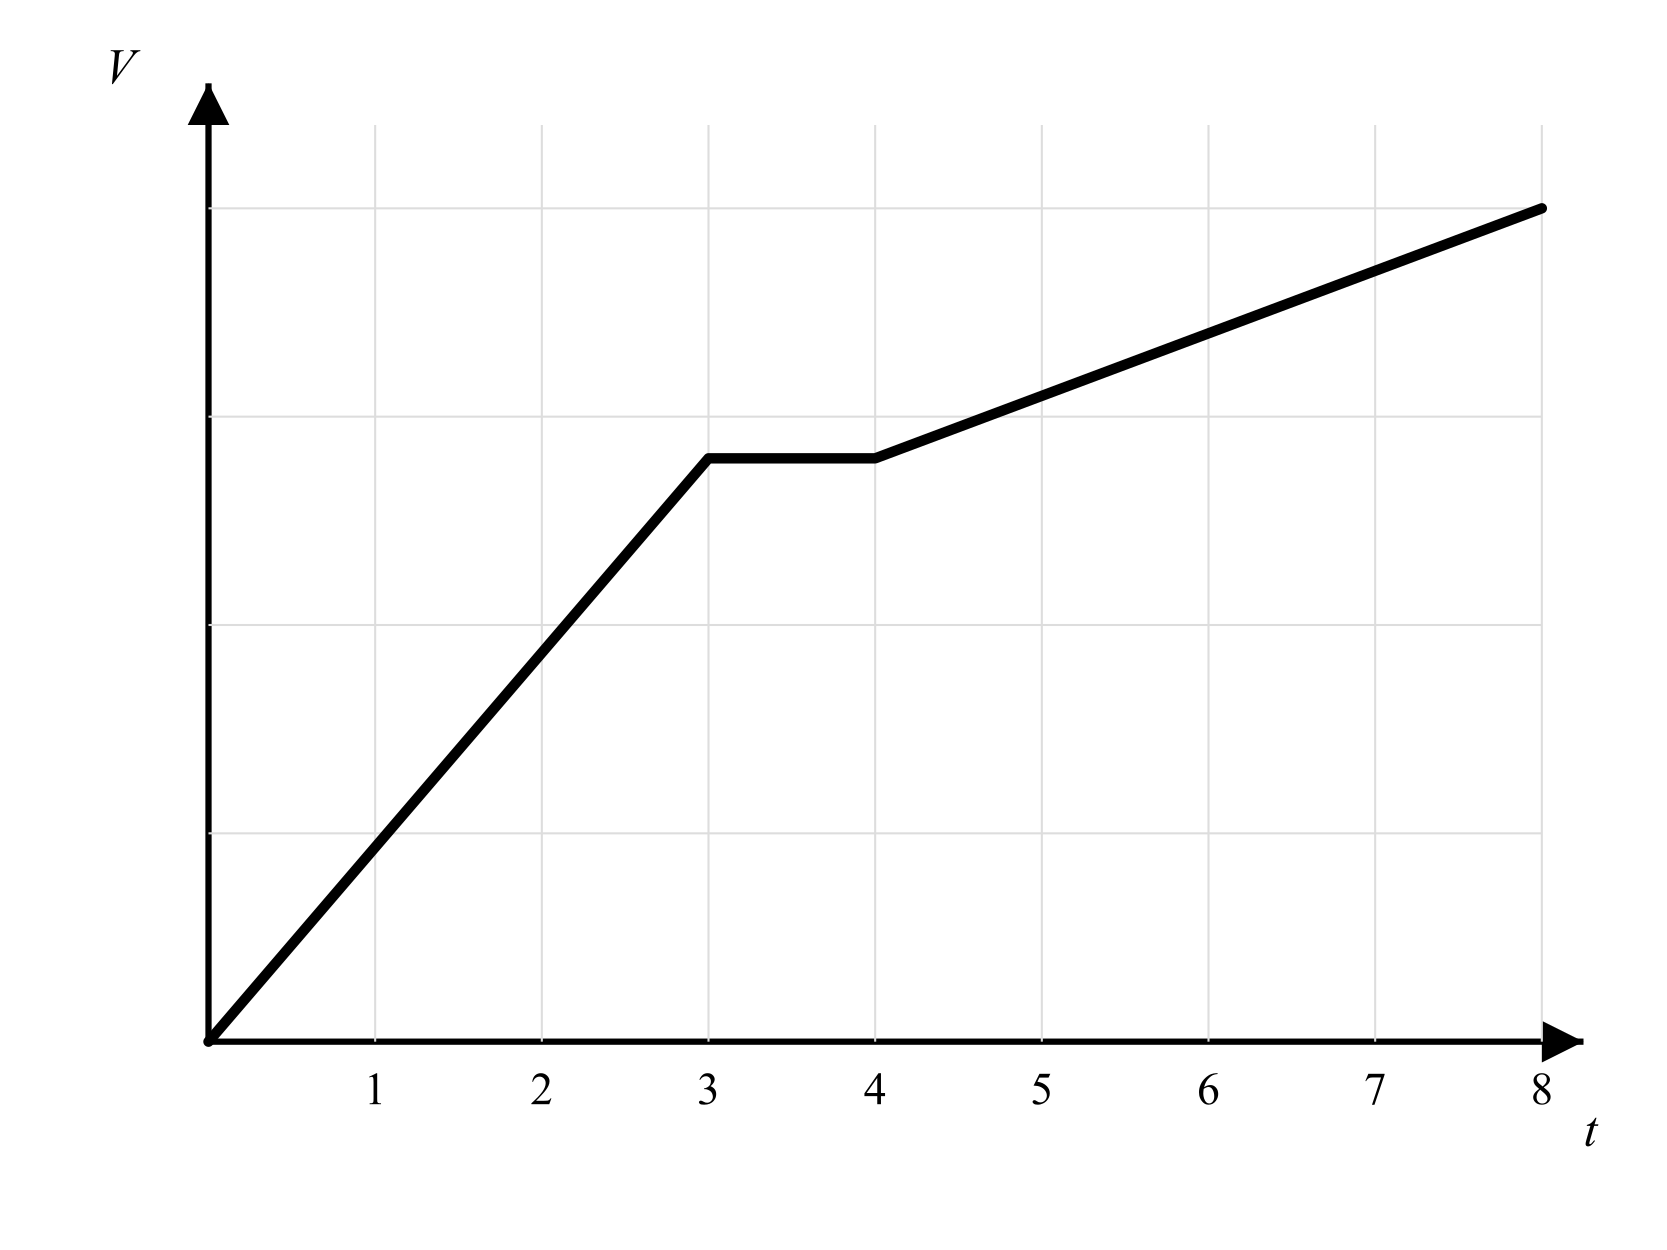
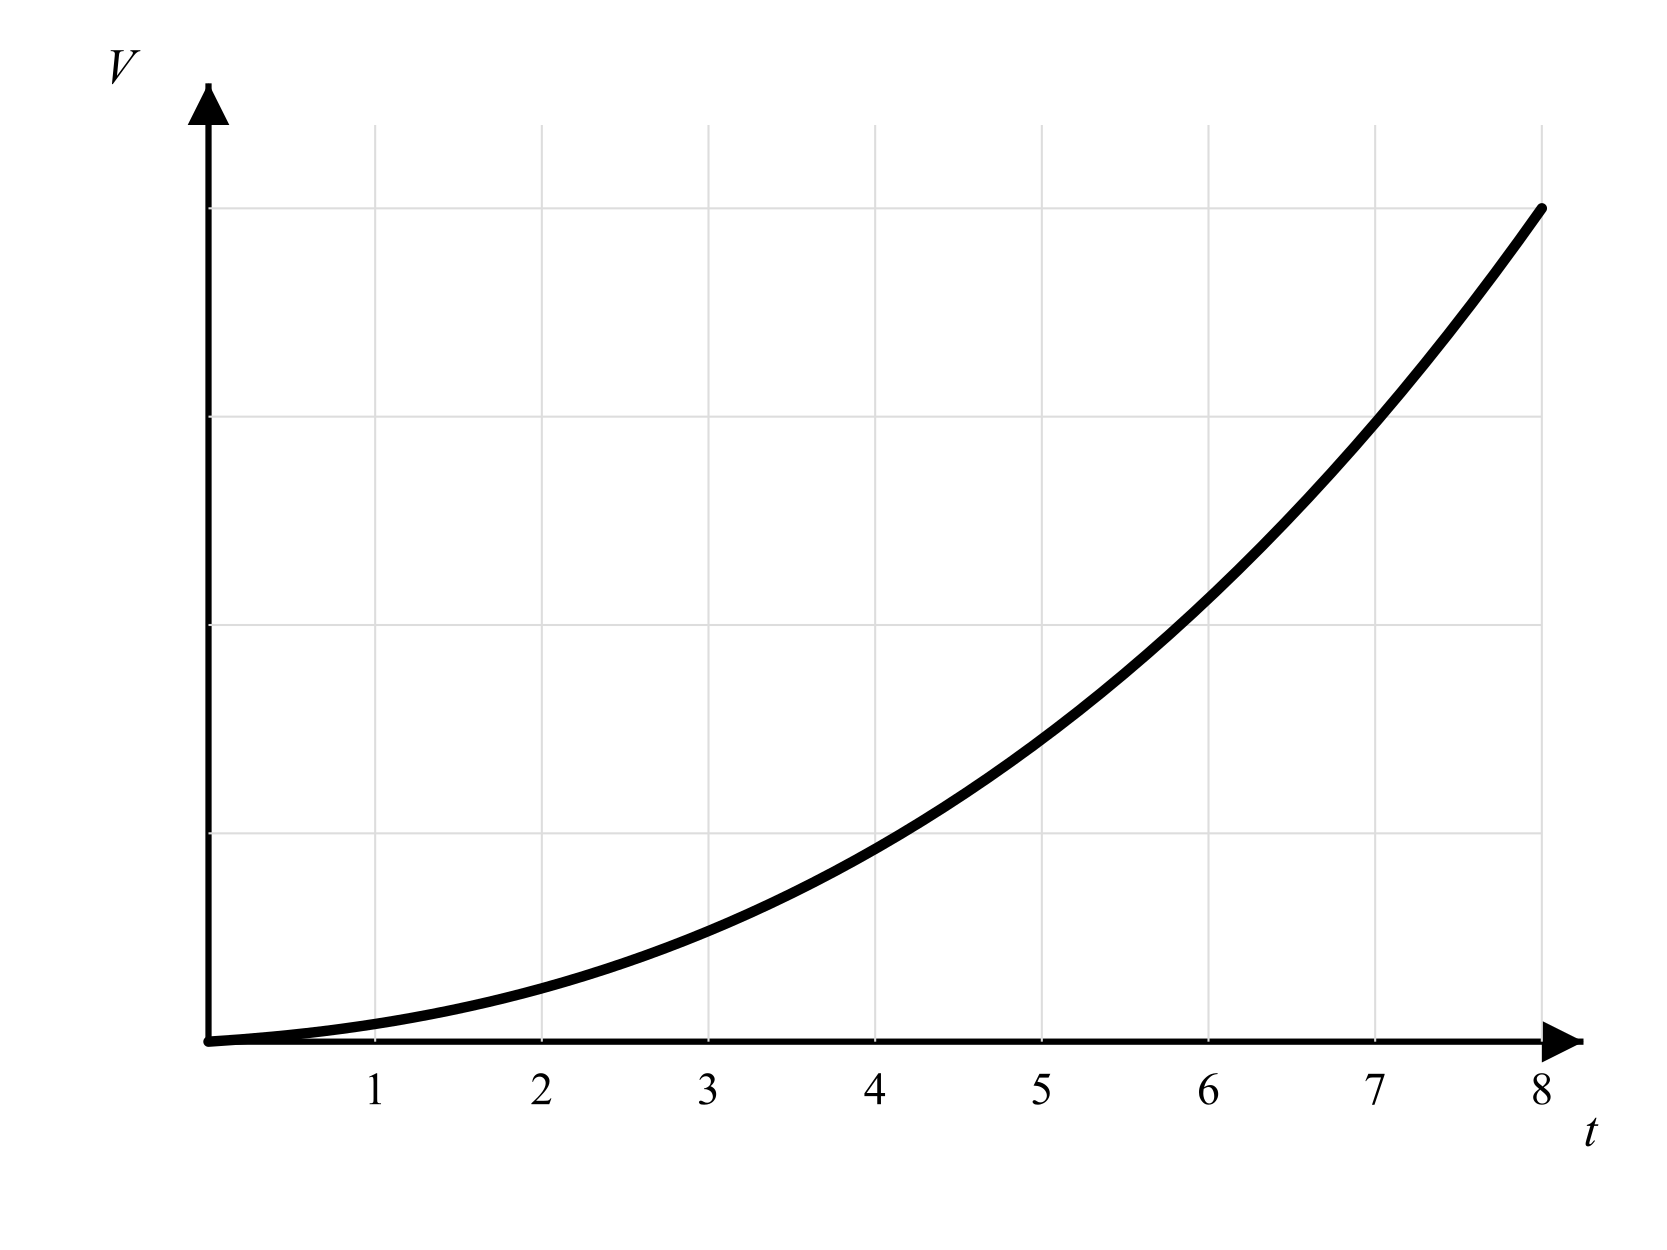
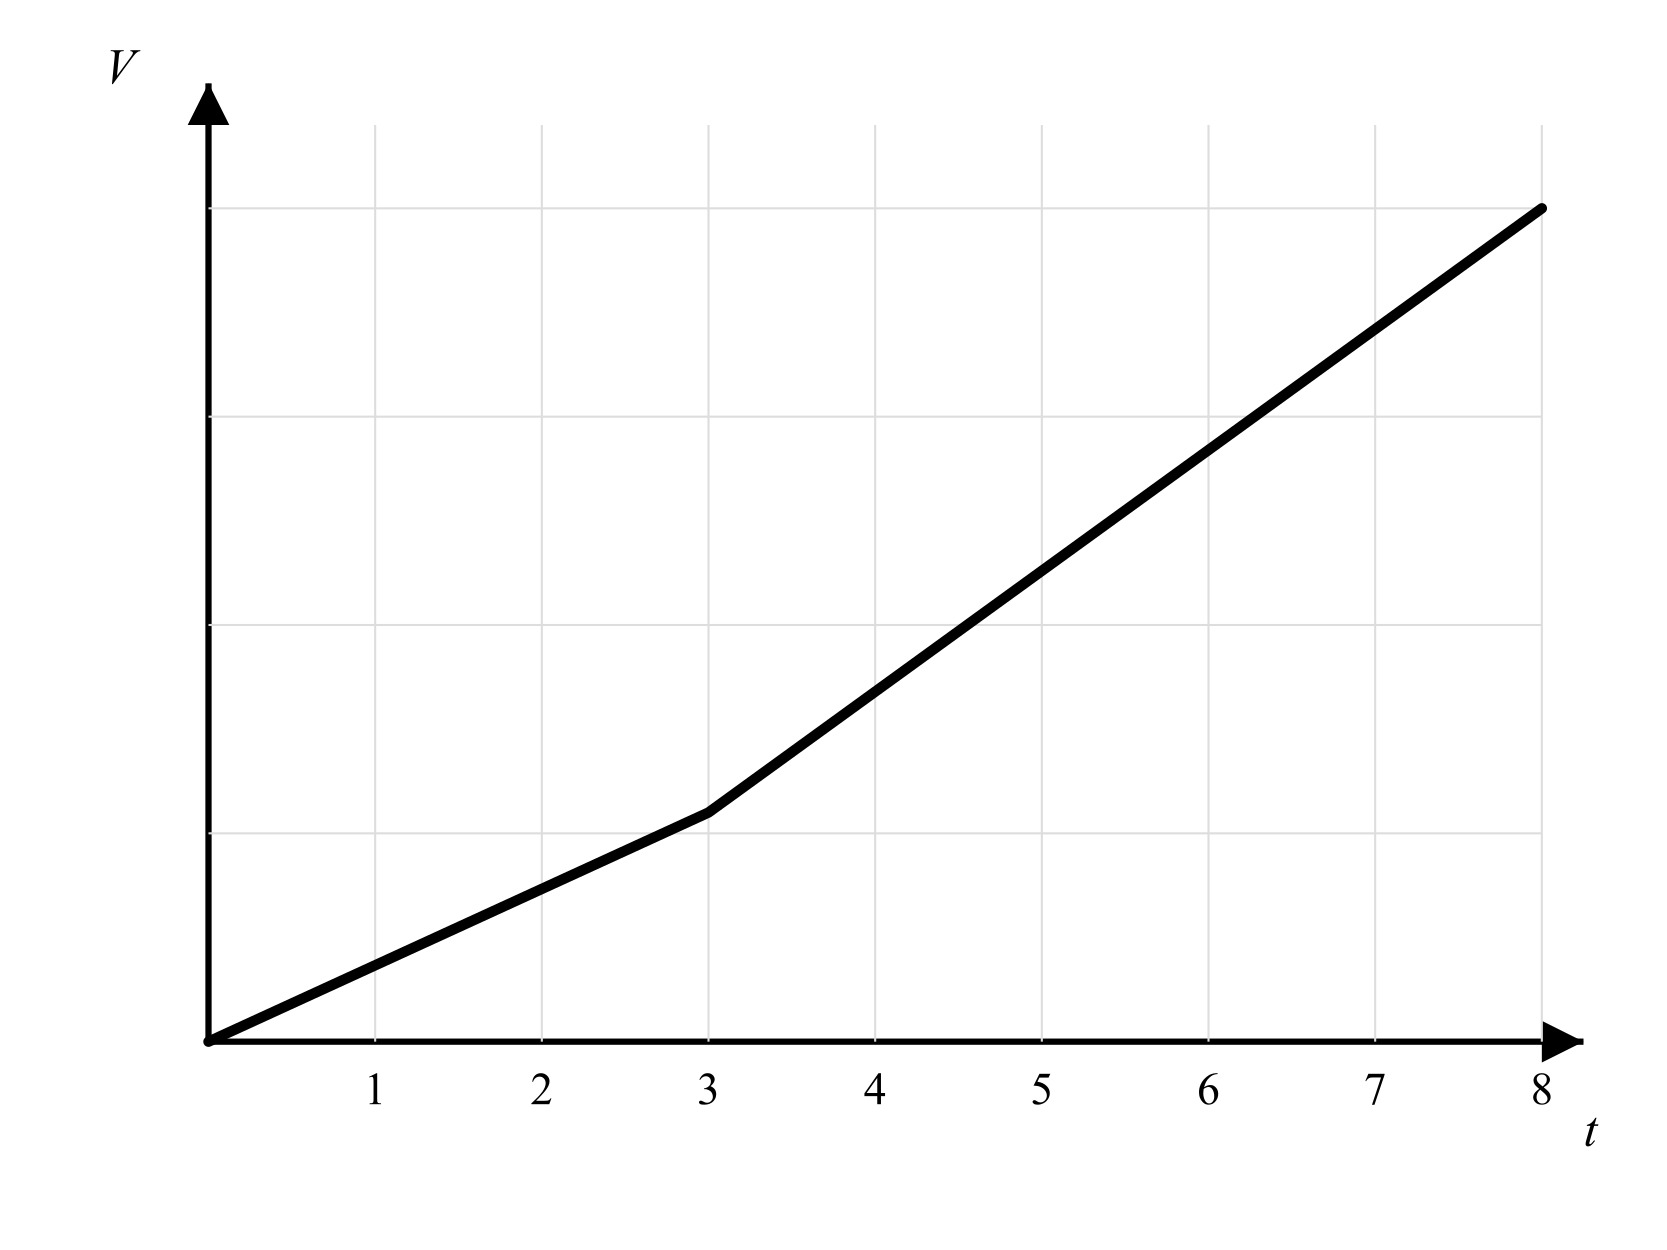
A water tank is being filled using a hose. The rate at which the volume of water in the tank increases is constant when the hose is running. During the first three hours, the hose runs at a reduced flow rate due to low water pressure. The hose is then turned off while a valve is adjusted. After the adjustment, the hose runs at its full flow rate until the tank is completely full. The entire process of filling the tank takes eight hours. Which of the following graphs could depict this situation, where time, t in hours, is the independent variable, and the volume of water in the tank, V in gallons, is the dependent variable?

  • Graph showing volume vs time: a line increasing slowly from t = 0 to t = 3, then a flat horizontal segment from t = 3 to about t = 4, then a steeper increasing line from t = 4 to t = 8 reaching full capacity.
  • Graph showing volume vs time: a steeply increasing line from t = 0 to t = 3, then a flat segment, then a slowly increasing line to t = 8.
  • Graph showing volume vs time: a smooth concave-up curve increasing continuously from t = 0 to t = 8 with no flat segment.
  • Graph showing volume vs time: a slowly increasing line from t = 0 to t = 3, then a steeply increasing line from t = 3 to t = 8 with no pause.
6
Sme Calculator
1 mark
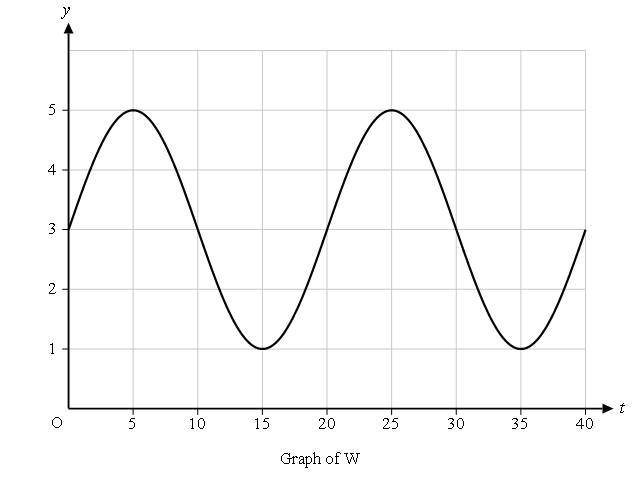
A graph labelled "Graph of W" on axes where the horizontal axis is labelled t with an arrowhead pointing right, tick marks at 5, 10, 15, 20, 25, 30, 35, and 40, and the vertical axis is labelled y with an arrowhead pointing up and tick marks at 1, 2, 3, 4, and 5. The origin is labelled O. Vertical grid lines appear at t = 5, 10, 15, 20, 25, 30, 35, and 40; horizontal grid lines appear at y = 1, 2, 3, 4, 5, and 6. A sinusoidal curve begins at the midline (y = 3) at t = 0, rises to a maximum of y = 5 at t = 5, returns to the midline at t = 10, falls to a minimum of y = 1 at t = 15, returns to the midline at t = 20, rises to a second maximum of y = 5 at t = 25, returns to the midline at t = 30, falls to a second minimum of y = 1 at t = 35, and returns to the midline at t = 40.

The depth of water, in metres, at a tidal monitoring station is modelled by a function W. The graph of y = W \left(t\right) is shown for 0 \leq t \leq 40, where t is the number of hours since midnight. What are all intervals of t on which the depth of water is increasing at a decreasing rate?

  • (0, 5) only

  • (0, 10)

  • (5, 15) and (25, 35) only

  • (0, 5) and (20, 25)

7
Sme Calculator
1 mark

The average temperature, in degrees Celsius, in a city on day t of the year is modelled by the function T defined by

T(t) = 12\cos\left(\frac{2\pi}{365}(t - 200)\right) + 10

Which of the following correctly describes the average temperature on day t = 320?

  • The temperature is decreasing, and the rate of change of temperature is decreasing.

  • The temperature is decreasing, and the rate of change of temperature is increasing.

  • The temperature is increasing, and the rate of change of temperature is decreasing.

  • The temperature is increasing, and the rate of change of temperature is increasing.

8
Sme Calculator
1 mark

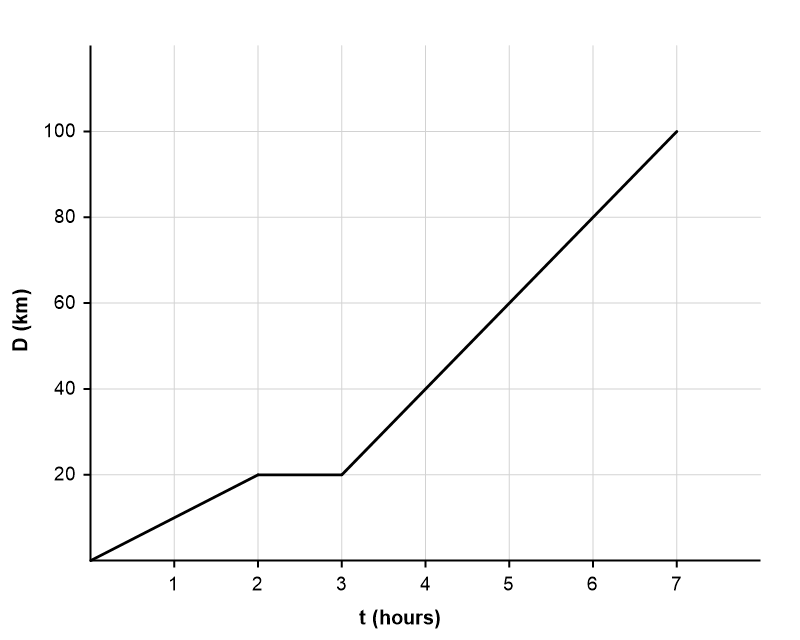
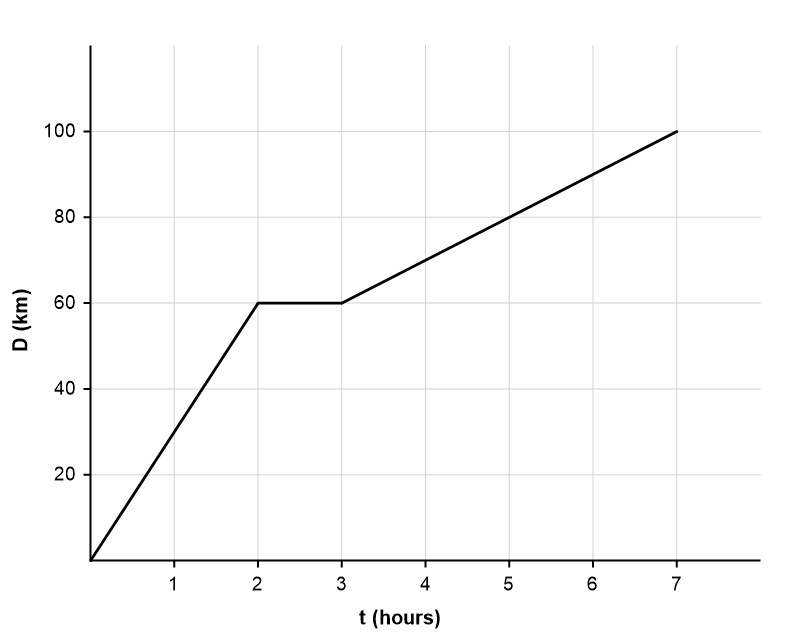
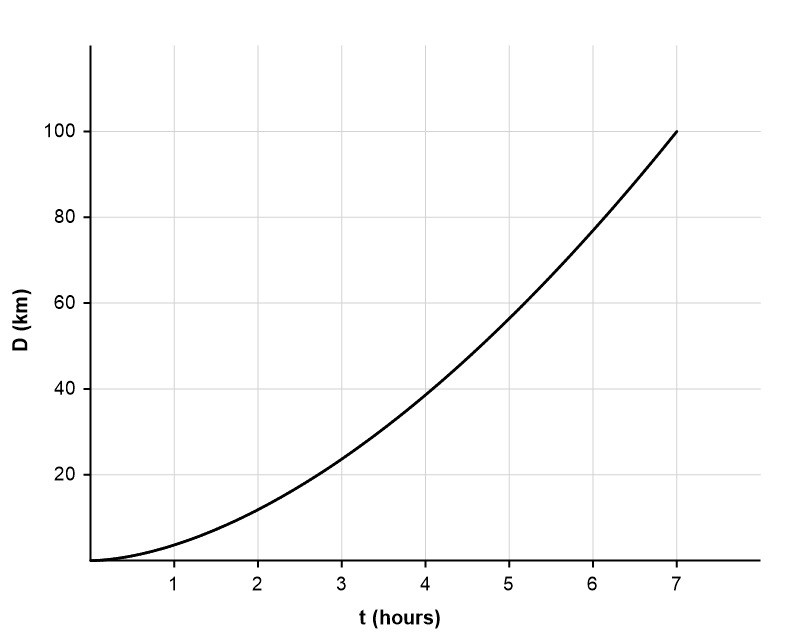
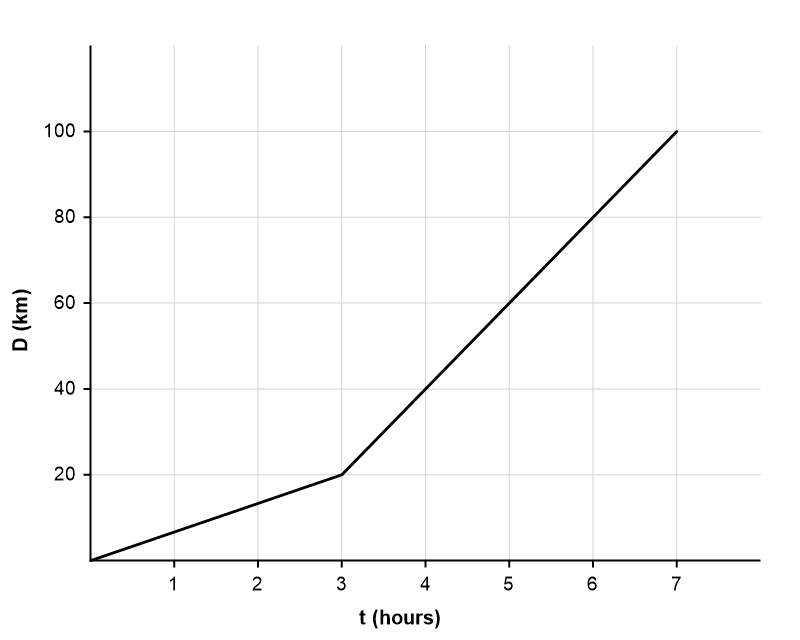
A delivery van leaves a depot to make deliveries. For the first 2 hours, the van travels slowly through city streets. The van then stops for 1 hour to unload packages at a delivery site. After completing the delivery, the van travels on the motorway for 4 hours. The van ends 100 km from the depot, and the entire journey takes 7 hours.

Which of the following graphs could represent this situation, where t is the time in hours and D is the distance from the depot in kilometres?

  • Graph showing distance D (km) vs time t (hours): a gently increasing line from (0, 0) to (2, 20), then a flat horizontal segment from t = 2 to t = 3, then a steeply increasing line from (3, 20) to (7, 100).
  • Graph showing distance D (km) vs time t (hours): a steeply increasing line from (0, 0) to (2, 60), then a flat horizontal segment from t = 2 to t = 3, then a gently increasing line from (3, 60) to (7, 100).
  • Graph showing distance D (km) vs time t (hours): a smooth concave-up curve increasing continuously from (0, 0) to (7, 100) with no flat segment.
  • Graph showing distance D (km) vs time t (hours): a gently increasing line from (0, 0) to (3, 20), then a steeply increasing line from (3, 20) to (7, 100) with no flat segment.
9
Sme Calculator
1 mark
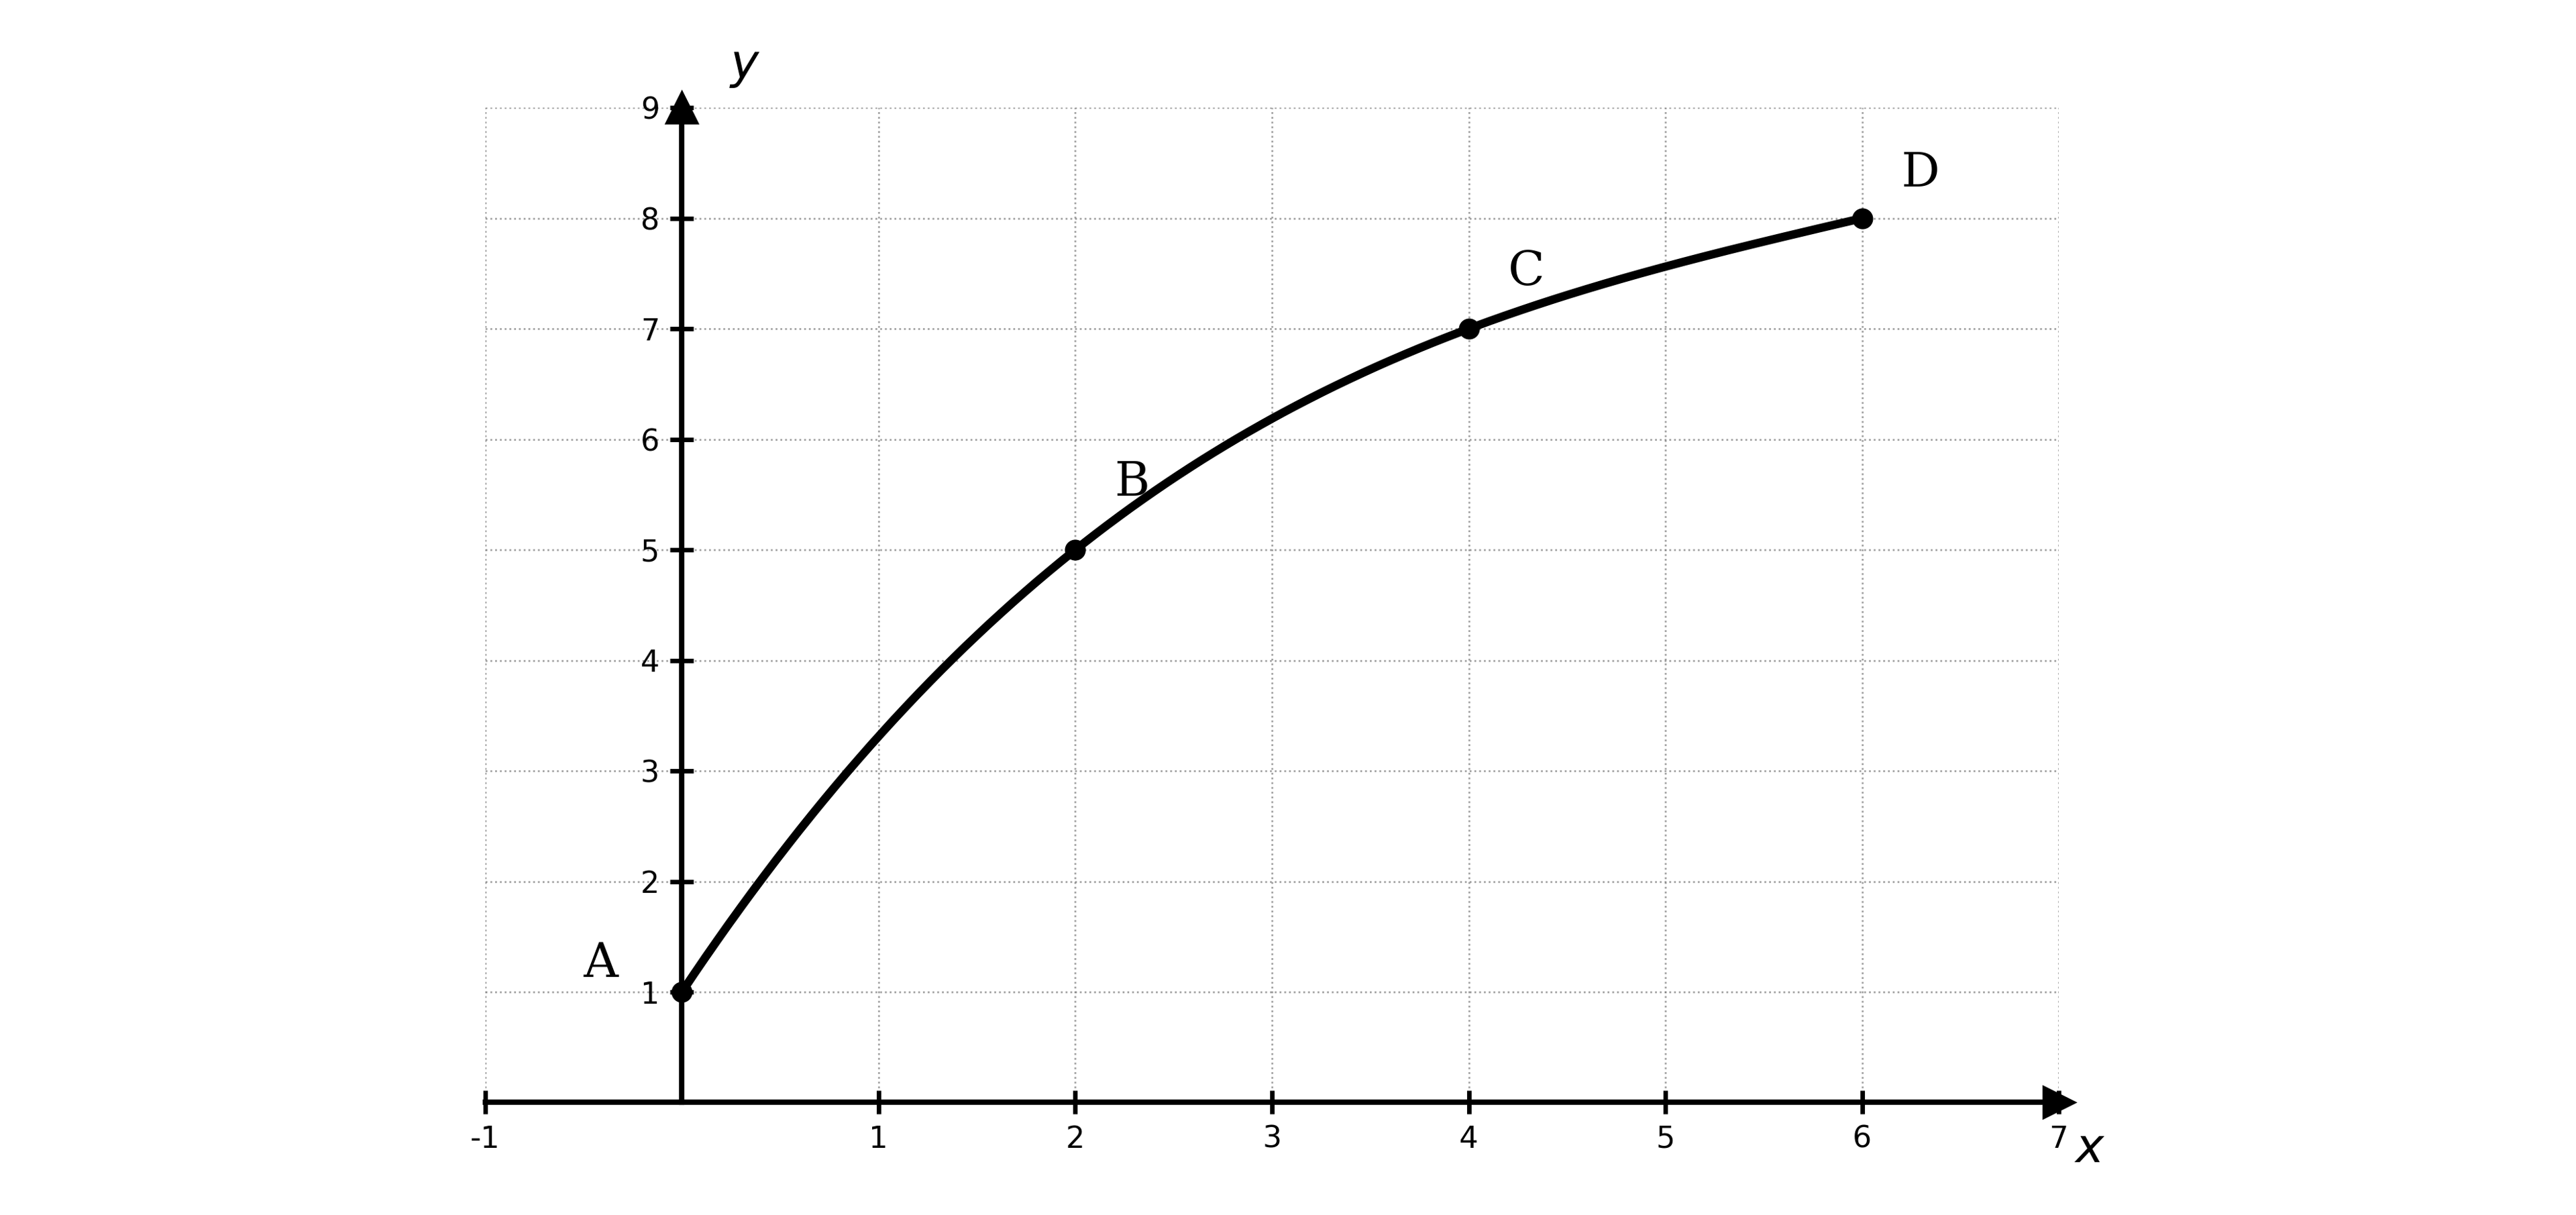
Graph of a rising, concave-down curve from A(0,1) through B(2,5) and C(4,7) to D(6,8) on x–y axes labelled x (0–7) and y (0–9).
Graph of g

The graph of a function g is shown in the x y-plane. Four points A, B, C, and D, with coordinates A open parentheses 0 comma 1 close parentheses, B open parentheses 2 comma 5 close parentheses, C open parentheses 4 comma 7 close parentheses, and D open parentheses 6 comma 8 close parentheses, are labeled on the graph.

On which of the following intervals is the average rate of change of g the greatest?

  • open square brackets 0 comma 2 close square brackets

  • open square brackets 0 comma 6 close square brackets

  • open square brackets 2 comma 4 close square brackets

  • open square brackets 4 comma 6 close square brackets

10
1 mark

The table gives values for a function w at selected values of x.

x

0

2

4

6

8

w open parentheses x close parentheses

10

15

22

31

42

Which of the following statements about the concavity of the graph of w on the interval 0 less or equal than x less or equal than 8 is true based on the data?

  • The graph is concave down because the average rates of change of w over consecutive equal-length intervals are decreasing.

  • The graph is concave down because the average rates of change of w over consecutive equal-length intervals are increasing.

  • The graph is concave up because the average rates of change of w over consecutive equal-length intervals are increasing.

  • The graph is concave up because the output values of w are increasing.

11
Sme Calculator
1 mark

The table gives values for a function space f at selected values of x near x equals 3.

x

2 . 9

2 . 99

3 . 01

3 . 1

space f open parentheses x close parentheses

4 . 510

4 . 890

5 . 120

5 . 480

Based on the table, which of the following is the best approximation for the rate of change of space f at x equals 3?

  • 0 . 230

  • 4 . 850

  • 11 . 500

  • 23 . 000

12
Sme Calculator
1 mark
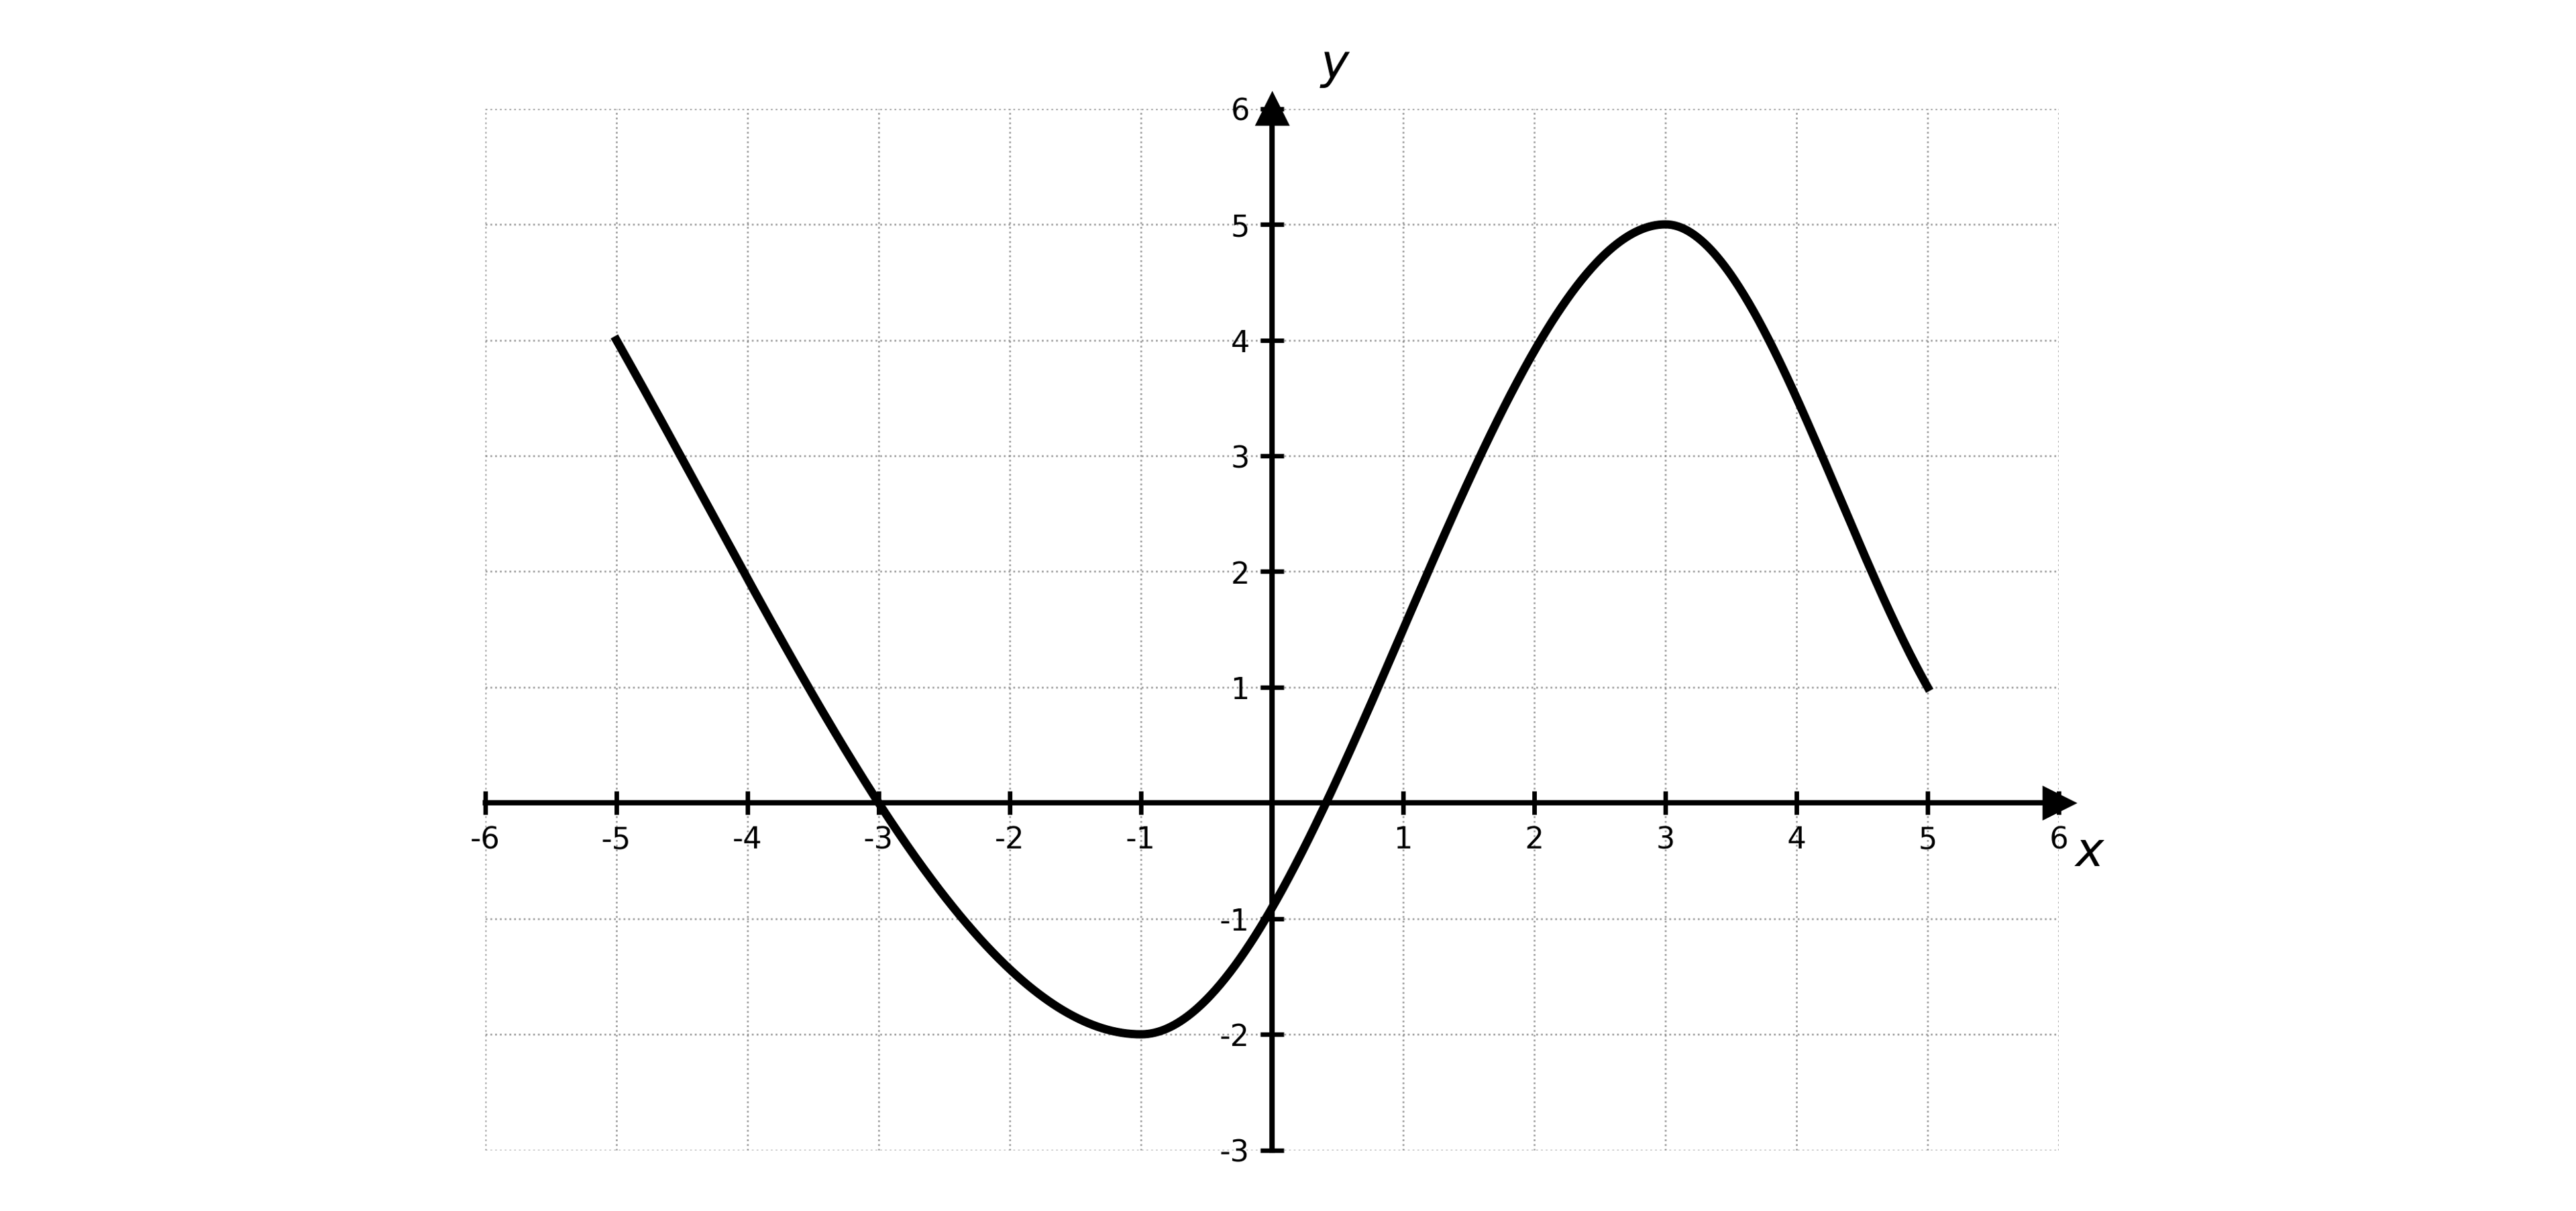
Graph of a curve from x = −5 to 5, starting at (-5, 4), crossing the x-axis at −3, dipping to about y = −2, then crossing the x-axis again between 0 and 1 and rising to a peak near (3, 5) before falling to y = 1 at x=5
Graph of f

The graph of a function space f, with domain open square brackets negative 5 comma 5 close square brackets, is shown in the x y-plane.

On which of the following intervals is the function space f increasing?

  • open parentheses negative 5 comma negative 1 close parentheses

  • open parentheses negative 5 comma 5 close parentheses

  • open parentheses negative 1 comma 3 close parentheses

  • open parentheses 3 comma 5 close parentheses

13
Sme Calculator
1 mark

The function space p models the population of a town, in thousands, t years after 2010. The table gives values for space p open parentheses t close parentheses at selected values of t near t equals 5 and t equals 10.

t

4 . 9

5 . 1

9 . 9

10 . 1

space p open parentheses t close parentheses

12 . 42

12 . 58

14 . 85

15 . 17

Based on the table, which of the following statements comparing the rate of change of space p at t equals 5 to the rate of change of space p at t equals 10 is true?

  • The rate of change at t equals 5 is approximately 0.16 thousand per year, which is less than the rate of change at t equals 10, which is approximately 0.32 thousand per year.

  • The rate of change at t equals 5 is approximately 0.8 thousand per year, which is greater than the rate of change at t equals 10, which is approximately 0.16 thousand per year.

  • The rate of change at t equals 5 is approximately 0.8 thousand per year, which is less than the rate of change at t equals 10, which is approximately 1.6 thousand per year.

  • The rate of change at t equals 5 is approximately 12.5 thousand per year, which is less than the rate of change at t equals 10, which is approximately 15.0 thousand per year.

14
Sme Calculator
1 mark

A relation k between two sets of real numbers is described as follows: for every input value x, the output value y is the absolute value of x.

Which of the following correctly identifies whether k is a function and gives a valid set of ordered pairs open parentheses x comma y close parentheses that is consistent with the description of the relation?

  • k is a function, because each input value is mapped to exactly one output value, and the set open curly brackets open parentheses negative 2 comma 2 close parentheses comma open parentheses 2 comma 2 close parentheses comma open parentheses 3 comma 3 close parentheses close curly brackets is consistent with the description.

  • k is a function, because each output value maps to exactly one input value, and the set open curly brackets open parentheses 2 comma negative 2 close parentheses comma open parentheses 2 comma 2 close parentheses comma open parentheses 3 comma 3 close parentheses close curly brackets is consistent with the description.

  • k is not a function, because an input value maps to multiple output values, and the set open curly brackets open parentheses 2 comma negative 2 close parentheses comma open parentheses 2 comma 2 close parentheses comma open parentheses 3 comma 3 close parentheses close curly brackets is consistent with the description.

  • k is not a function, because multiple input values map to the same output value, and the set open curly brackets open parentheses negative 2 comma 2 close parentheses comma open parentheses 2 comma 2 close parentheses comma open parentheses 3 comma 3 close parentheses close curly brackets is consistent with the description.

15
Sme Calculator
1 mark

The table below gives selected values of a function space f.

space x

- 3

- 1

1

3

5

7

space f open parentheses x close parentheses

0

- 4

2

10

12

18

Assume that between any two consecutive values of x listed in the table, space f is either always increasing or always decreasing, and the rate of change of space f is either always increasing or always decreasing.

On which of the following intervals is space f positive and increasing, and the graph of space f concave up?

  • negative 3 less or equal than x less or equal than 1

  • negative 1 less or equal than x less or equal than 3

  • 1 less or equal than x less or equal than 5

  • 3 less or equal than x less or equal than 7

16
Sme Calculator
1 mark

The graph of the function space f is concave down on the closed interval open square brackets 0 comma 4 close square brackets. The values space f open parentheses 0 close parentheses equals 2, space f open parentheses 2 close parentheses equals 8, and space f open parentheses 4 close parentheses equals k are given. Which of the following is a possible value of k?

  • 12

  • 14

  • 16

  • 18

17
Sme Calculator
1 mark

For the function space f open parentheses x close parentheses equals 1 over x, the average rate of change of space f on the interval open square brackets 2 comma c close square brackets is negative 1 over 10. What is the value of c?

  • 4

  • 5

  • 8

  • 10