Sinusoidal Functions & Modeling (College Board AP® Precalculus): Exam Questions

1 hour34 questions
1a
Sme Calculator
2 marks

For a guitar to make a sound, the strings need to vibrate, or move up and down or back and forth, in a motion that can be modeled by a periodic function.

At time t=0 seconds, point X on one vibrating guitar string starts at its highest position, 2 millimeters above its resting position. Then it passes through its resting position and moves to its lowest position, 2 millimeters below the resting position. Point X then passes through its resting position and returns to 2 millimeters above the resting position. This motion occurs 200 times in 1 second.

The sinusoidal function h models how far point X is from its resting position, in millimeters, as a function of time t, in seconds. A positive value of h(t) indicates the point is above the resting position; a negative value of h(t) indicates the point is below the resting position.

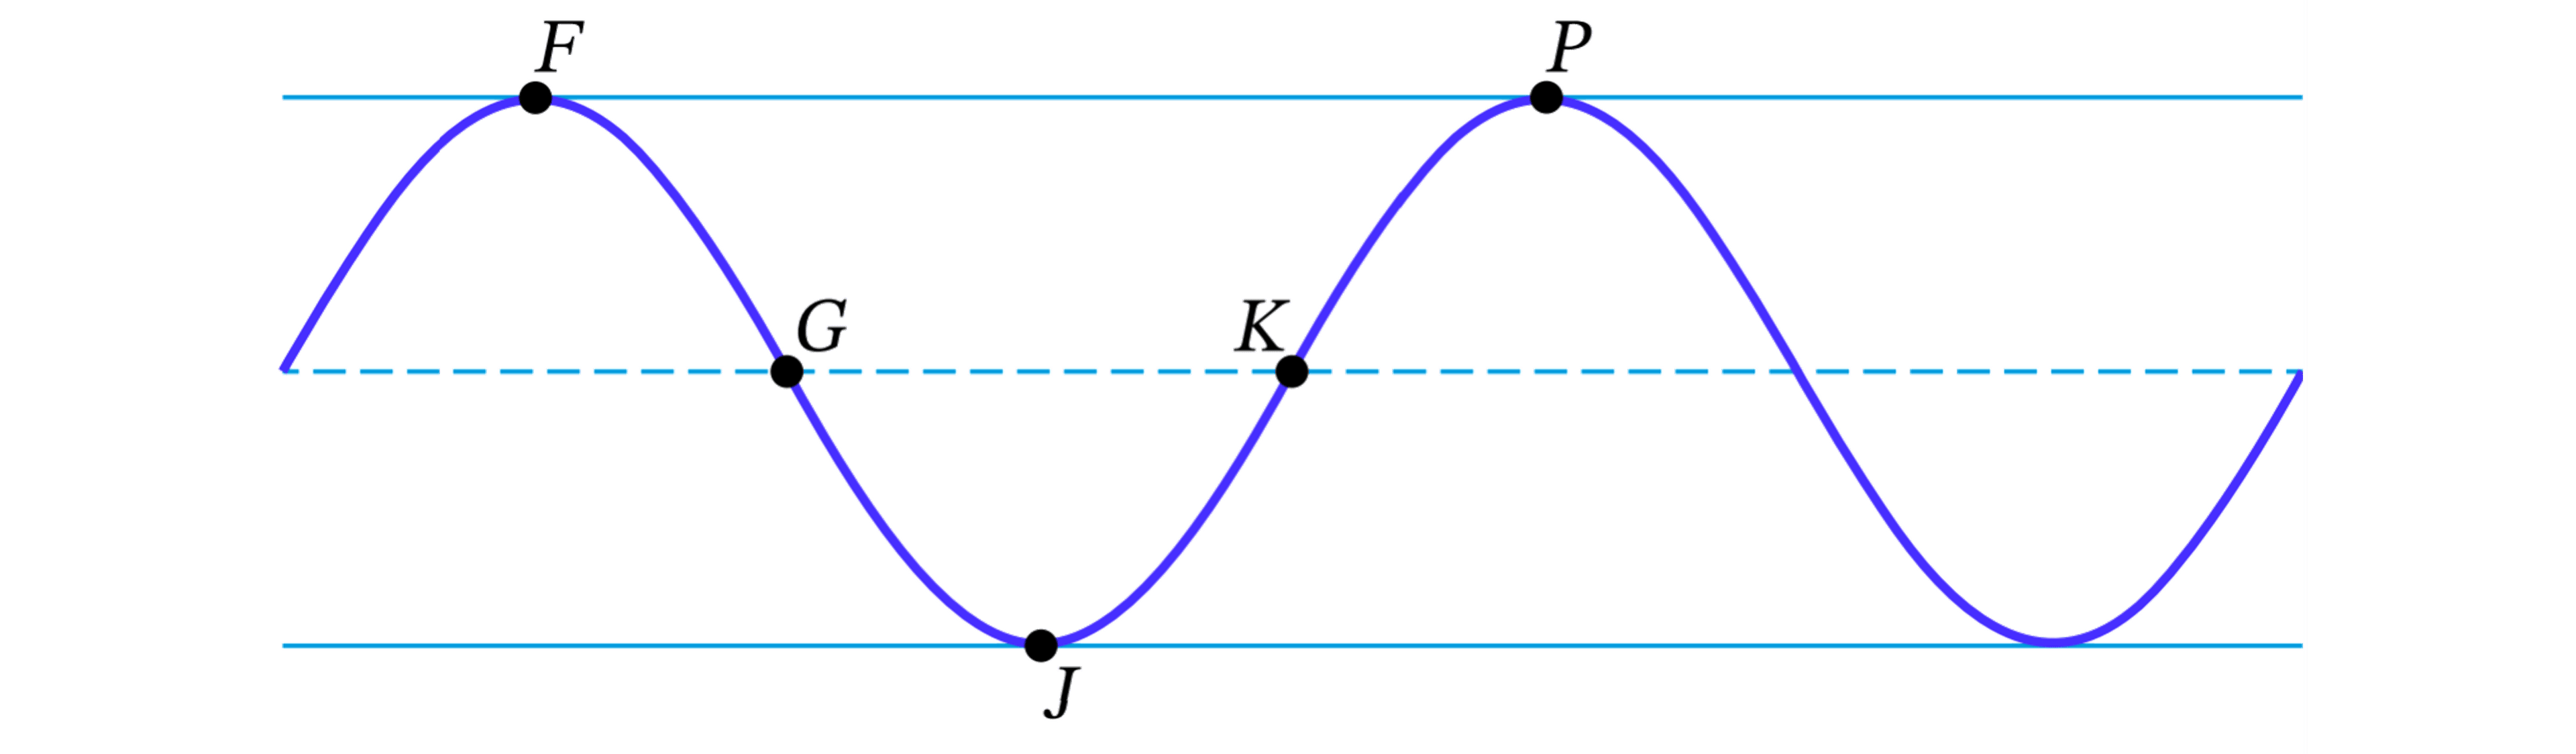
The graph of h and its dashed midline for two full cycles is shown. Five points, F, G, J, K, and P, are labeled on the graph. No scale is indicated, and no axes are presented. Determine possible coordinates (t, h(t)) for the five points: F, G, J, K, and P.

Graph of a sinusoidal wave showing peaks labelled F and P, a valley labelled J, and with points G and K on the midline. Horizontal lines indicate maximum and minimum levels, and a dashed line shows the midline.
1b
Sme Calculator
2 marks

The function h can be written in the form h(t)=asin(b(t+c))+d. Find values of constants a, b, c, and d.

2a
Sme Calculator
2 marks
Woman pushing a tire, indicated by her posture and an arrow indicating the tyre is rolling forwards. A point W is marked on the circumference of the tire. Note reads: "Figure not drawn to scale."

The tire of a car has a radius of 9 inches, and a person rolls the tire forward at a constant rate on level ground, as shown in the figure. Point W on the edge of the tire touches the ground at time t=12 second. The tire completes a full rotation, and the next time W touches the ground is at time t=52 seconds. The maximum height of W above the ground is 18 inches. As the tire rolls, the height of W above the ground periodically increases and decreases.

The sinusoidal function h models the height of point W above the ground, in inches, as a function of time t, in seconds.

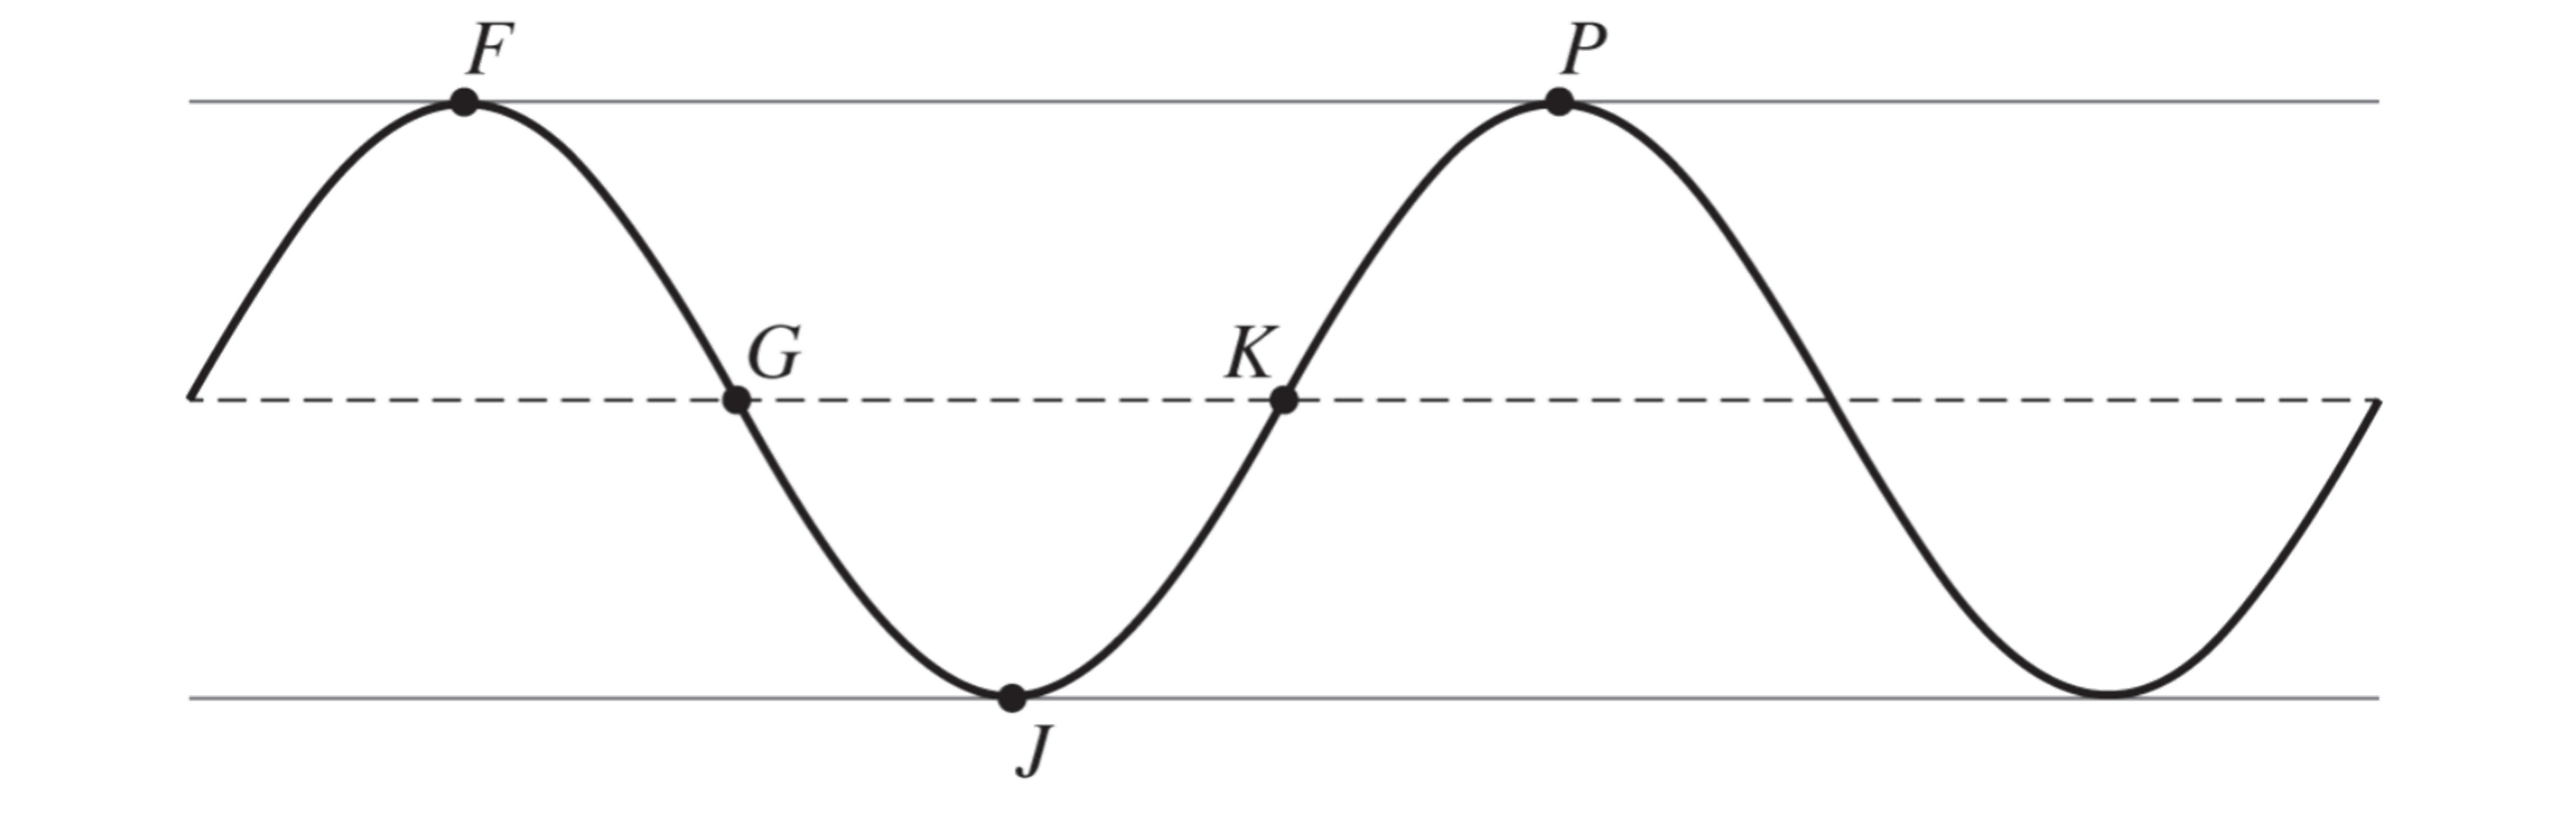
The graph of h and its dashed midline for two full cycles is shown. Five points, F, G, J, K, and P, are labeled on the graph. No scale is indicated, and no axes are presented.

Determine possible coordinates (t, h(t)) for the five points: F, G, J, K, and P.

Graph of a sinusoidal wave showing peaks labelled F and P, a valley labelled J, and with points G and K on the midline. Horizontal lines indicate maximum and minimum levels, and a dashed line shows the midline.
2b
Sme Calculator
2 marks

The function h can be written in the form h(t)=asin(b(t+c))+d. Find values of constants a, b, c, and d.

3
Sme Calculator
1 mark

A sinusoidal function  f has a relative maximum of 12 at x=2, and its next relative minimum, of 0, occurs at x=6.

The function  f can be written in the form  f(x)=asin(b(xh))+k, where a, b, h, and k are real numbers.

Find the value of b. Show the work that leads to your answer.

4
Sme Calculator
1 mark

The function  f is given by  f(x)=3sin(π6x)+5.

Find the amplitude of  f.

5
Sme Calculator
1 mark
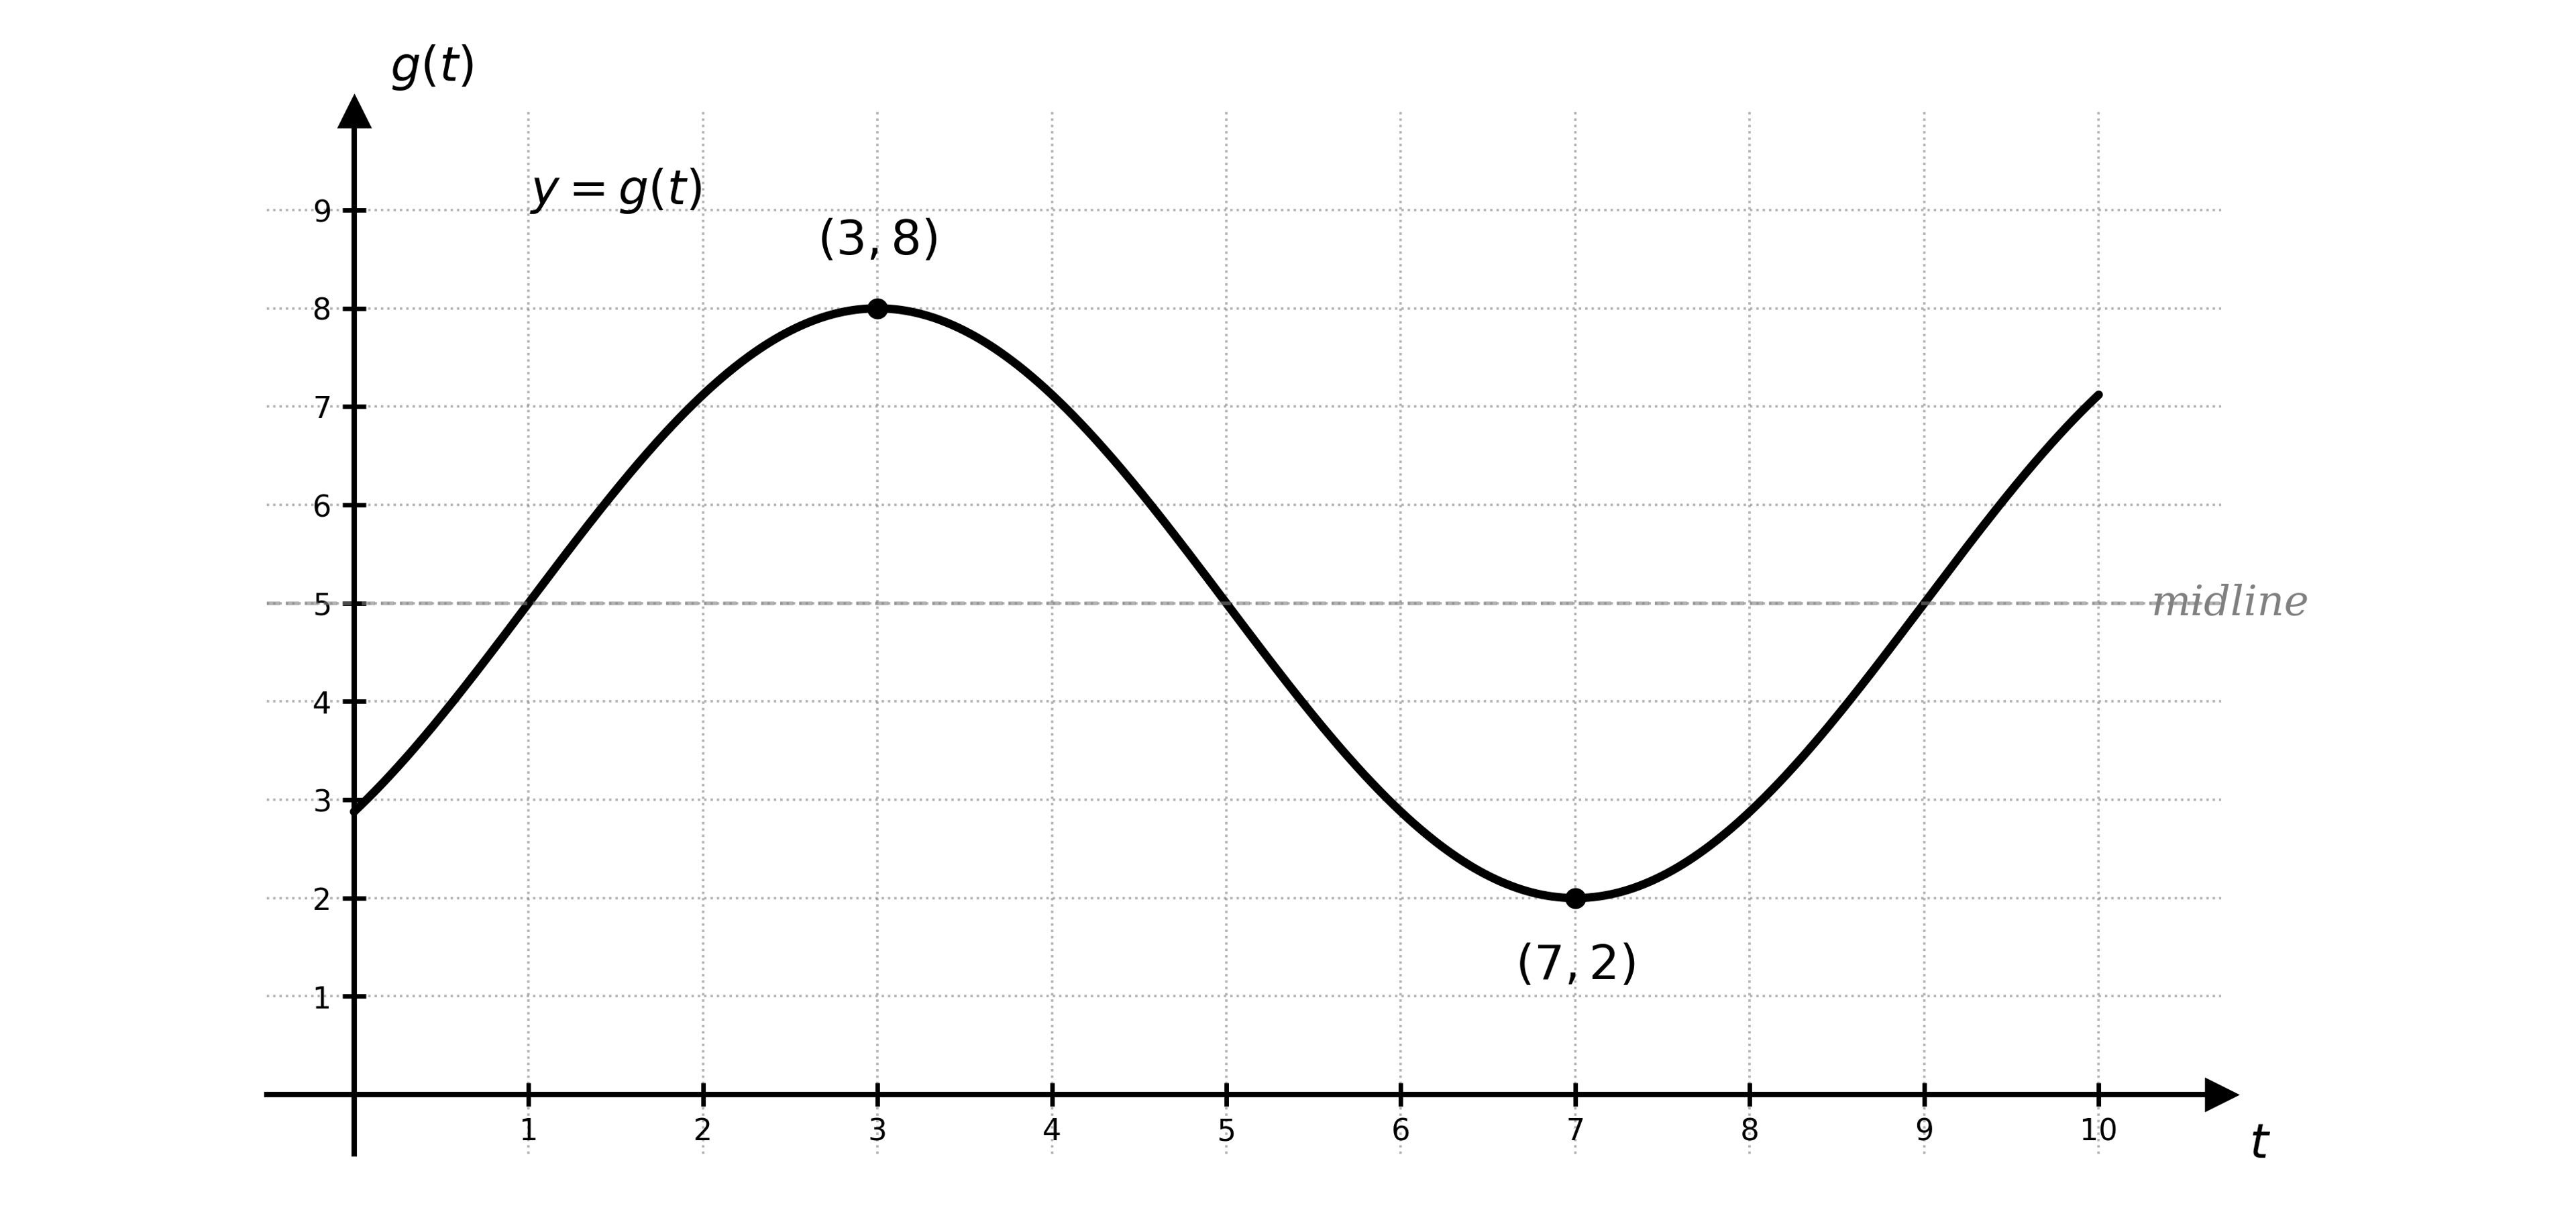
Placeholder: graph of a sinusoidal function g shown for 0 less than or equal to t less than or equal to 10. The graph displays a smooth sinusoidal curve. A relative maximum is labelled at the point (3, 8), and a relative minimum is labelled at the point (7, 2). A horizontal dashed line at y = 5 (labelled 'midline') is shown for reference. The horizontal axis is labelled t and the vertical axis is labelled g(t).

The depth of water at a coastal location is modeled by a sinusoidal function g of time t (in hours after midnight). The graph of g is shown above for 0t10 hours. The graph has a relative maximum at the point (3,8) and a relative minimum at the point (7,2).

Find the coordinates (t,g(t)) of the next relative maximum of g that occurs after t=10.

6a
Sme Calculator
1 mark

The depth of water at a harbor, in meters, is modeled by the function D, where D(t)=8cos(πt6)+12 for 0t24. D(t) is the depth in meters, and t is the number of hours since midnight on a particular day.

On the interval (3,6), is D increasing or decreasing?

6b
Sme Calculator
1 mark

On the interval (3,6), describe the concavity of the graph of D and determine whether the rate of change of D is increasing or decreasing.

7a
Sme Calculator
2 marks

The average daily temperature in a particular town varies sinusoidally throughout the year. The function T models the temperature, in degrees Fahrenheit, on month t of the year, with 0t12. The temperature reaches its maximum of 80°F at t=7 and its minimum of 40°F at t=1.

The function T can be written in the form T(t)=acos(b(t+c))+d. Find the values of a, b, c, and d.

7b
Sme Calculator
1 mark

Find the value of T(9). Show the work that leads to your answer.

7c
Sme Calculator
1 mark

Interpret the meaning of your answer to part (b) in the context of the problem.

8a
Sme Calculator
2 marks

The depth of water at a certain coastal point varies sinusoidally with a period of 24 hours due to the daily tidal cycle. The table shows the depth D(t), in meters, measured at selected times t in hours after midnight on a particular day.

t (hours)

0

6

12

18

24

D(t) (meters)

10

14

10

6

10

Construct a sinusoidal function D(t) in the form asin(b(t+c))+d that fits the data in the table.

8b
Sme Calculator
1 mark

Use your model to find the value of D(8). Express your answer as an exact value. Show the work that leads to your answer.

8c
Sme Calculator
1 mark

Interpret the meaning of your answer to part (b) in the context of the problem.

9a
Sme Calculator
2 marks

Let  f(θ)=sinθ. The graph of g is constructed by applying the following transformations to the graph of  f, in order:

  • A vertical dilation by a factor of 3

  • A horizontal dilation by a factor of 12

  • A vertical translation up by 4 units

Find an expression for g(θ).

9b
Sme Calculator
1 mark

State the amplitude, period, and midline of g.

10a
Sme Calculator
1 mark

The temperature, in degrees Fahrenheit, in a particular city on a certain day is modeled by the function T, where T(t)=12sin(πt12)+65 for 0t24. T(t) is the temperature in degrees Fahrenheit, and t is the number of hours since 6:00 a.m. on that day.

Find the maximum temperature reached during the 24-hour period and the time at which this maximum occurs.

10b
Sme Calculator
1 mark

Find all values of t, as decimal approximations, in the interval 0t24 for which T(t)=70, or indicate that there are no such values.

10c
Sme Calculator
1 mark

Interpret your answer to part (b) in the context of the problem.

11a
Sme Calculator
2 marks

A surfboard floating in the sea moves up and down as waves pass beneath it. The height of the surfboard above the sea floor varies periodically.

The surfboard reaches a maximum height of 11 feet above the sea floor and a minimum height of 3 feet above the sea floor. One full cycle takes 8 seconds. At time t=0, the surfboard is at its midline height and is rising.

The function h models the height of the surfboard above the sea floor, in feet, as a function of time t, in seconds.

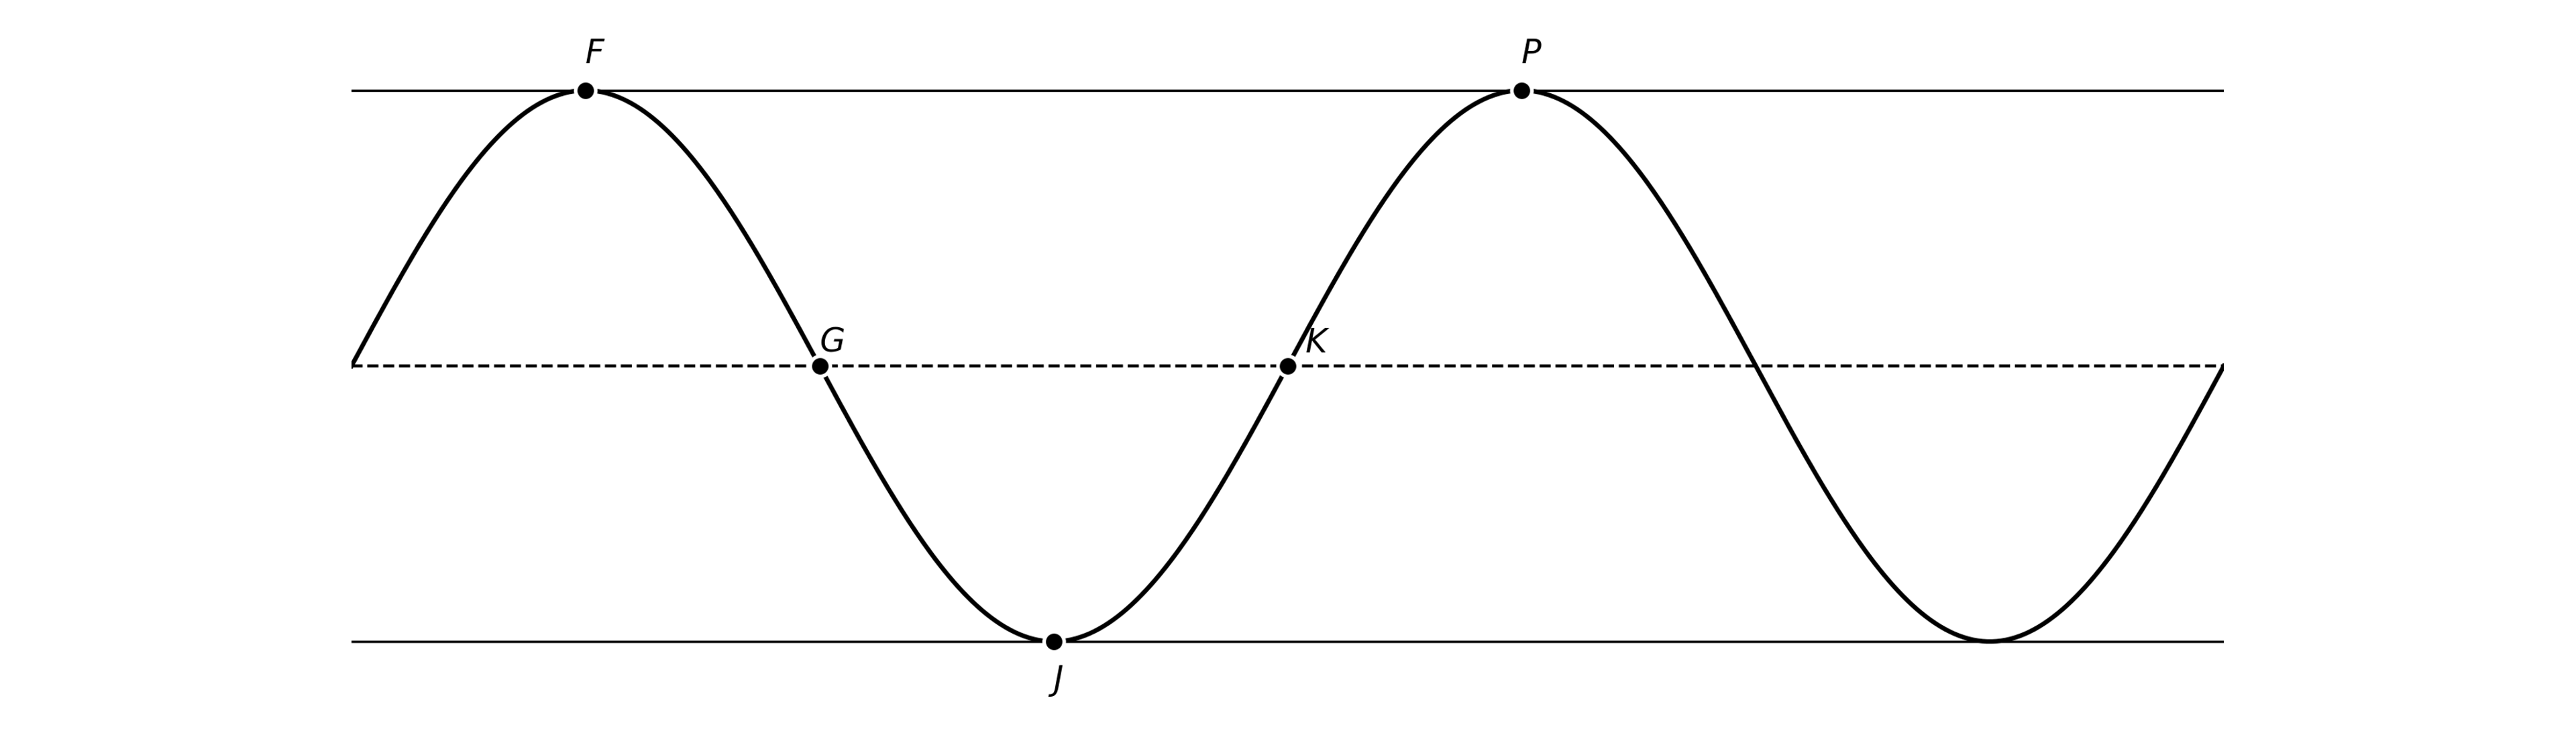
A graph of h and its dashed midline for two full cycles is shown. Five points F, G, J, K and P are labeled on the graph. No scale is indicated and no axes are presented. Determine possible coordinates (t, h(t)) for the five points: F, G, J, K and P.

A black-and-white sketch of a cosine wave showing two full cycles. the graph has a horizontal dashed midline and solid horizontal lines at the maximum and minimum values. Five points are labeled in italics: F at a peak, G where the graph crosses the midline while decreasing, J at a trough, K where the graph crosses the midline while increasing, and P at the next peak. the axes are not shown.
11b
Sme Calculator
2 marks

The function h can be written in the form h(t)=acos(b(t+c))+d. Find the values of constants a, b, c and d.

12a
Sme Calculator
2 marks
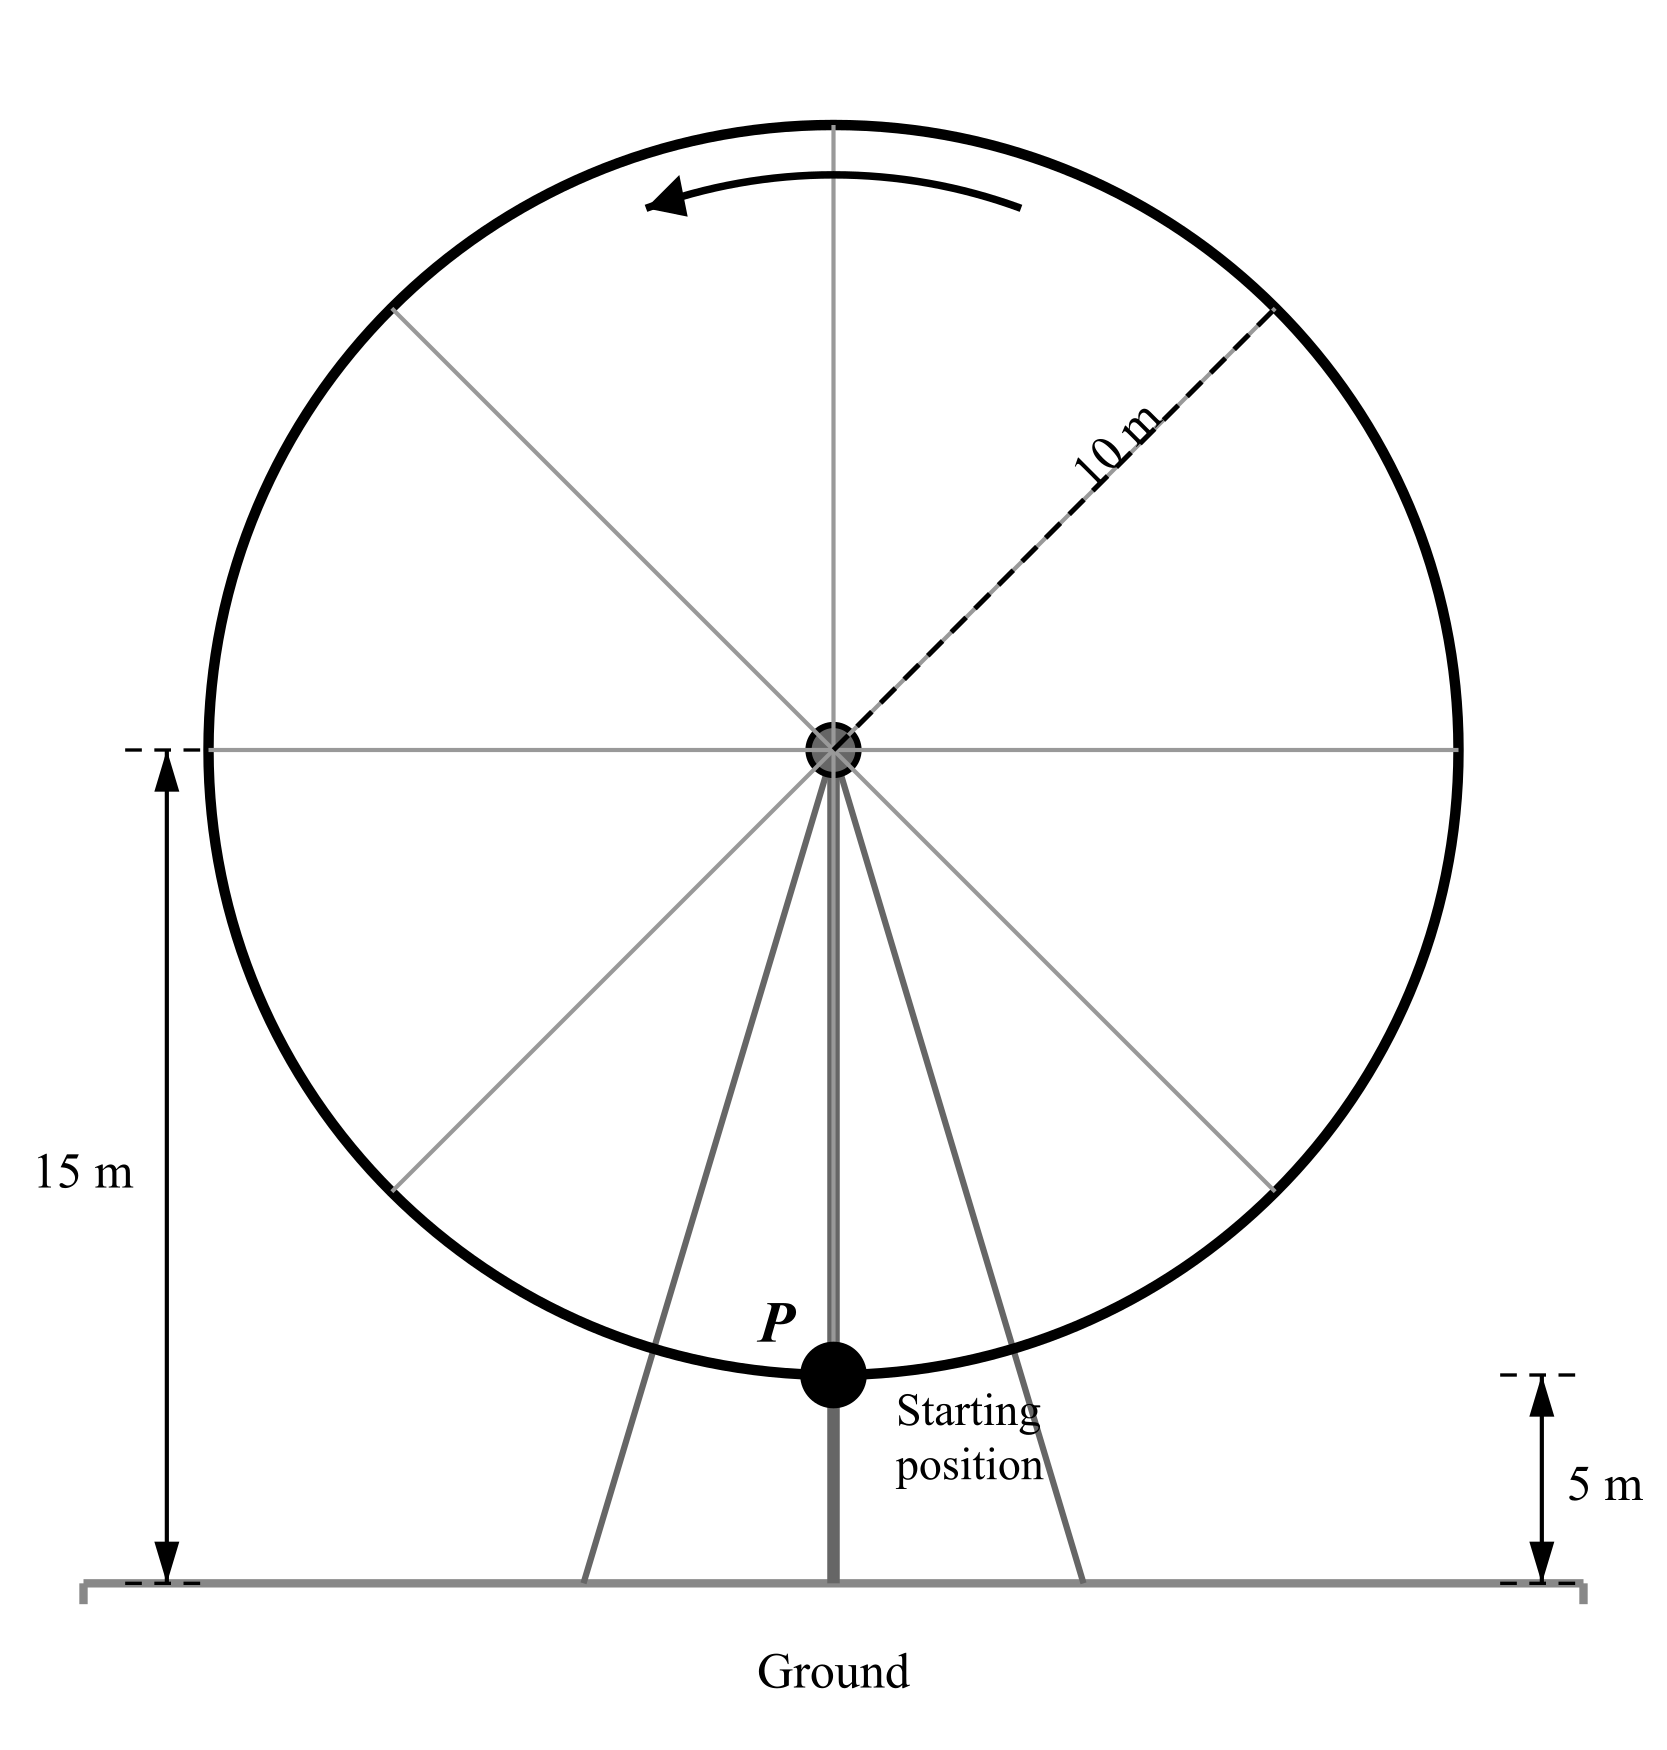
Diagram of a Ferris wheel with center 15 meters above the ground and radius 10 meters. The lowest point is 5 meters above the ground. A passenger starts at the bottom (lowest point) at t = 0 and the wheel rotates counterclockwise.

A Ferris wheel at an amusement park has a radius of 10 meters. The center of the Ferris wheel is 15 meters above the ground. At time t=0 seconds, a passenger at point P is at the lowest point of the Ferris wheel, as indicated in the figure. The Ferris wheel rotates at a constant speed in a counterclockwise direction and completes one full revolution every 40 seconds. As the wheel rotates, the height of point P above the ground periodically increases and decreases.

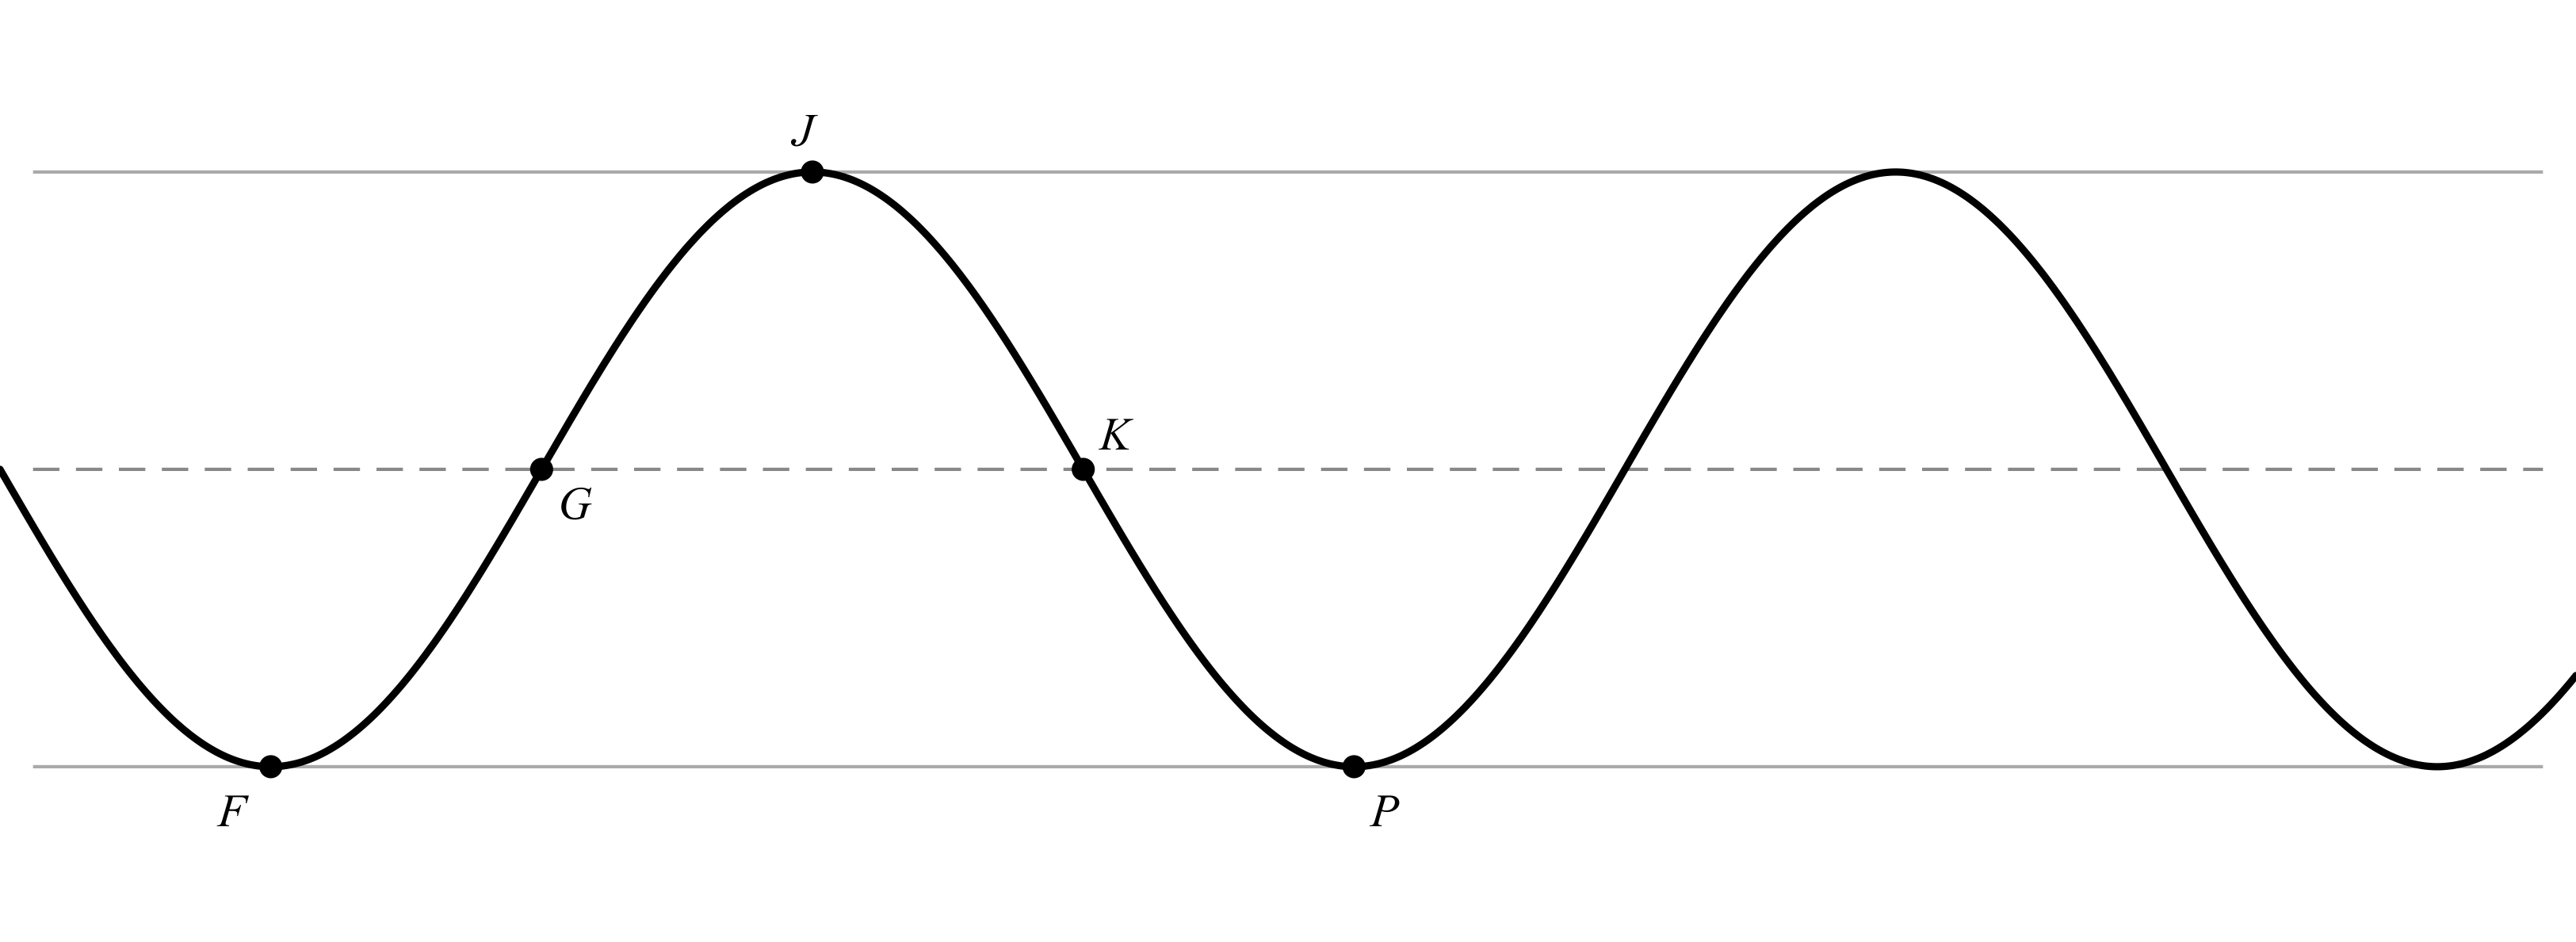
The sinusoidal function h models the height of point P above the ground, in meters, as a function of time t, in seconds.

A graph of h and its dashed midline for two full cycles is shown. Five points F, G, J, K and P are labeled on the graph. No scale is indicated and no axes are presented.

Determine possible coordinates (t, h(t)) for the five points: F, G, J, K and P.

A black-and-white sketch of a sine wave showing two full cycles. the graph has a horizontal dashed midline and solid horizontal lines at the maximum and minimum values. Five points are labeled in italics: F at a trough, G where the graph crosses the midline while increasing, J at a peak, K where the graph crosses the midline while decreasing, and P at the next trough. The axes are not shown.
12b
Sme Calculator
2 marks

The function h can be written in the form h(t)=asin(b(t+c))+d. Find the values of constants a, b, c and d.

13a
Sme Calculator
1 mark

The function h is given by h(t)=4sin(πt6)+5.

Find all values of t in the interval 0t12 for which h(t)=7, or indicate that there are no such values. Show the work that leads to your answer.

13b
Sme Calculator
2 marks

Find all real values of t for which h(t)=9. Show the work that leads to your answer.

14
Sme Calculator
2 marks

The function g can be written in the form g(x)=asin(b(x+c))+d, where a, b, c, and d are real numbers. The graph of g has a maximum value of 7 and a minimum value of 1. The graph crosses its midline going downward at x=5 and has its next relative maximum at x=8.

Find values of a, b, c, and d.

15a
Sme Calculator
2 marks

A wind turbine blade tip rotates so that the height of a marked point on the tip above the ground is modeled by a sinusoidal function h of time t, where t is measured in seconds and h(t) is in meters. The function h has a maximum value of 80 meters and a minimum value of 20 meters. The marked point first reaches its maximum height at t=1, and the period of h is 6 seconds.

The function h can be written in the form h(t)=asin(b(t+c))+d, where a, b, c, and d are real numbers.

Find values of constants a, b, c, and d.

15b
Sme Calculator
1 mark

On the interval (2.5, 4), describe the concavity of the graph of h and determine whether the rate of change of h is increasing or decreasing.