Constructing Sinusoidal Function Models (College Board AP® Precalculus): Revision Note

Sinusoidal models
How can the period be determined from a context or data?
The period is
the smallest interval of input values
over which the output values complete one full cycle
and then begin to repeat
In practical terms, the period can be found by identifying the distance between consecutive maxima or consecutive minima
E.g. if a sinusoidal function has maxima at and
the period is
The period can also be estimated from a table of values
by looking for where the output values start cycling through the same pattern again
If the frequency is given (the number of complete cycles per unit)
then remember that the period is its reciprocal
E.g. if a quantity oscillates 4 times per second, the period is seconds
How can the amplitude and vertical shift be determined?
The maximum and minimum output values can be used to find both
the amplitude
and the vertical shift
In a context-based question, the maximum and minimum are often stated directly
or can be deduced from the given information
E.g. if a temperature ranges from to
then the amplitude is
and the vertical shift is
How can the phase shift be determined?
Once the amplitude, vertical shift, and period are known, the phase shift can be estimated
by comparing an actual known input-output pair
to the values predicted by the model without any phase shift
In practice, the phase shift is determined by identifying where in the cycle the function starts
If a sine model is being used
Identify the input value where the function first crosses the midline going upward
the phase shift equals that input value
This works because the untransformed function crosses the midline going upward at
If a cosine model is being used
Identify the input value where the first maximum occurs
the phase shift equals that input value
This works because the untransformed function has a maximum point at
There can be more than one possible correct value for a phase shift
Adding or subtracting to a phase shift determined by the methods above will give another valid phase shift value
Examiner Tips and Tricks
Remember that in a sinusoidal function of form or , the phase shift is equal to (not ).
E.g. if a sine function first crosses the midline going upward at
That is a shift of the basic sine function by to the right
So
Therefore the function will be of the form
How can sinusoidal models be constructed using technology?
For a data set that appears to follow a sinusoidal pattern a sinusoidal regression can be performed using a graphing calculator
This produces values for the parameters , , , and that best fit the data
However be careful
Your calculator may give those values for a function in the form
I.e., not in 'factored form' like
You can convert to factored form if necessary
Alternatively, the key values (amplitude, period, vertical shift) can be estimated from a graph or table
and then used to build the model manually
Both approaches are valid on the exam
Sinusoidal regressions are especially useful when the data does not fall exactly on a sinusoidal curve
What is a contextual domain, and how does it affect the model?
Sinusoidal function models often have a contextual domain
i.e. a restricted range of input values over which the model is meaningful
E.g. a model for daily temperature over a year might only be valid for
Or a model for the height of a point on a spinning wheel might only be valid for
Within the contextual domain, the model can be used
to predict values of the dependent variable
from values of the independent variable
The model can also be used in reverse
i.e. given a value of the dependent variable
the independent variable can be predicted
by solving the equation for the independent variable
E.g. given a temperature model , you could be asked to find at what time the temperature reaches a particular value
Outside the contextual domain, the model's predictions may not be meaningful
even though the mathematical function continues to produce output values
How should the five key points on a sinusoidal graph be labeled?
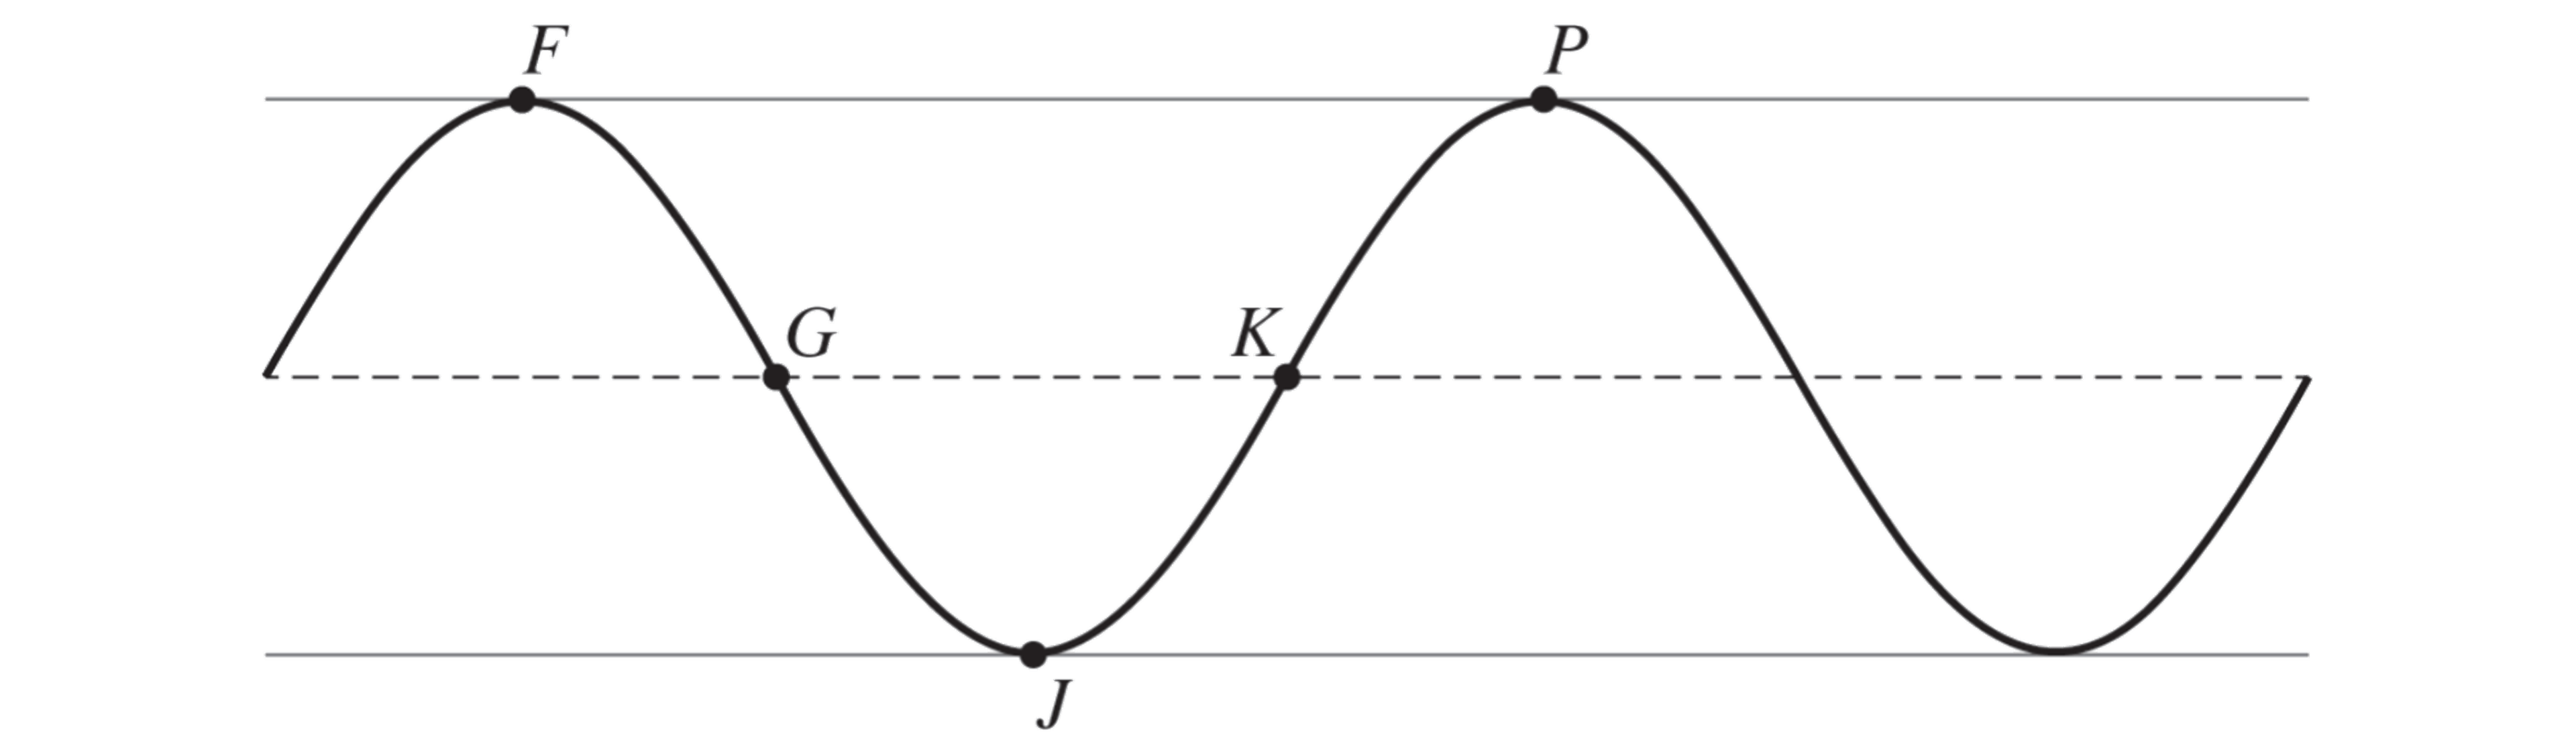
On the exam, free response question 3 always presents
a generic sinusoidal graph (without scale or axes)
showing two full cycles
with five labeled points (usually , , , , and )

Students must assign coordinates to each point based on the context
The five points correspond to the key features of the sinusoidal graph
and are two successive maxima
is a minimum
and are on the midline
while the function is decreasing, while it is increasing
To find the coordinates
For -coordinates (vertical)
Use the context to determine the maximum, minimum, and midline values
For -coordinates (horizontal)
Use the period and the phase shift to determine the time at each key feature
Horizontally, the key points are all one quarter of the period apart
i.e. from max to midline is one quarter period
as are midline to min, min to midline, and midline to max
Examiner Tips and Tricks
For a question of this sort, the -coordinates are generally easier to determine than the -coordinates. The chief reader reports consistently show that most students who earn the -coordinate point go on to struggle more with the -coordinates.
Make sure you understand how the period relates to the spacing between key points.
The time between any two adjacent key points (max → midline → min → midline → max) is always one quarter of the period
Also note that the -coordinates do not have to start at .
The context determines where the cycle begins, so pay close attention to what the context tells you about the starting conditions
Worked Example
A weight attached to a spring oscillates vertically. At time seconds, the weight is at its highest point, 14 cm above the table. It then moves downward to its lowest point, 4 cm above the table, and returns to 14 cm above. One complete oscillation takes seconds.
The sinusoidal function models the height of the weight above the table, in cm, as a function of time , in seconds.
The graph of and its dashed midline for two full cycles is shown. Five points, , , , , and , are labeled on the graph. No scale is indicated, and no axes are presented.
Determine possible coordinates for the five points: , , , , and .
Answer:
First find the -coordinates
From the context, the maximum height is 14 cm and the minimum height is 4 cm
This gives
Therefore
and (maxima) have
and (midline) have
(minimum) has
Now find the -coordinates:
The period (time for one complete oscillation) is seconds
so the time between consecutive key points is
seconds
The weight is at its highest point at , which corresponds to
Therefore
: (maximum)
: (midline, going down)
: (minimum)
: (midline, going up)
: (next maximum)
So the five points are
Worked Example
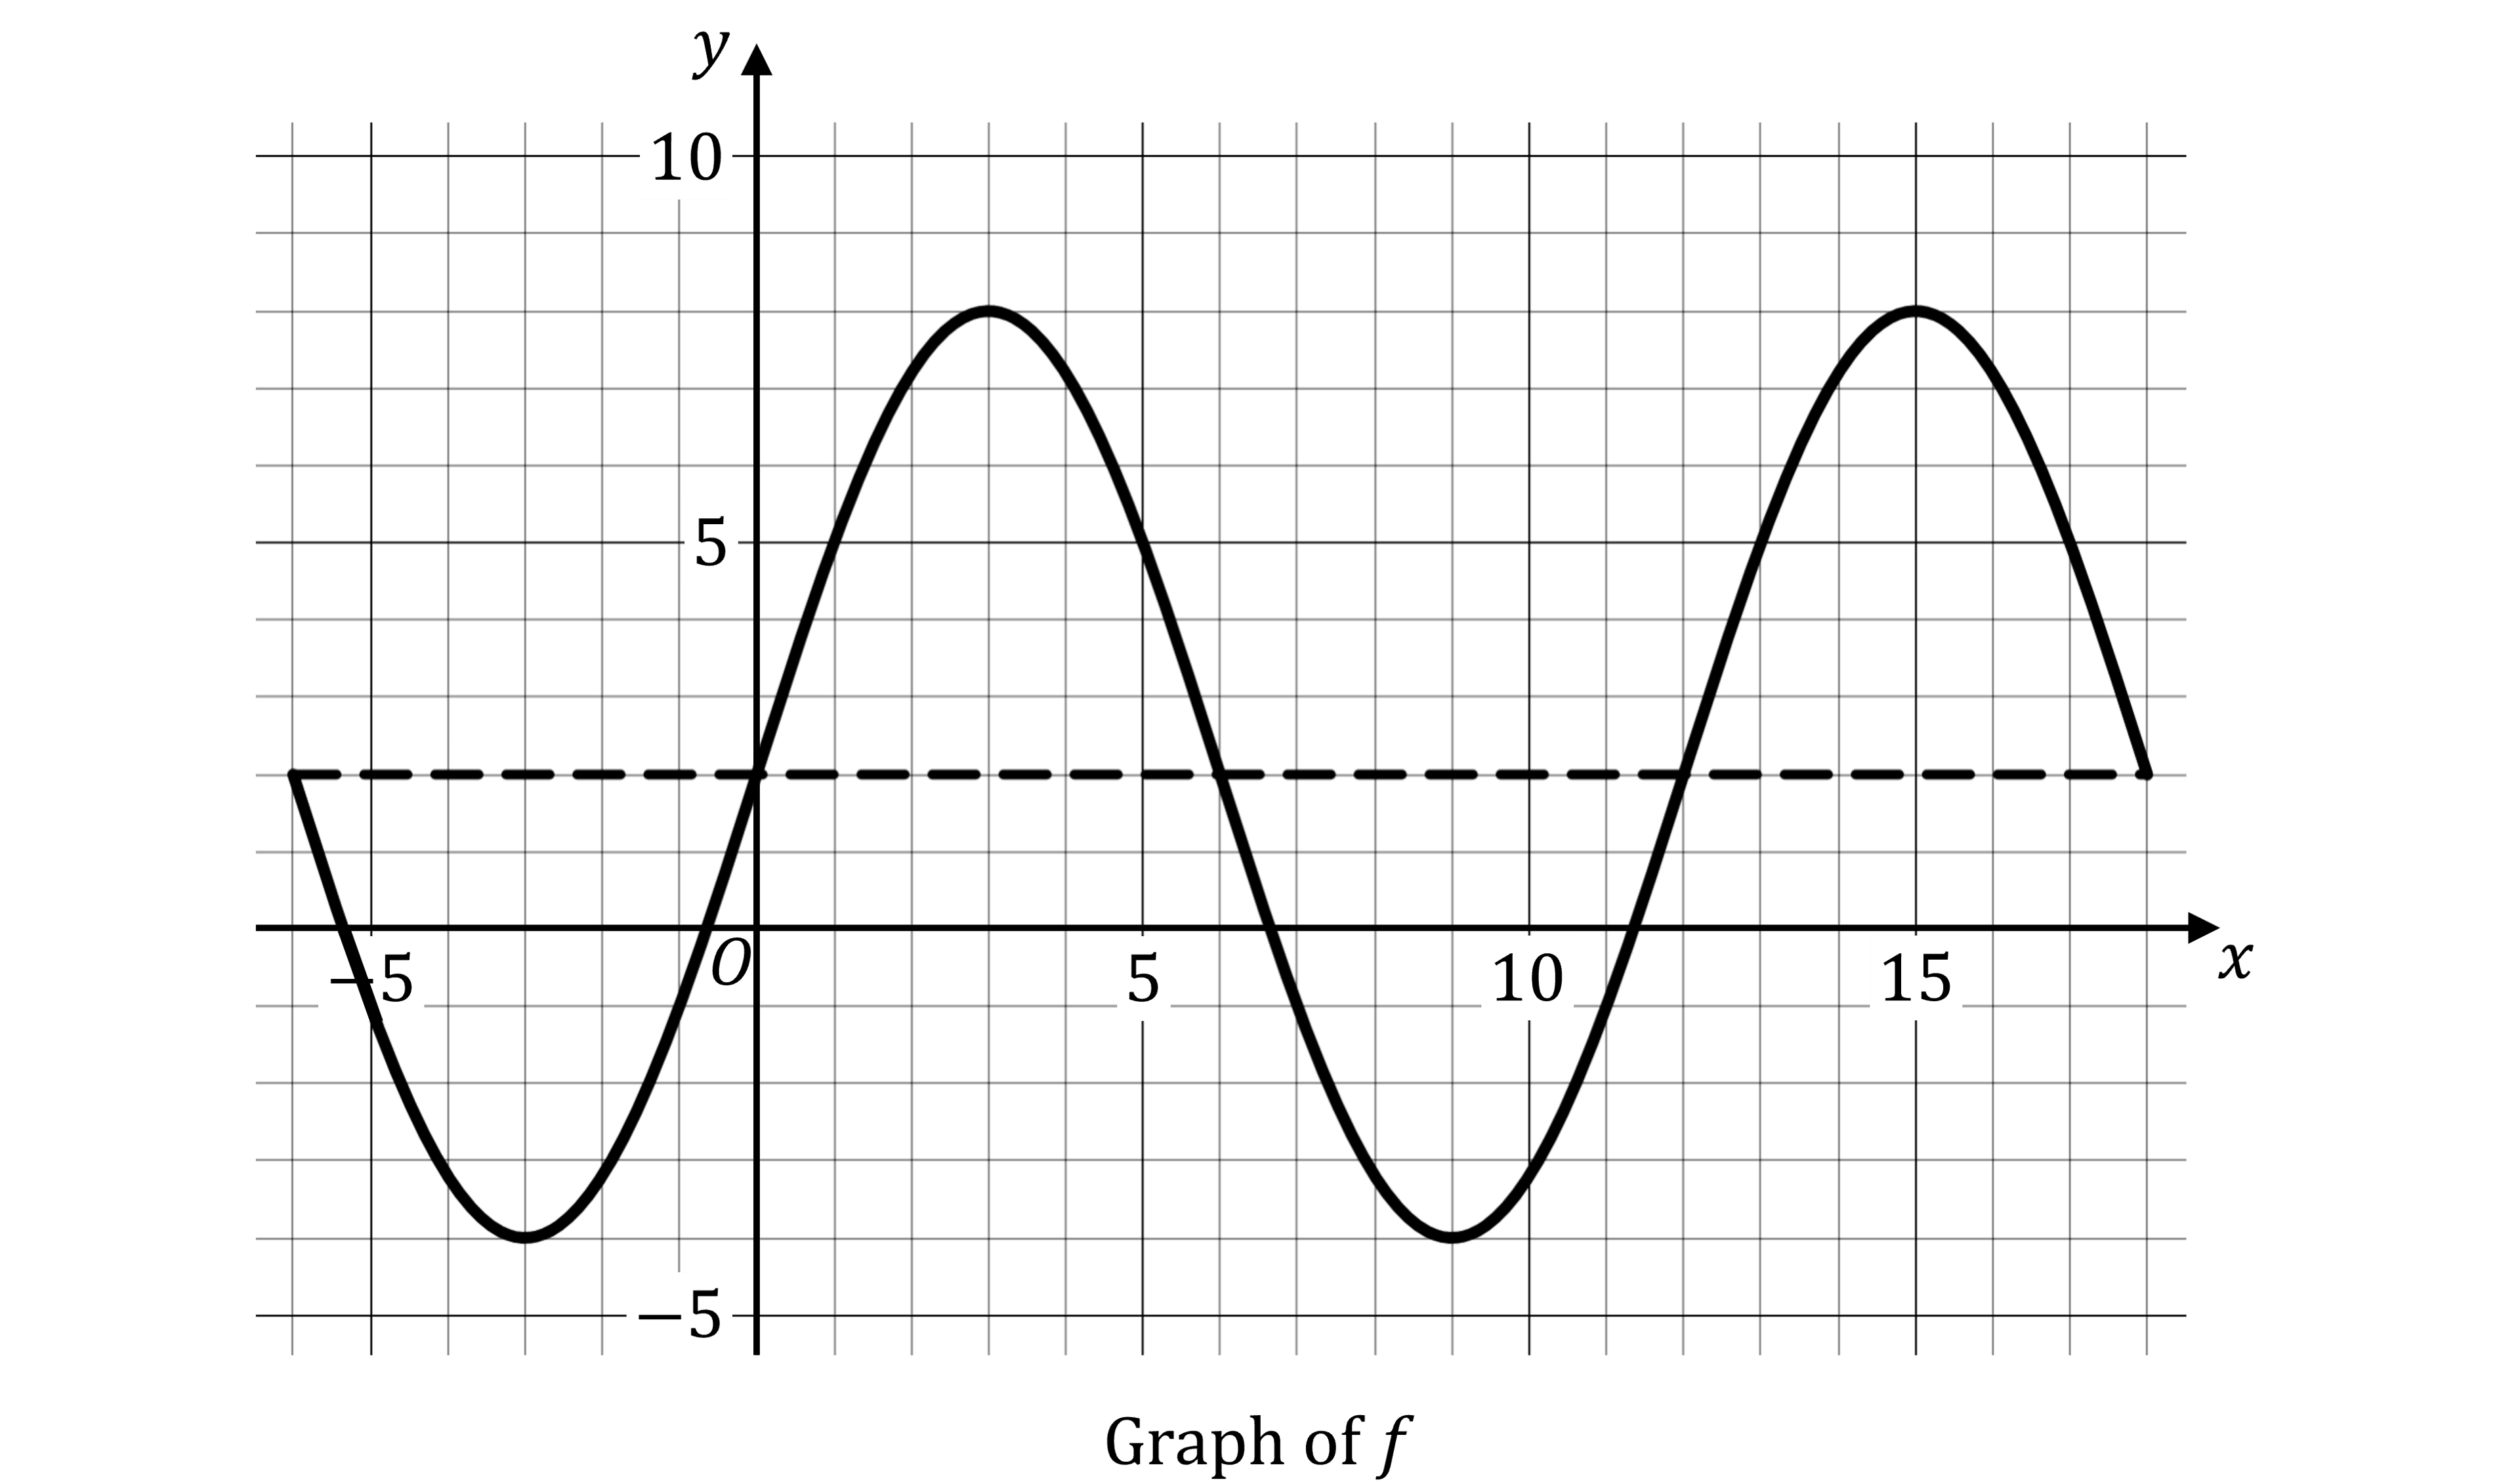
The figure shows the graph of a sinusoidal function , along with a dashed line showing the midline of the function. The function can be written in the form , where . What is the value of ?
(A)
(B)
(C)
(D)
Answer
The value of is connected to the period of the function
The period can be determined from the distance between two consecutive maxima
and the maxima on the graph are at and , so
Now use the relationship :
And you are told that , so
(B)

Unlock more, it's free!
Join the 100,000+ Students that ❤️ Save My Exams
the (exam) results speak for themselves:

Was this revision note helpful?
Build on this topic