Graphs & Zeros of Functions (College Board AP® Precalculus): Revision Note

Graph basics
What is the graph of a function?
The graph of a function is a way of displaying a set of input and output pairs for the function
E.g. for every point
format('truetype')%3Bfont-weight%3Anormal%3Bfont-style%3Anormal%3B%7D%40font-face%7Bfont-family%3A'round_brackets18549f92a457f2409'%3Bsrc%3Aurl(data%3Afont%2Ftruetype%3Bcharset%3Dutf-8%3Bbase64%2CAAEAAAAMAIAAAwBAT1MvMjwHLFQAAADMAAAATmNtYXDf7xCrAAABHAAAADxjdnQgBAkDLgAAAVgAAAASZ2x5ZmAOz2cAAAFsAAABJGhlYWQOKih8AAACkAAAADZoaGVhCvgVwgAAAsgAAAAkaG10eCA6AAIAAALsAAAADGxvY2EAAARLAAAC%2BAAAABBtYXhwBIgEWQAAAwgAAAAgbmFtZXHR30MAAAMoAAACOXBvc3QDogHPAAAFZAAAACBwcmVwupWEAAAABYQAAAAHAAAGcgGQAAUAAAgACAAAAAAACAAIAAAAAAAAAQIAAAAAAAAAAAAAAAAAAAAAAAAAAAAAAAAAAAAAACAgICAAAAAo8AMGe%2F57AAAHPgGyAAAAAAACAAEAAQAAABQAAwABAAAAFAAEACgAAAAGAAQAAQACACgAKf%2F%2FAAAAKAAp%2F%2F%2F%2F2f%2FZAAEAAAAAAAAAAAFUAFYBAAAsAKgDgAAyAAcAAAACAAAAKgDVA1UAAwAHAAA1MxEjEyMRM9XVq4CAKgMr%2FQAC1QABAAD%2B0AIgBtAACQBNGAGwChCwA9SwAxCwAtSwChCwBdSwBRCwANSwAxCwBzywAhCwCDwAsAoQsAPUsAMQsAfUsAoQsAXUsAoQsADUsAMQsAI8sAcQsAg8MTAREAEzABEQASMAAZCQ%2FnABkJD%2BcALQ%2FZD%2BcAGQAnACcAGQ%2FnAAAQAA%2FtACIAbQAAkATRgBsAoQsAPUsAMQsALUsAoQsAXUsAUQsADUsAMQsAc8sAIQsAg8ALAKELAD1LADELAH1LAKELAF1LAKELAA1LADELACPLAHELAIPDEwARABIwAREAEzAAIg%2FnCQAZD%2BcJABkALQ%2FZD%2BcAGQAnACcAGQ%2FnAAAQAAAAEAAPW2NYFfDzz1AAMIAP%2F%2F%2F%2F%2FVre7u%2F%2F%2F%2F%2F9Wt7u4AAP7QA7cG0AAAAAoAAgABAAAAAAABAAAHPv5OAAAXcAAA%2F%2F4DtwABAAAAAAAAAAAAAAAAAAAAAwDVAAACIAAAAiAAAAAAAAAAAAAkAAAAowAAASQAAQAAAAMACgACAAAAAAACAIAEAAAAAAAEAABNAAAAAAAAABUBAgAAAAAAAAABAD4AAAAAAAAAAAACAA4APgAAAAAAAAADAFwATAAAAAAAAAAEAD4AqAAAAAAAAAAFABYA5gAAAAAAAAAGAB8A%2FAAAAAAAAAAIABwBGwABAAAAAAABAD4AAAABAAAAAAACAA4APgABAAAAAAADAFwATAABAAAAAAAEAD4AqAABAAAAAAAFABYA5gABAAAAAAAGAB8A%2FAABAAAAAAAIABwBGwADAAEECQABAD4AAAADAAEECQACAA4APgADAAEECQADAFwATAADAAEECQAEAD4AqAADAAEECQAFABYA5gADAAEECQAGAB8A%2FAADAAEECQAIABwBGwBSAG8AdQBuAGQAIABiAHIAYQBjAGsAZQB0AHMAIAB3AGkAdABoACAAYQBzAGMAZQBuAHQAIAAxADgANQA0AFIAZQBnAHUAbABhAHIATQBhAHQAaABzACAARgBvAHIAIABNAG8AcgBlACAAUgBvAHUAbgBkACAAYgByAGEAYwBrAGUAdABzACAAdwBpAHQAaAAgAGEAcwBjAGUAbgB0ACAAMQA4ADUANABSAG8AdQBuAGQAIABiAHIAYQBjAGsAZQB0AHMAIAB3AGkAdABoACAAYQBzAGMAZQBuAHQAIAAxADgANQA0AFYAZQByAHMAaQBvAG4AIAAyAC4AMFJvdW5kX2JyYWNrZXRzX3dpdGhfYXNjZW50XzE4NTQATQBhAHQAaABzACAARgBvAHIAIABNAG8AcgBlAAAAAAMAAAAAAAADnwHPAAAAAAAAAAAAAAAAAAAAAAAAAAC5B%2F8AAY2FAA%3D%3D)format('truetype')%3Bfont-weight%3Anormal%3Bfont-style%3Anormal%3B%7D%3C%2Fstyle%3E%3C%2Fdefs%3E%3Ctext%20font-family%3D%22round_brackets18549f92a457f2409%22%20font-size%3D%2218%22%20text-anchor%3D%22middle%22%20x%3D%223.5%22%20y%3D%2216%22%3E(%3C%2Ftext%3E%3Ctext%20font-family%3D%22round_brackets18549f92a457f2409%22%20font-size%3D%2218%22%20text-anchor%3D%22middle%22%20x%3D%2258.5%22%20y%3D%2216%22%3E)%3C%2Ftext%3E%3Ctext%20font-family%3D%22Times%20New%20Roman%22%20font-size%3D%2218%22%20font-style%3D%22italic%22%20text-anchor%3D%22middle%22%20x%3D%2210.5%22%20y%3D%2216%22%3Ex%3C%2Ftext%3E%3Ctext%20font-family%3D%22math1f7177163c833dff4b38fc8d287%22%20font-size%3D%2216%22%20text-anchor%3D%22middle%22%20x%3D%2218.5%22%20y%3D%2216%22%3E%2C%3C%2Ftext%3E%3Ctext%20font-family%3D%22Times%20New%20Roman%22%20font-size%3D%2218%22%20font-style%3D%22italic%22%20text-anchor%3D%22middle%22%20x%3D%2228.5%22%20y%3D%2216%22%3Ef%3C%2Ftext%3E%3Ctext%20font-family%3D%22round_brackets18549f92a457f2409%22%20font-size%3D%2218%22%20text-anchor%3D%22middle%22%20x%3D%2237.5%22%20y%3D%2216%22%3E(%3C%2Ftext%3E%3Ctext%20font-family%3D%22round_brackets18549f92a457f2409%22%20font-size%3D%2218%22%20text-anchor%3D%22middle%22%20x%3D%2252.5%22%20y%3D%2216%22%3E)%3C%2Ftext%3E%3Ctext%20font-family%3D%22Times%20New%20Roman%22%20font-size%3D%2218%22%20font-style%3D%22italic%22%20text-anchor%3D%22middle%22%20x%3D%2244.5%22%20y%3D%2216%22%3Ex%3C%2Ftext%3E%3C%2Fsvg%3E) on the graph of
on the graph of format('truetype')%3Bfont-weight%3Anormal%3Bfont-style%3Anormal%3B%7D%40font-face%7Bfont-family%3A'round_brackets18549f92a457f2409'%3Bsrc%3Aurl(data%3Afont%2Ftruetype%3Bcharset%3Dutf-8%3Bbase64%2CAAEAAAAMAIAAAwBAT1MvMjwHLFQAAADMAAAATmNtYXDf7xCrAAABHAAAADxjdnQgBAkDLgAAAVgAAAASZ2x5ZmAOz2cAAAFsAAABJGhlYWQOKih8AAACkAAAADZoaGVhCvgVwgAAAsgAAAAkaG10eCA6AAIAAALsAAAADGxvY2EAAARLAAAC%2BAAAABBtYXhwBIgEWQAAAwgAAAAgbmFtZXHR30MAAAMoAAACOXBvc3QDogHPAAAFZAAAACBwcmVwupWEAAAABYQAAAAHAAAGcgGQAAUAAAgACAAAAAAACAAIAAAAAAAAAQIAAAAAAAAAAAAAAAAAAAAAAAAAAAAAAAAAAAAAACAgICAAAAAo8AMGe%2F57AAAHPgGyAAAAAAACAAEAAQAAABQAAwABAAAAFAAEACgAAAAGAAQAAQACACgAKf%2F%2FAAAAKAAp%2F%2F%2F%2F2f%2FZAAEAAAAAAAAAAAFUAFYBAAAsAKgDgAAyAAcAAAACAAAAKgDVA1UAAwAHAAA1MxEjEyMRM9XVq4CAKgMr%2FQAC1QABAAD%2B0AIgBtAACQBNGAGwChCwA9SwAxCwAtSwChCwBdSwBRCwANSwAxCwBzywAhCwCDwAsAoQsAPUsAMQsAfUsAoQsAXUsAoQsADUsAMQsAI8sAcQsAg8MTAREAEzABEQASMAAZCQ%2FnABkJD%2BcALQ%2FZD%2BcAGQAnACcAGQ%2FnAAAQAA%2FtACIAbQAAkATRgBsAoQsAPUsAMQsALUsAoQsAXUsAUQsADUsAMQsAc8sAIQsAg8ALAKELAD1LADELAH1LAKELAF1LAKELAA1LADELACPLAHELAIPDEwARABIwAREAEzAAIg%2FnCQAZD%2BcJABkALQ%2FZD%2BcAGQAnACcAGQ%2FnAAAQAAAAEAAPW2NYFfDzz1AAMIAP%2F%2F%2F%2F%2FVre7u%2F%2F%2F%2F%2F9Wt7u4AAP7QA7cG0AAAAAoAAgABAAAAAAABAAAHPv5OAAAXcAAA%2F%2F4DtwABAAAAAAAAAAAAAAAAAAAAAwDVAAACIAAAAiAAAAAAAAAAAAAkAAAAowAAASQAAQAAAAMACgACAAAAAAACAIAEAAAAAAAEAABNAAAAAAAAABUBAgAAAAAAAAABAD4AAAAAAAAAAAACAA4APgAAAAAAAAADAFwATAAAAAAAAAAEAD4AqAAAAAAAAAAFABYA5gAAAAAAAAAGAB8A%2FAAAAAAAAAAIABwBGwABAAAAAAABAD4AAAABAAAAAAACAA4APgABAAAAAAADAFwATAABAAAAAAAEAD4AqAABAAAAAAAFABYA5gABAAAAAAAGAB8A%2FAABAAAAAAAIABwBGwADAAEECQABAD4AAAADAAEECQACAA4APgADAAEECQADAFwATAADAAEECQAEAD4AqAADAAEECQAFABYA5gADAAEECQAGAB8A%2FAADAAEECQAIABwBGwBSAG8AdQBuAGQAIABiAHIAYQBjAGsAZQB0AHMAIAB3AGkAdABoACAAYQBzAGMAZQBuAHQAIAAxADgANQA0AFIAZQBnAHUAbABhAHIATQBhAHQAaABzACAARgBvAHIAIABNAG8AcgBlACAAUgBvAHUAbgBkACAAYgByAGEAYwBrAGUAdABzACAAdwBpAHQAaAAgAGEAcwBjAGUAbgB0ACAAMQA4ADUANABSAG8AdQBuAGQAIABiAHIAYQBjAGsAZQB0AHMAIAB3AGkAdABoACAAYQBzAGMAZQBuAHQAIAAxADgANQA0AFYAZQByAHMAaQBvAG4AIAAyAC4AMFJvdW5kX2JyYWNrZXRzX3dpdGhfYXNjZW50XzE4NTQATQBhAHQAaABzACAARgBvAHIAIABNAG8AcgBlAAAAAAMAAAAAAAADnwHPAAAAAAAAAAAAAAAAAAAAAAAAAAC5B%2F8AAY2FAA%3D%3D)format('truetype')%3Bfont-weight%3Anormal%3Bfont-style%3Anormal%3B%7D%3C%2Fstyle%3E%3C%2Fdefs%3E%3Ctext%20font-family%3D%22Times%20New%20Roman%22%20font-size%3D%2218%22%20font-style%3D%22italic%22%20text-anchor%3D%22middle%22%20x%3D%224.5%22%20y%3D%2216%22%3Ey%3C%2Ftext%3E%3Ctext%20font-family%3D%22math17f39f8317fbdb1988ef4c628eb%22%20font-size%3D%2216%22%20text-anchor%3D%22middle%22%20x%3D%2218.5%22%20y%3D%2216%22%3E%3D%3C%2Ftext%3E%3Ctext%20font-family%3D%22Times%20New%20Roman%22%20font-size%3D%2218%22%20font-style%3D%22italic%22%20text-anchor%3D%22middle%22%20x%3D%2230.5%22%20y%3D%2216%22%3Ef%3C%2Ftext%3E%3Ctext%20font-family%3D%22round_brackets18549f92a457f2409%22%20font-size%3D%2218%22%20text-anchor%3D%22middle%22%20x%3D%2239.5%22%20y%3D%2216%22%3E(%3C%2Ftext%3E%3Ctext%20font-family%3D%22round_brackets18549f92a457f2409%22%20font-size%3D%2218%22%20text-anchor%3D%22middle%22%20x%3D%2254.5%22%20y%3D%2216%22%3E)%3C%2Ftext%3E%3Ctext%20font-family%3D%22Times%20New%20Roman%22%20font-size%3D%2218%22%20font-style%3D%22italic%22%20text-anchor%3D%22middle%22%20x%3D%2246.5%22%20y%3D%2216%22%3Ex%3C%2Ftext%3E%3C%2Fsvg%3E)
the
 coordinate
 format('truetype')%3Bfont-weight%3Anormal%3Bfont-style%3Anormal%3B%7D%3C%2Fstyle%3E%3C%2Fdefs%3E%3Ctext%20font-family%3D%22Times%20New%20Roman%22%20font-size%3D%2218%22%20font-style%3D%22italic%22%20text-anchor%3D%22middle%22%20x%3D%223.5%22%20y%3D%2216%22%3Ef%3C%2Ftext%3E%3Ctext%20font-family%3D%22round_brackets18549f92a457f2409%22%20font-size%3D%2218%22%20text-anchor%3D%22middle%22%20x%3D%2212.5%22%20y%3D%2216%22%3E(%3C%2Ftext%3E%3Ctext%20font-family%3D%22round_brackets18549f92a457f2409%22%20font-size%3D%2218%22%20text-anchor%3D%22middle%22%20x%3D%2227.5%22%20y%3D%2216%22%3E)%3C%2Ftext%3E%3Ctext%20font-family%3D%22Times%20New%20Roman%22%20font-size%3D%2218%22%20font-style%3D%22italic%22%20text-anchor%3D%22middle%22%20x%3D%2219.5%22%20y%3D%2216%22%3Ex%3C%2Ftext%3E%3C%2Fsvg%3E) shows the output value of the function when the input value is
shows the output value of the function when the input value is 
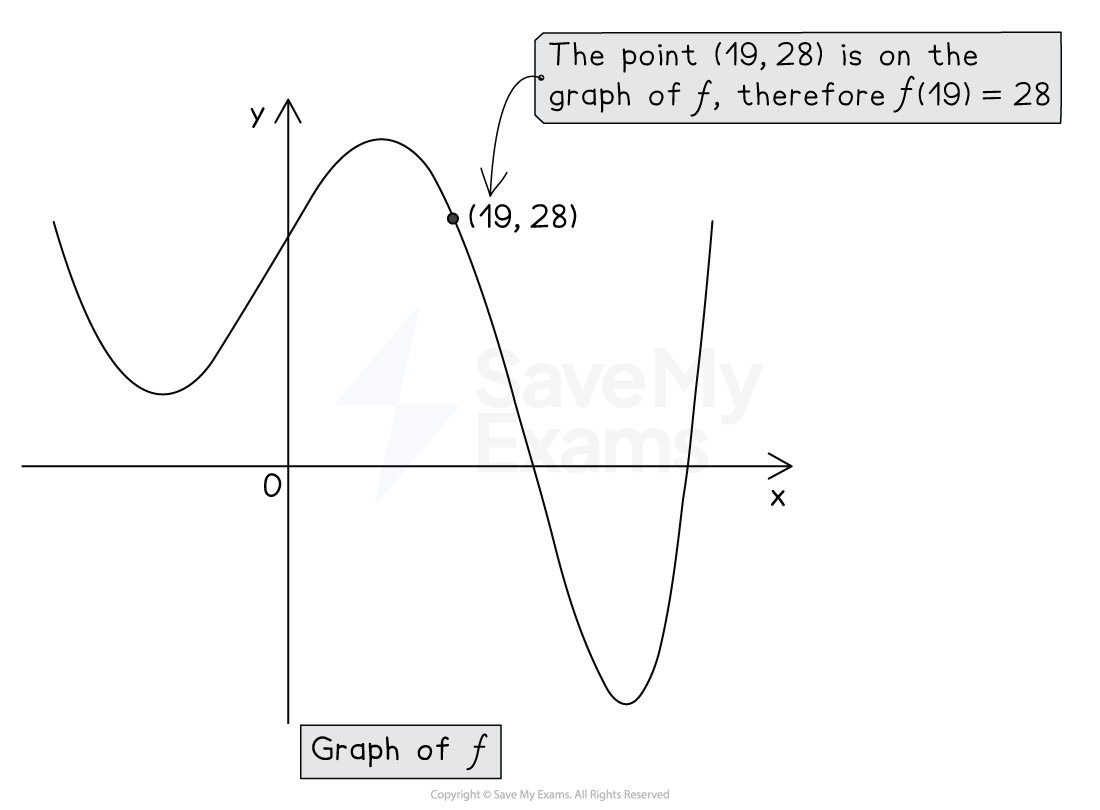
A graph shows how the function's input and output values vary
The pictorial nature of a graph can make this much easier to see in a graph than in, say, a table of input and output values
A graph does not need to be based on an explicit equation representing the function
A verbal description of the way phenomena change together can be used as the basis for constructing a graph
See the Worked Example
What is the rate of change of a linear graph?
A linear graph has the form of a straight line
The rate of change of the graph is equivalent to the slope of the straight line
A positive slope indicates an increasing graph
As
increases, also increases
A negative slope indicates a decreasing graph
As
increases, decreases
A steeper slope shows a faster rate of change
A horizontal line (slope = 0) indicates no change
As
increases, stays the same

Zeros of a function
What is a zero of a function?
The graph of a function intersects the
-axis when the output value is zeroformat('truetype')%3Bfont-weight%3Anormal%3Bfont-style%3Anormal%3B%7D%3C%2Fstyle%3E%3C%2Fdefs%3E%3Ctext%20font-family%3D%22Times%20New%20Roman%22%20font-size%3D%2218%22%20font-style%3D%22italic%22%20font-weight%3D%22bold%22%20text-anchor%3D%22middle%22%20x%3D%225.5%22%20y%3D%2216%22%3Ey%3C%2Ftext%3E%3Ctext%20font-family%3D%22math17f39f8317fbdb1988ef4c628eb%22%20font-size%3D%2216%22%20font-weight%3D%22bold%22%20text-anchor%3D%22middle%22%20x%3D%2220.5%22%20y%3D%2216%22%3E%3D%3C%2Ftext%3E%3Ctext%20font-family%3D%22Times%20New%20Roman%22%20font-size%3D%2218%22%20font-weight%3D%22bold%22%20text-anchor%3D%22middle%22%20x%3D%2234.5%22%20y%3D%2216%22%3E0%3C%2Ftext%3E%3C%2Fsvg%3E) at those points
at those pointsThe input values that correspond to those points are called the zeros of the function

How can I find the zeros of a function?
You may be able to read the zeros off of an accurate graph of the function
Look for the
coordinates of the points where the graph crosses or touches the horizontal axis
If you know the equation of a function, then you can find the zeros
by setting the equation equal to zero
and solving for
E.g.
format('truetype')%3Bfont-weight%3Anormal%3Bfont-style%3Anormal%3B%7D%40font-face%7Bfont-family%3A'round_brackets18549f92a457f2409'%3Bsrc%3Aurl(data%3Afont%2Ftruetype%3Bcharset%3Dutf-8%3Bbase64%2CAAEAAAAMAIAAAwBAT1MvMjwHLFQAAADMAAAATmNtYXDf7xCrAAABHAAAADxjdnQgBAkDLgAAAVgAAAASZ2x5ZmAOz2cAAAFsAAABJGhlYWQOKih8AAACkAAAADZoaGVhCvgVwgAAAsgAAAAkaG10eCA6AAIAAALsAAAADGxvY2EAAARLAAAC%2BAAAABBtYXhwBIgEWQAAAwgAAAAgbmFtZXHR30MAAAMoAAACOXBvc3QDogHPAAAFZAAAACBwcmVwupWEAAAABYQAAAAHAAAGcgGQAAUAAAgACAAAAAAACAAIAAAAAAAAAQIAAAAAAAAAAAAAAAAAAAAAAAAAAAAAAAAAAAAAACAgICAAAAAo8AMGe%2F57AAAHPgGyAAAAAAACAAEAAQAAABQAAwABAAAAFAAEACgAAAAGAAQAAQACACgAKf%2F%2FAAAAKAAp%2F%2F%2F%2F2f%2FZAAEAAAAAAAAAAAFUAFYBAAAsAKgDgAAyAAcAAAACAAAAKgDVA1UAAwAHAAA1MxEjEyMRM9XVq4CAKgMr%2FQAC1QABAAD%2B0AIgBtAACQBNGAGwChCwA9SwAxCwAtSwChCwBdSwBRCwANSwAxCwBzywAhCwCDwAsAoQsAPUsAMQsAfUsAoQsAXUsAoQsADUsAMQsAI8sAcQsAg8MTAREAEzABEQASMAAZCQ%2FnABkJD%2BcALQ%2FZD%2BcAGQAnACcAGQ%2FnAAAQAA%2FtACIAbQAAkATRgBsAoQsAPUsAMQsALUsAoQsAXUsAUQsADUsAMQsAc8sAIQsAg8ALAKELAD1LADELAH1LAKELAF1LAKELAA1LADELACPLAHELAIPDEwARABIwAREAEzAAIg%2FnCQAZD%2BcJABkALQ%2FZD%2BcAGQAnACcAGQ%2FnAAAQAAAAEAAPW2NYFfDzz1AAMIAP%2F%2F%2F%2F%2FVre7u%2F%2F%2F%2F%2F9Wt7u4AAP7QA7cG0AAAAAoAAgABAAAAAAABAAAHPv5OAAAXcAAA%2F%2F4DtwABAAAAAAAAAAAAAAAAAAAAAwDVAAACIAAAAiAAAAAAAAAAAAAkAAAAowAAASQAAQAAAAMACgACAAAAAAACAIAEAAAAAAAEAABNAAAAAAAAABUBAgAAAAAAAAABAD4AAAAAAAAAAAACAA4APgAAAAAAAAADAFwATAAAAAAAAAAEAD4AqAAAAAAAAAAFABYA5gAAAAAAAAAGAB8A%2FAAAAAAAAAAIABwBGwABAAAAAAABAD4AAAABAAAAAAACAA4APgABAAAAAAADAFwATAABAAAAAAAEAD4AqAABAAAAAAAFABYA5gABAAAAAAAGAB8A%2FAABAAAAAAAIABwBGwADAAEECQABAD4AAAADAAEECQACAA4APgADAAEECQADAFwATAADAAEECQAEAD4AqAADAAEECQAFABYA5gADAAEECQAGAB8A%2FAADAAEECQAIABwBGwBSAG8AdQBuAGQAIABiAHIAYQBjAGsAZQB0AHMAIAB3AGkAdABoACAAYQBzAGMAZQBuAHQAIAAxADgANQA0AFIAZQBnAHUAbABhAHIATQBhAHQAaABzACAARgBvAHIAIABNAG8AcgBlACAAUgBvAHUAbgBkACAAYgByAGEAYwBrAGUAdABzACAAdwBpAHQAaAAgAGEAcwBjAGUAbgB0ACAAMQA4ADUANABSAG8AdQBuAGQAIABiAHIAYQBjAGsAZQB0AHMAIAB3AGkAdABoACAAYQBzAGMAZQBuAHQAIAAxADgANQA0AFYAZQByAHMAaQBvAG4AIAAyAC4AMFJvdW5kX2JyYWNrZXRzX3dpdGhfYXNjZW50XzE4NTQATQBhAHQAaABzACAARgBvAHIAIABNAG8AcgBlAAAAAAMAAAAAAAADnwHPAAAAAAAAAAAAAAAAAAAAAAAAAAC5B%2F8AAY2FAA%3D%3D)format('truetype')%3Bfont-weight%3Anormal%3Bfont-style%3Anormal%3B%7D%3C%2Fstyle%3E%3C%2Fdefs%3E%3Ctext%20font-family%3D%22Times%20New%20Roman%22%20font-size%3D%2218%22%20font-style%3D%22italic%22%20text-anchor%3D%22middle%22%20x%3D%223.5%22%20y%3D%2217%22%3Ef%3C%2Ftext%3E%3Ctext%20font-family%3D%22round_brackets18549f92a457f2409%22%20font-size%3D%2218%22%20text-anchor%3D%22middle%22%20x%3D%2212.5%22%20y%3D%2217%22%3E(%3C%2Ftext%3E%3Ctext%20font-family%3D%22round_brackets18549f92a457f2409%22%20font-size%3D%2218%22%20text-anchor%3D%22middle%22%20x%3D%2227.5%22%20y%3D%2217%22%3E)%3C%2Ftext%3E%3Ctext%20font-family%3D%22Times%20New%20Roman%22%20font-size%3D%2218%22%20font-style%3D%22italic%22%20text-anchor%3D%22middle%22%20x%3D%2219.5%22%20y%3D%2217%22%3Ex%3C%2Ftext%3E%3Ctext%20font-family%3D%22math143f4d31b04031e49f5eb18baba%22%20font-size%3D%2216%22%20text-anchor%3D%22middle%22%20x%3D%2239.5%22%20y%3D%2217%22%3E%3D%3C%2Ftext%3E%3Ctext%20font-family%3D%22Times%20New%20Roman%22%20font-size%3D%2218%22%20font-style%3D%22italic%22%20text-anchor%3D%22middle%22%20x%3D%2252.5%22%20y%3D%2217%22%3Ex%3C%2Ftext%3E%3Ctext%20font-family%3D%22Times%20New%20Roman%22%20font-size%3D%2213%22%20text-anchor%3D%22middle%22%20x%3D%2261.5%22%20y%3D%2212%22%3E2%3C%2Ftext%3E%3Ctext%20font-family%3D%22math143f4d31b04031e49f5eb18baba%22%20font-size%3D%2216%22%20text-anchor%3D%22middle%22%20x%3D%2273.5%22%20y%3D%2217%22%3E%26%23x2212%3B%3C%2Ftext%3E%3Ctext%20font-family%3D%22Times%20New%20Roman%22%20font-size%3D%2218%22%20text-anchor%3D%22middle%22%20x%3D%2286.5%22%20y%3D%2217%22%3E2%3C%2Ftext%3E%3Ctext%20font-family%3D%22Times%20New%20Roman%22%20font-size%3D%2218%22%20font-style%3D%22italic%22%20text-anchor%3D%22middle%22%20x%3D%2295.5%22%20y%3D%2217%22%3Ex%3C%2Ftext%3E%3Ctext%20font-family%3D%22math143f4d31b04031e49f5eb18baba%22%20font-size%3D%2216%22%20text-anchor%3D%22middle%22%20x%3D%22109.5%22%20y%3D%2217%22%3E%26%23x2212%3B%3C%2Ftext%3E%3Ctext%20font-family%3D%22Times%20New%20Roman%22%20font-size%3D%2218%22%20text-anchor%3D%22middle%22%20x%3D%22122.5%22%20y%3D%2217%22%3E8%3C%2Ftext%3E%3C%2Fsvg%3E)
The zeros of
 are
are format('truetype')%3Bfont-weight%3Anormal%3Bfont-style%3Anormal%3B%7D%3C%2Fstyle%3E%3C%2Fdefs%3E%3Ctext%20font-family%3D%22Times%20New%20Roman%22%20font-size%3D%2218%22%20font-style%3D%22italic%22%20text-anchor%3D%22middle%22%20x%3D%224.5%22%20y%3D%2216%22%3Ex%3C%2Ftext%3E%3Ctext%20font-family%3D%22math143f4d31b04031e49f5eb18baba%22%20font-size%3D%2216%22%20text-anchor%3D%22middle%22%20x%3D%2218.5%22%20y%3D%2216%22%3E%3D%3C%2Ftext%3E%3Ctext%20font-family%3D%22math143f4d31b04031e49f5eb18baba%22%20font-size%3D%2216%22%20text-anchor%3D%22middle%22%20x%3D%2235.5%22%20y%3D%2216%22%3E%26%23x2212%3B%3C%2Ftext%3E%3Ctext%20font-family%3D%22Times%20New%20Roman%22%20font-size%3D%2218%22%20text-anchor%3D%22middle%22%20x%3D%2248.5%22%20y%3D%2216%22%3E2%3C%2Ftext%3E%3C%2Fsvg%3E) and
and format('truetype')%3Bfont-weight%3Anormal%3Bfont-style%3Anormal%3B%7D%3C%2Fstyle%3E%3C%2Fdefs%3E%3Ctext%20font-family%3D%22Times%20New%20Roman%22%20font-size%3D%2218%22%20font-style%3D%22italic%22%20text-anchor%3D%22middle%22%20x%3D%224.5%22%20y%3D%2216%22%3Ex%3C%2Ftext%3E%3Ctext%20font-family%3D%22math17f39f8317fbdb1988ef4c628eb%22%20font-size%3D%2216%22%20text-anchor%3D%22middle%22%20x%3D%2218.5%22%20y%3D%2216%22%3E%3D%3C%2Ftext%3E%3Ctext%20font-family%3D%22Times%20New%20Roman%22%20font-size%3D%2218%22%20text-anchor%3D%22middle%22%20x%3D%2231.5%22%20y%3D%2216%22%3E4%3C%2Ftext%3E%3C%2Fsvg%3E)
Worked Example
A pump is used to fill a water tank, which is initially empty. When the pump is running, the rate at which the volume of water in the tank increases is constant. During the first three hours the pump is running on its highest setting. After a noise complaint from a neighbour, the pump is temporarily switched off. The pump is eventually switched back on, using a lower setting that pumps the water more slowly. The pump is run on this setting until the tank is full. The entire process of filling the tank takes eight hours. Which of the following graphs could depict this situation, where time, in hours, is the independent variable, and the volume of water in the tank, in gallons, is the dependent variable.
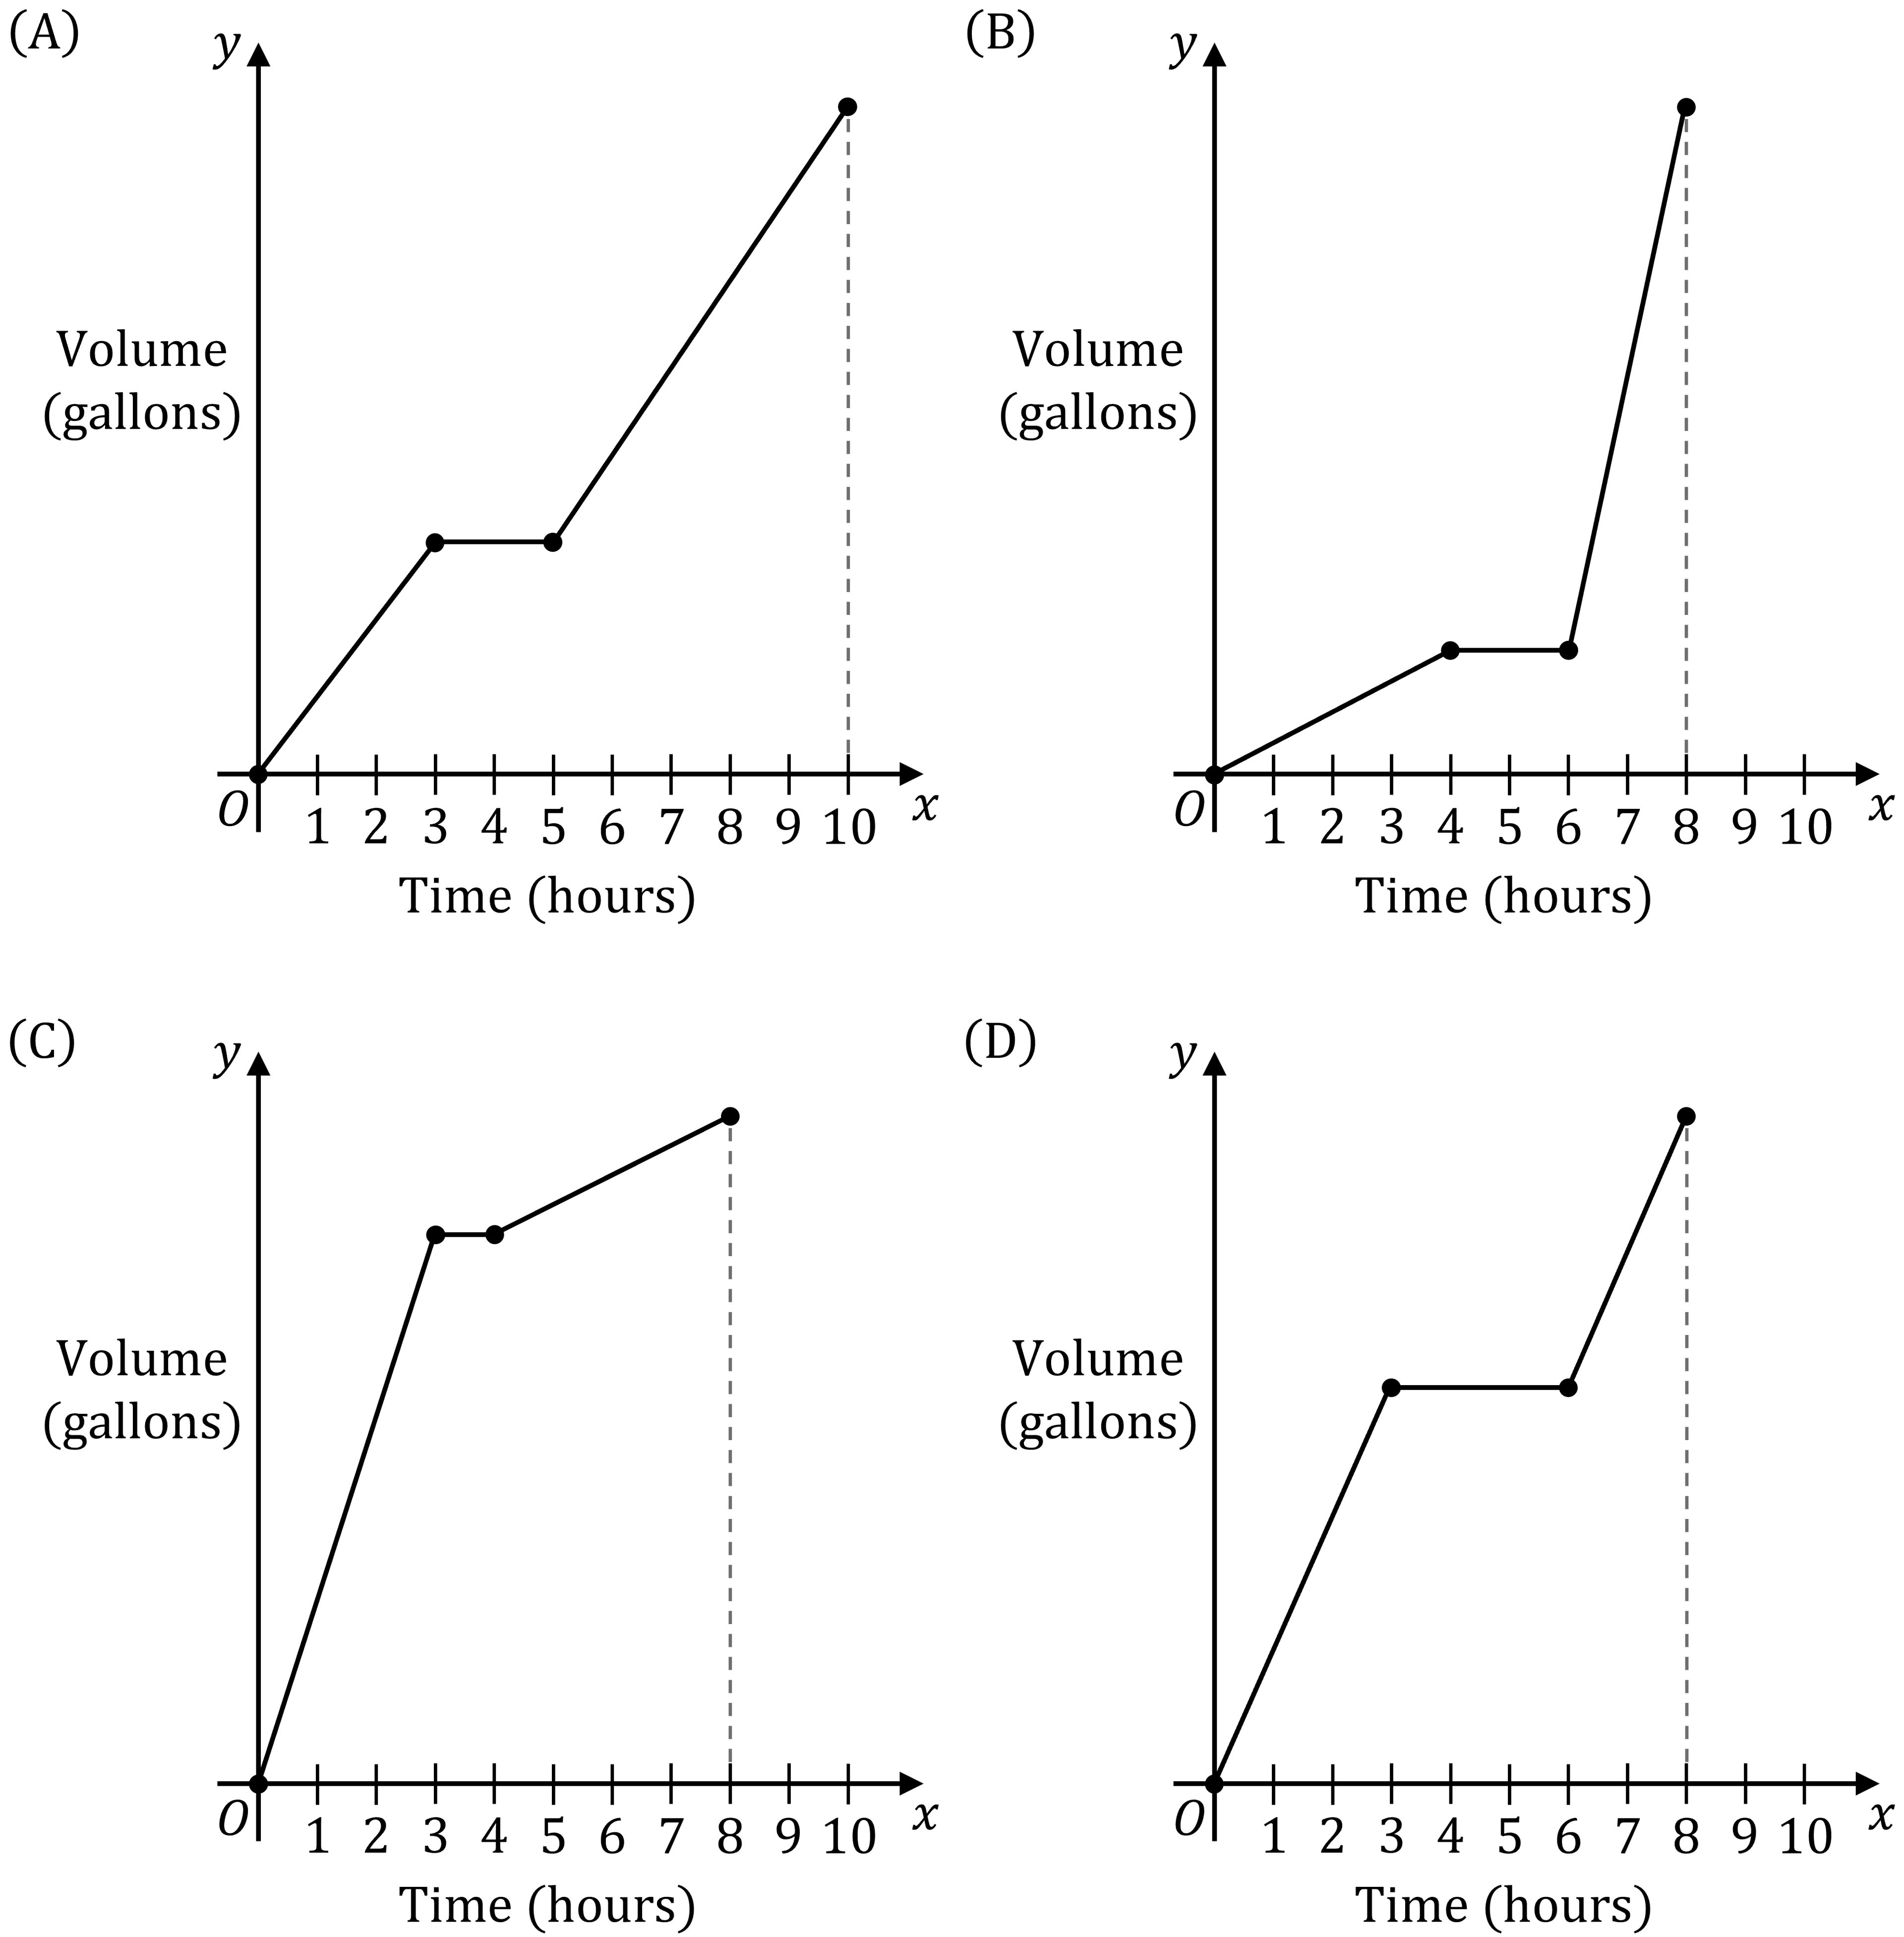
Answer:
Consider the information in the question
"The entire process of filling the tank takes eight hours" rules out graph (A)
because the process in that graph takes 10 hours
"The pump is temporarily switched off" and "The pump is eventually switched back on" mean that there should be a horizontal section of the graph where the volume isn't changing
The question doesn't say how long the pump was off, though, so that can't help you to choose among the remaining graphs
"During the first three hours the pump is running on its highest setting"
This means the initial segment of the graph should go from 0 to 3 on the horizontal axis
This rules out graph (B), because the initial segment there lasts for 4 hours
"During the first three hours the pump is running on its highest setting" and "The pump is eventually switched back on, using a lower setting that pumps the water more slowly" together give you the final necessary clue
The pump is pumping water more quickly at the start, and more slowly at the end
This means the graph should go up more steeply at the start, and less steeply at the end
This rules out graph (D), and would also rule out graphs (A) and (B)
After considering all the information, only one graph is left which matches all the conditions in the description
Graph (C)

Unlock more, it's free!
Join the 100,000+ Students that ❤️ Save My Exams
the (exam) results speak for themselves:

Was this revision note helpful?
Build on this topic
