Modeling with Exponential & Logarithmic Functions (College Board AP® Precalculus): Exam Questions

56 mins34 questions
1
Sme Calculator
1 mark

The number of bacteria in a Petri dish, in thousands, is modeled by the function space f given by space f open parentheses t close parentheses equals 4 times 3 to the power of t, where t is the time, in hours, since the start of an experiment. According to the model, what is the number of bacteria, in thousands, after 2 hours?

  • 24

  • 32

  • 36

  • 144

2
Sme Calculator
1 mark

The variables x and space y are related by the exponential equation space y equals 5 times 4 to the power of x. Which of the following equations expresses log y as a linear function of x?

  • log y equals x log 20

  • log y equals log 5 plus x log 4

  • log y equals log 4 plus x log 5

  • log y equals open parentheses log 5 close parentheses open parentheses x log 4 close parentheses

3
Sme Calculator
1 mark

A model M is constructed to predict the population of a town, in thousands. The model gives M open parentheses 5 close parentheses equals 12.4 for year t equals 5. The actual population in year 5 was 13.7 thousand. What is the residual, in thousands, at t equals 5?

  • - 1 . 3

  • 1 . 3

  • 12 . 4

  • 13 . 7

4
Sme Calculator
1 mark

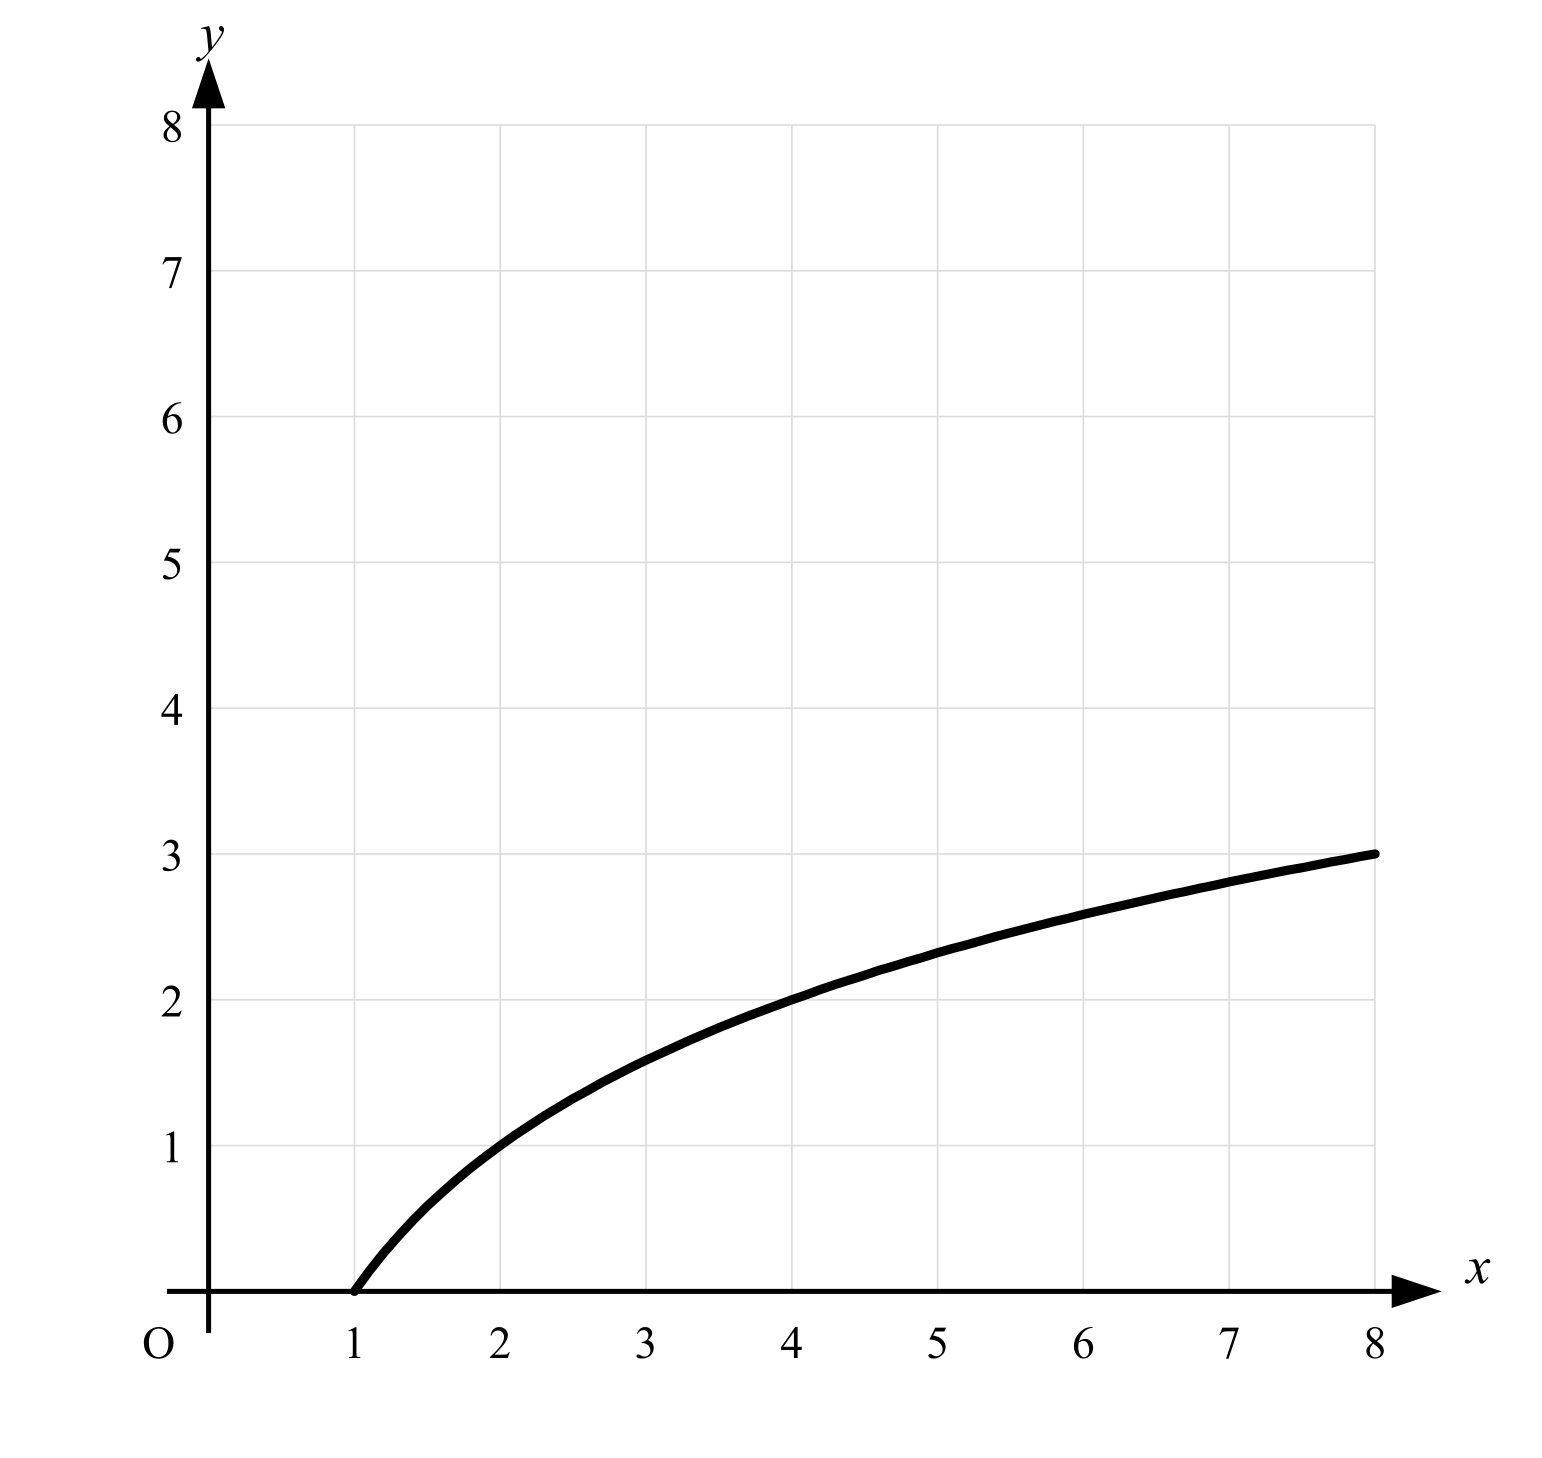
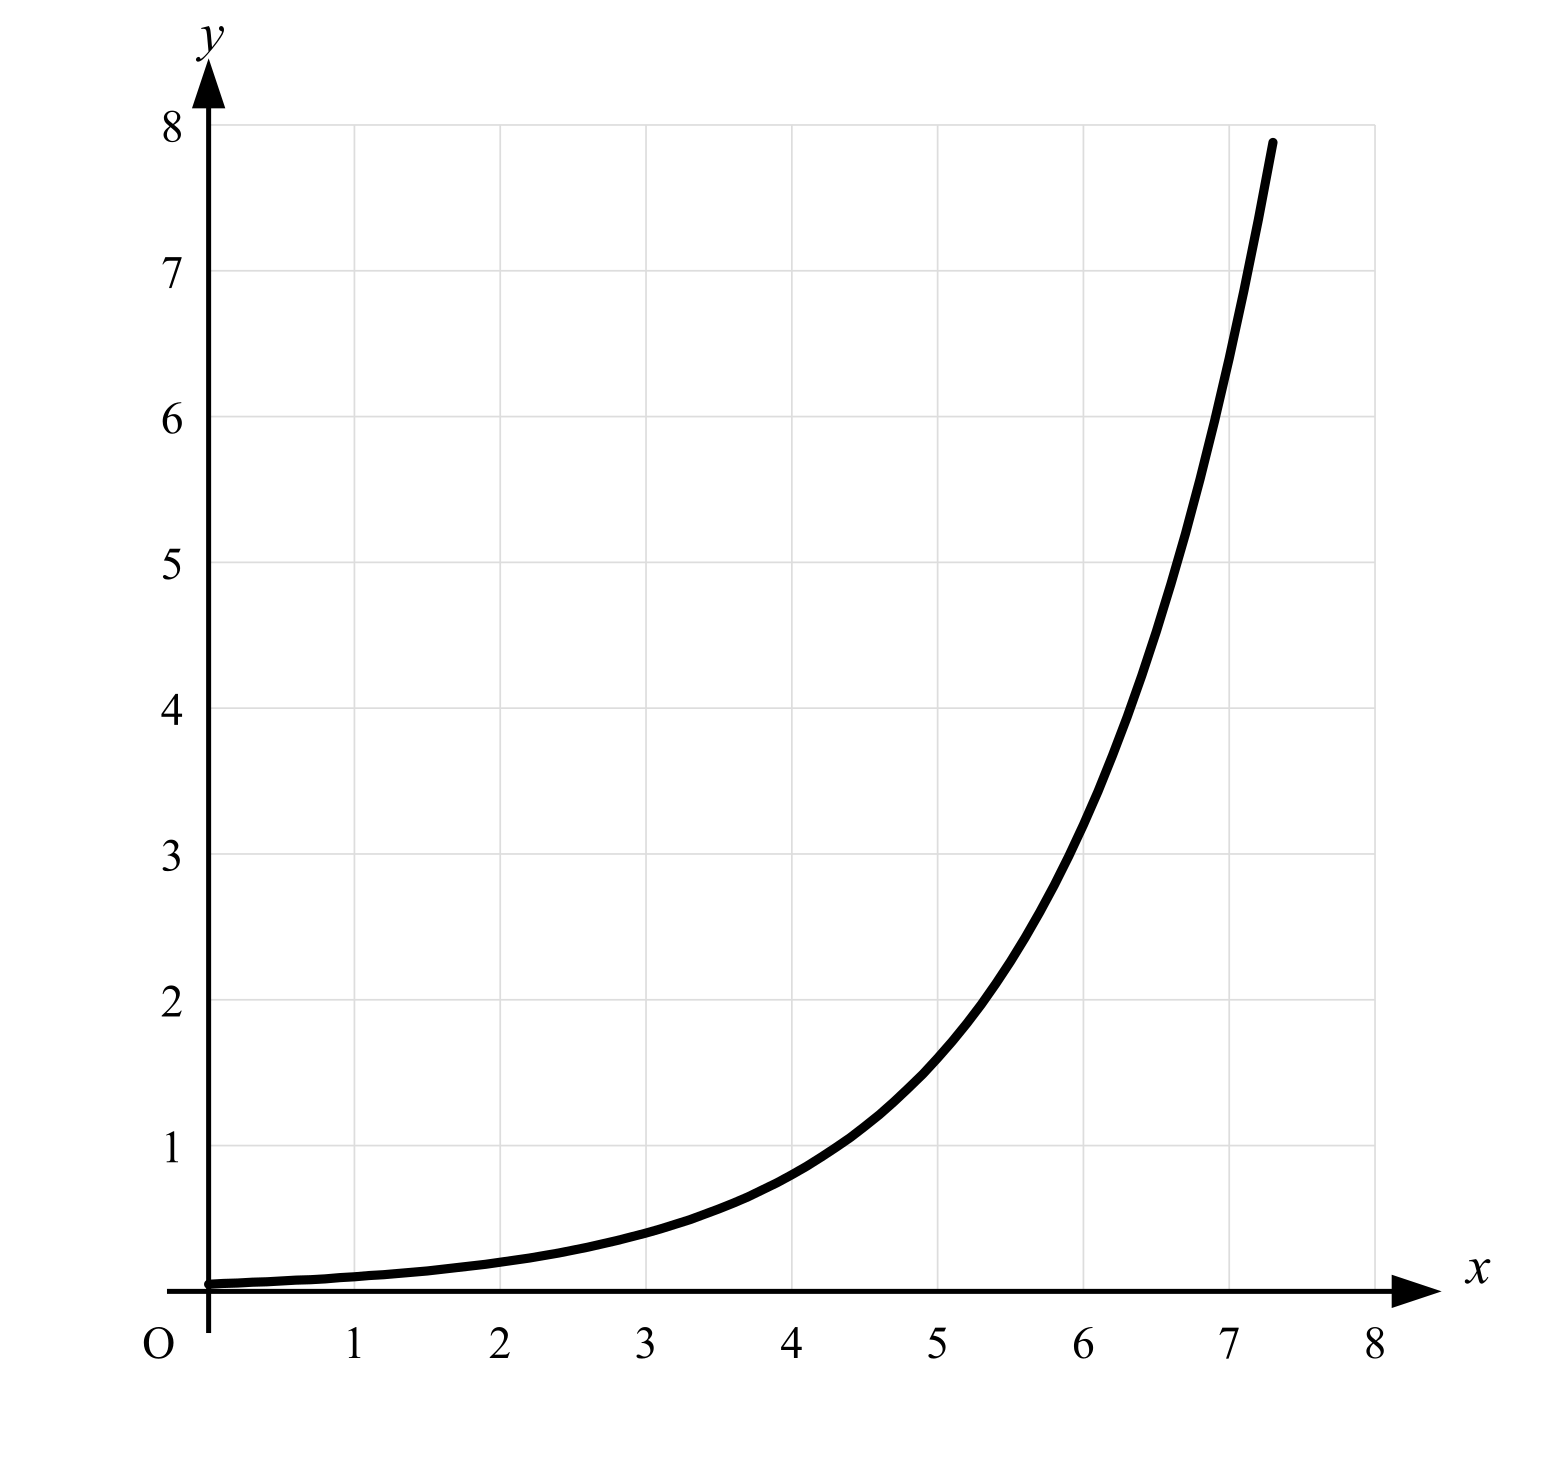
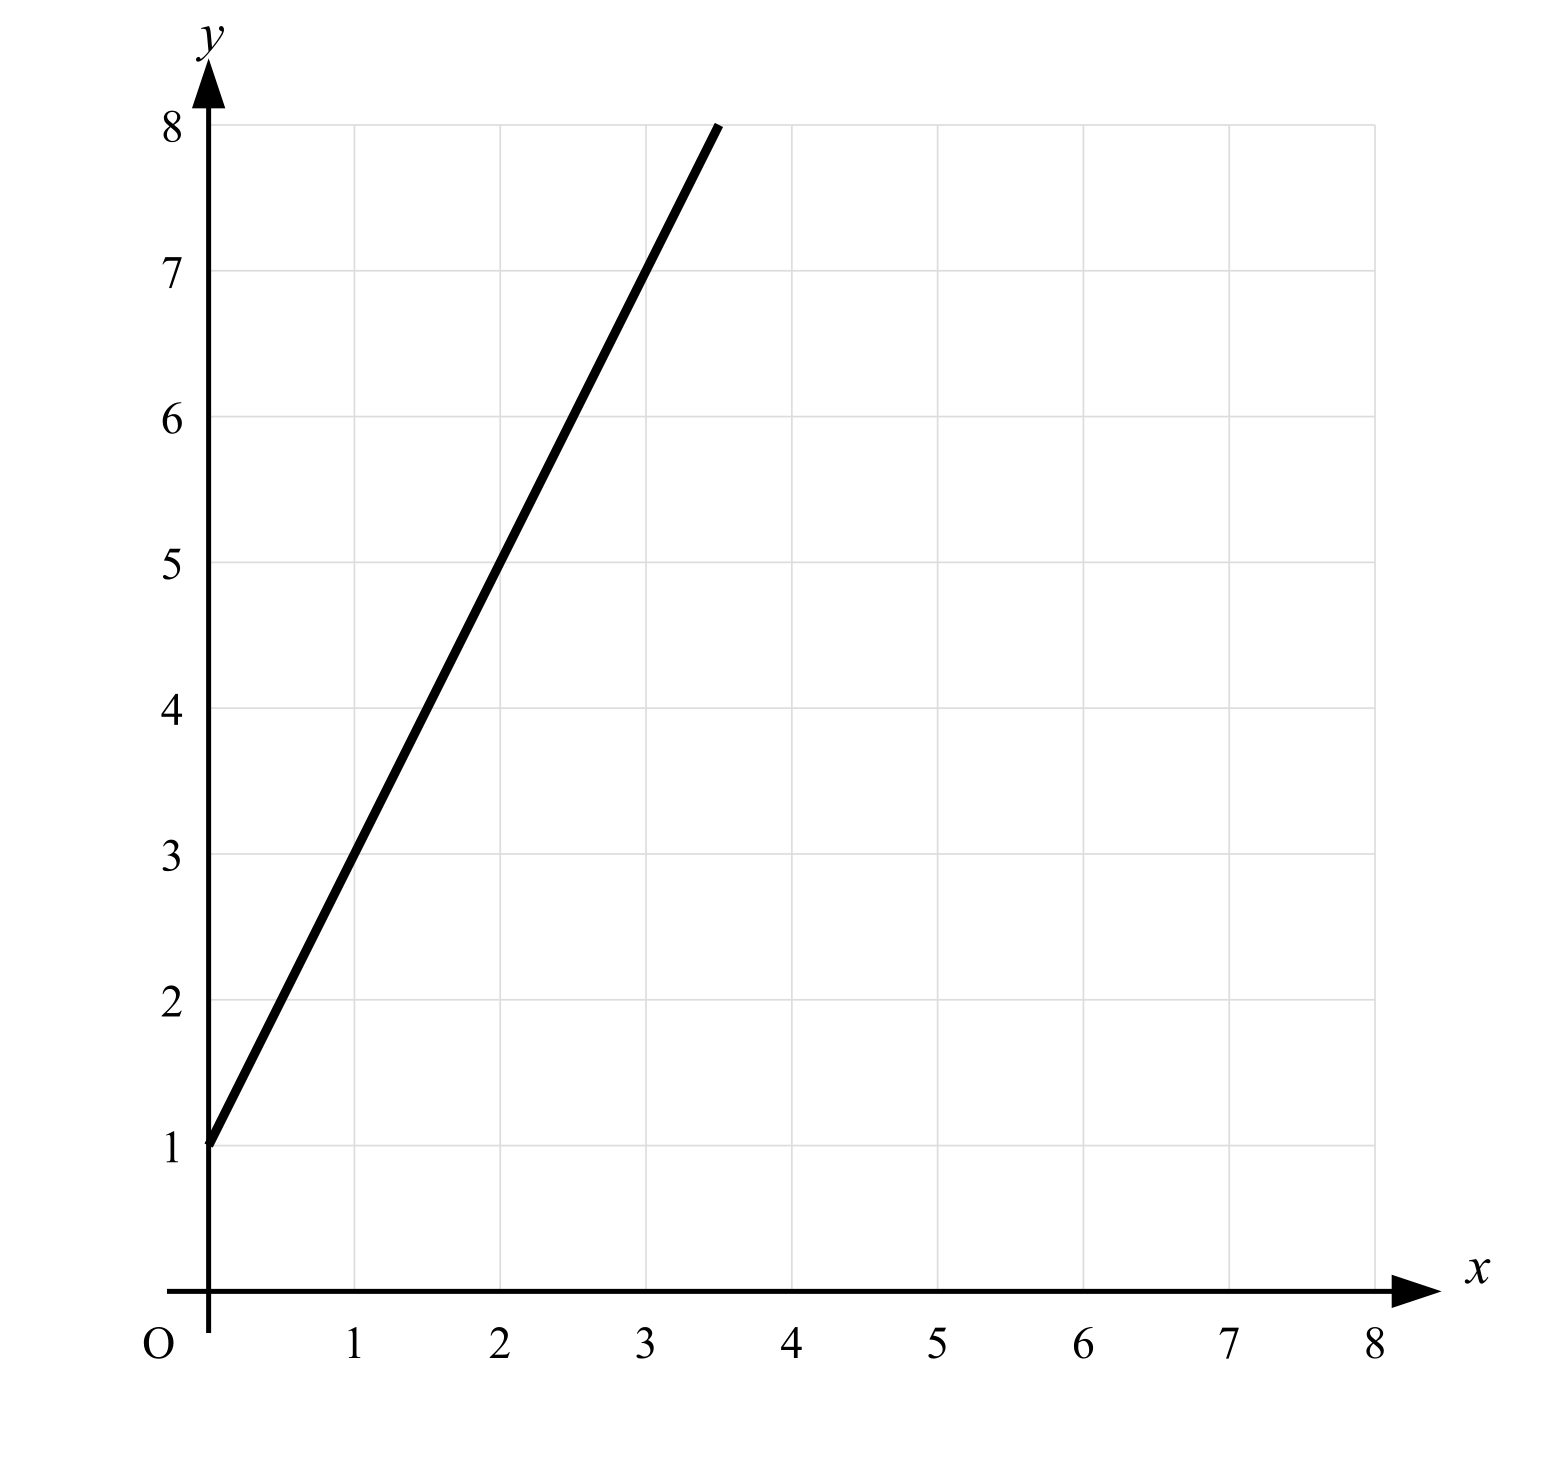
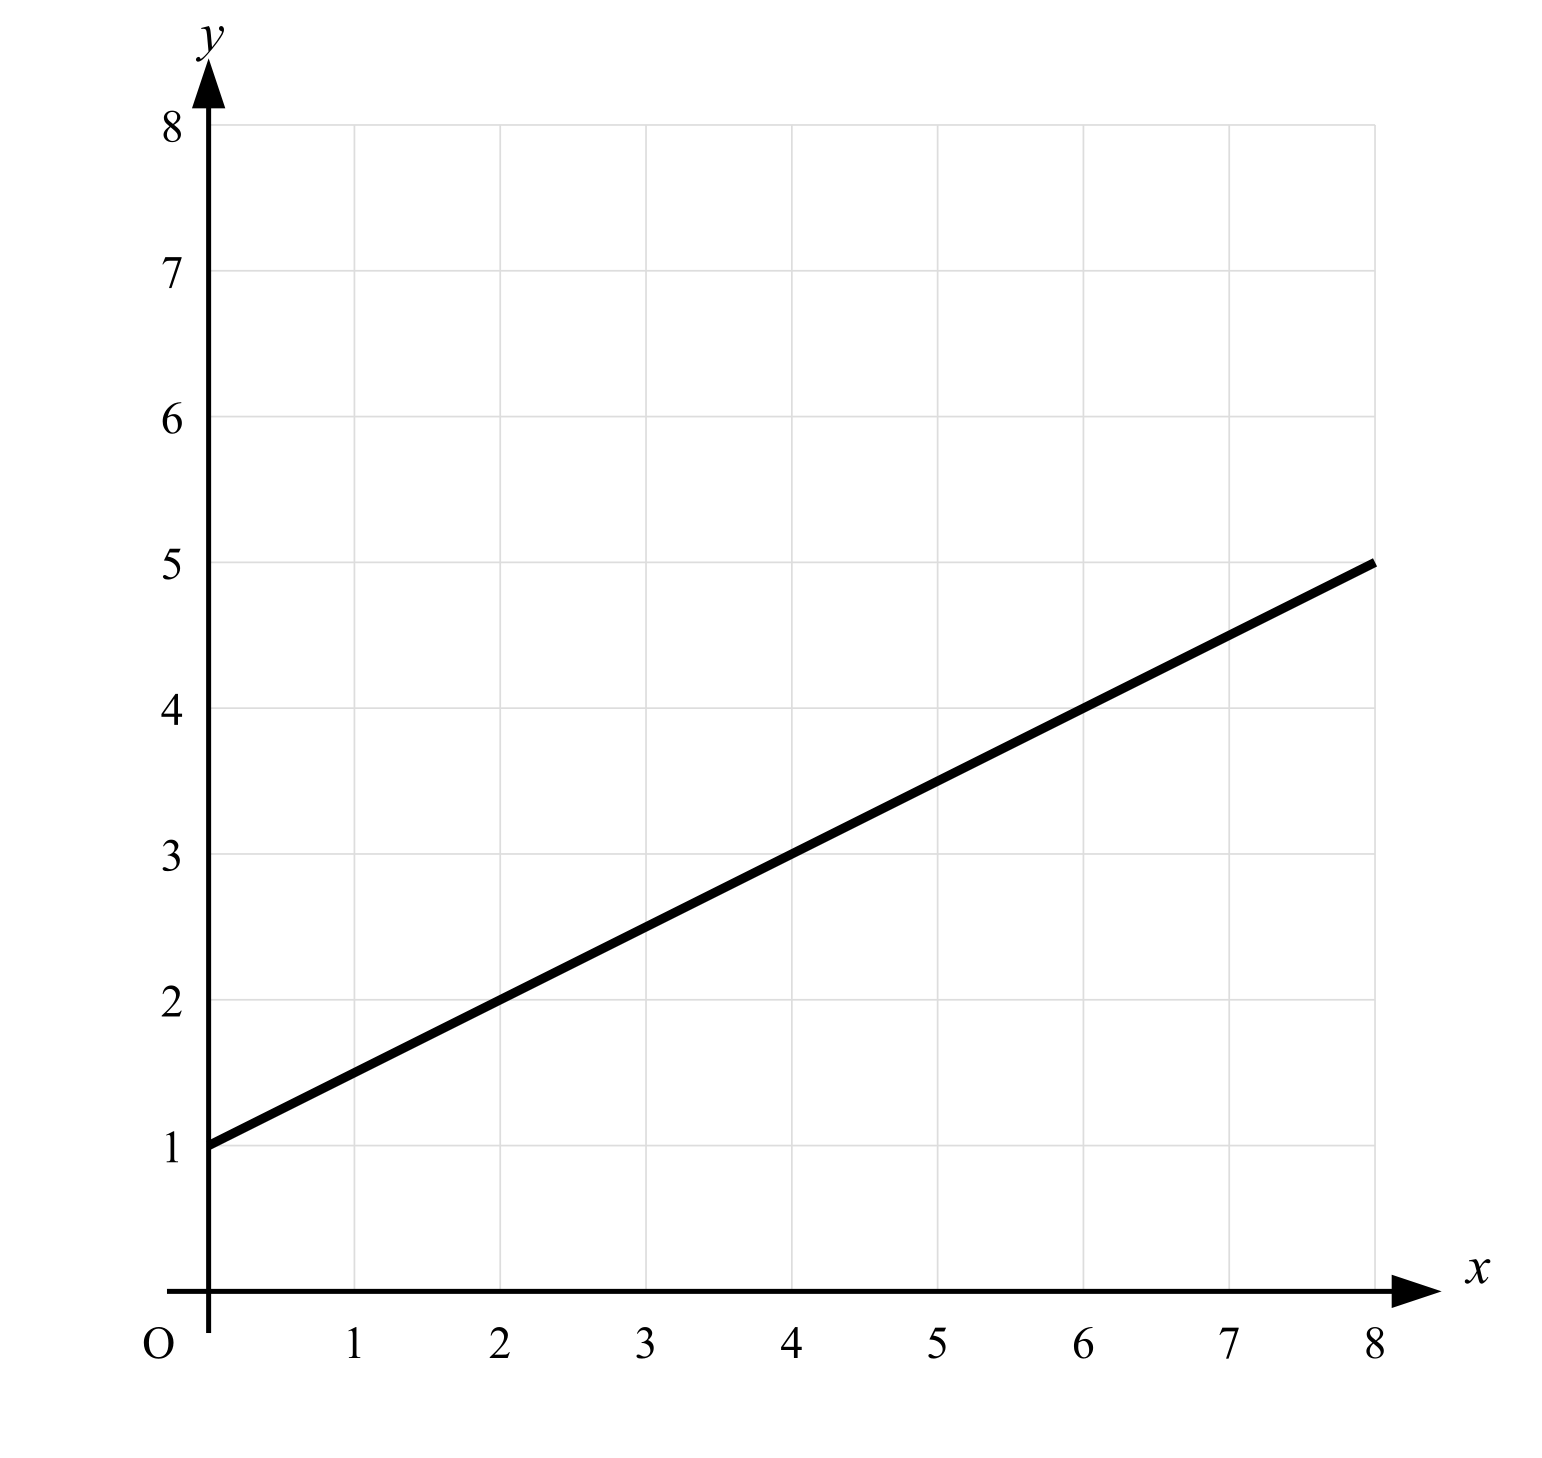
The function g has the property that for each time the output values double, the input values increase by 1. Which of the following could be the graph of y = g \left(x\right) in the x y-plane?

  • Graph with x-axis from 0 to 8 and y-axis from 0 to 8. A curve starts at (1, 0) that is rising and flattening
  • Graph showing an exponential curve increasing steeply, with x-axis from 0 to 8 and y-axis from 0 to 8, labelled x and y respectively.
  • Line graph on a grid, x-axis from 0 to 8, y-axis from 0 to 8. Straight line through (0, 1) and (3,7).
  • A straight line through (0, 1) and (8, 5).
5
Sme Calculator
1 mark

The increasing function N gives the number of subscribers, in thousands, for a new streaming channel. The table gives values of N \left(t\right) for selected values of t, in months, since the channel launched.

t (months)

0

1

2

3

4

N \left(t\right) (thousands)

10

20

40

80

160

If a model is constructed to represent these data, which of the following best applies to this situation?

  • y = 10 t + 10

  • y = \frac{75}{4} t + 10

  • y = 10 \cdot \left(\frac{1}{2}\right)^{t}

  • y = 10 \cdot 2^{t}

6
Sme Calculator
1 mark

The table gives values for a function p at selected values of x.

x

1

2

3

4

5

p \left(x\right)

15

38

97

245

618

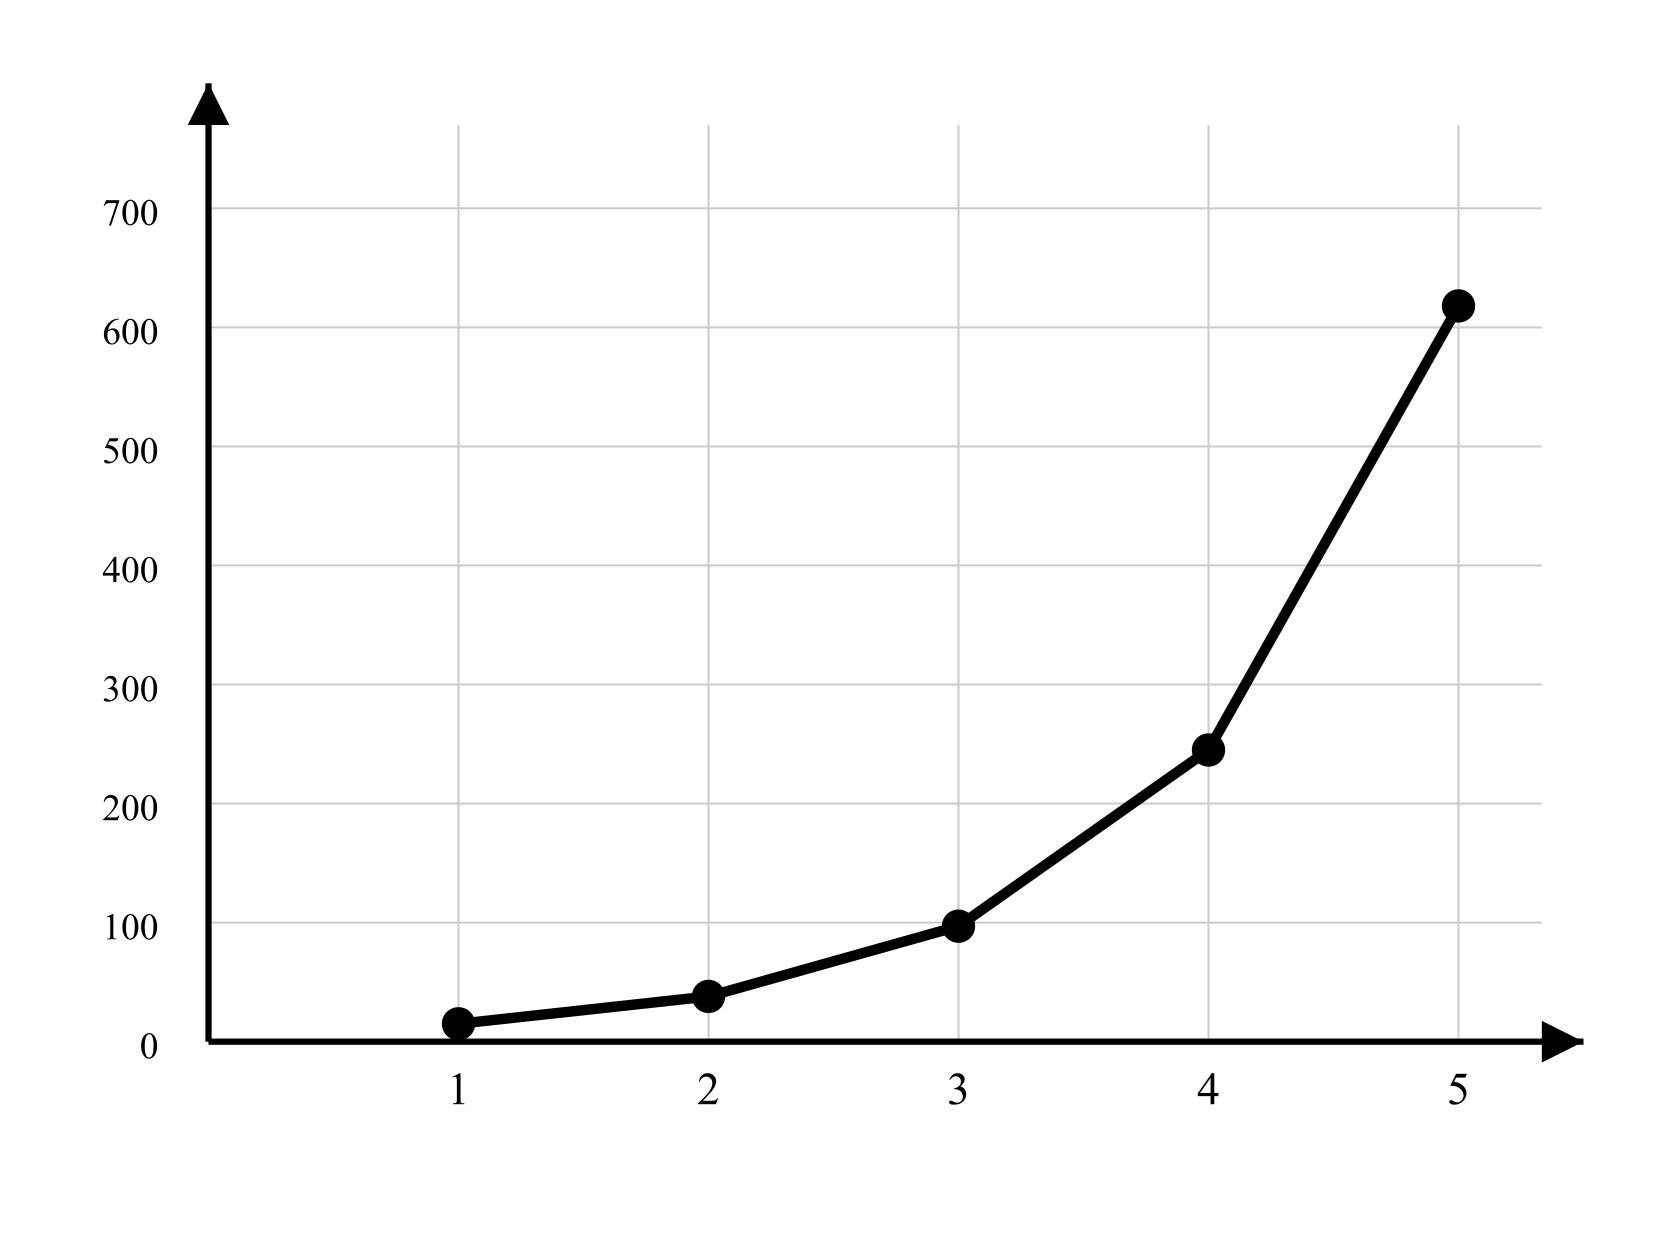
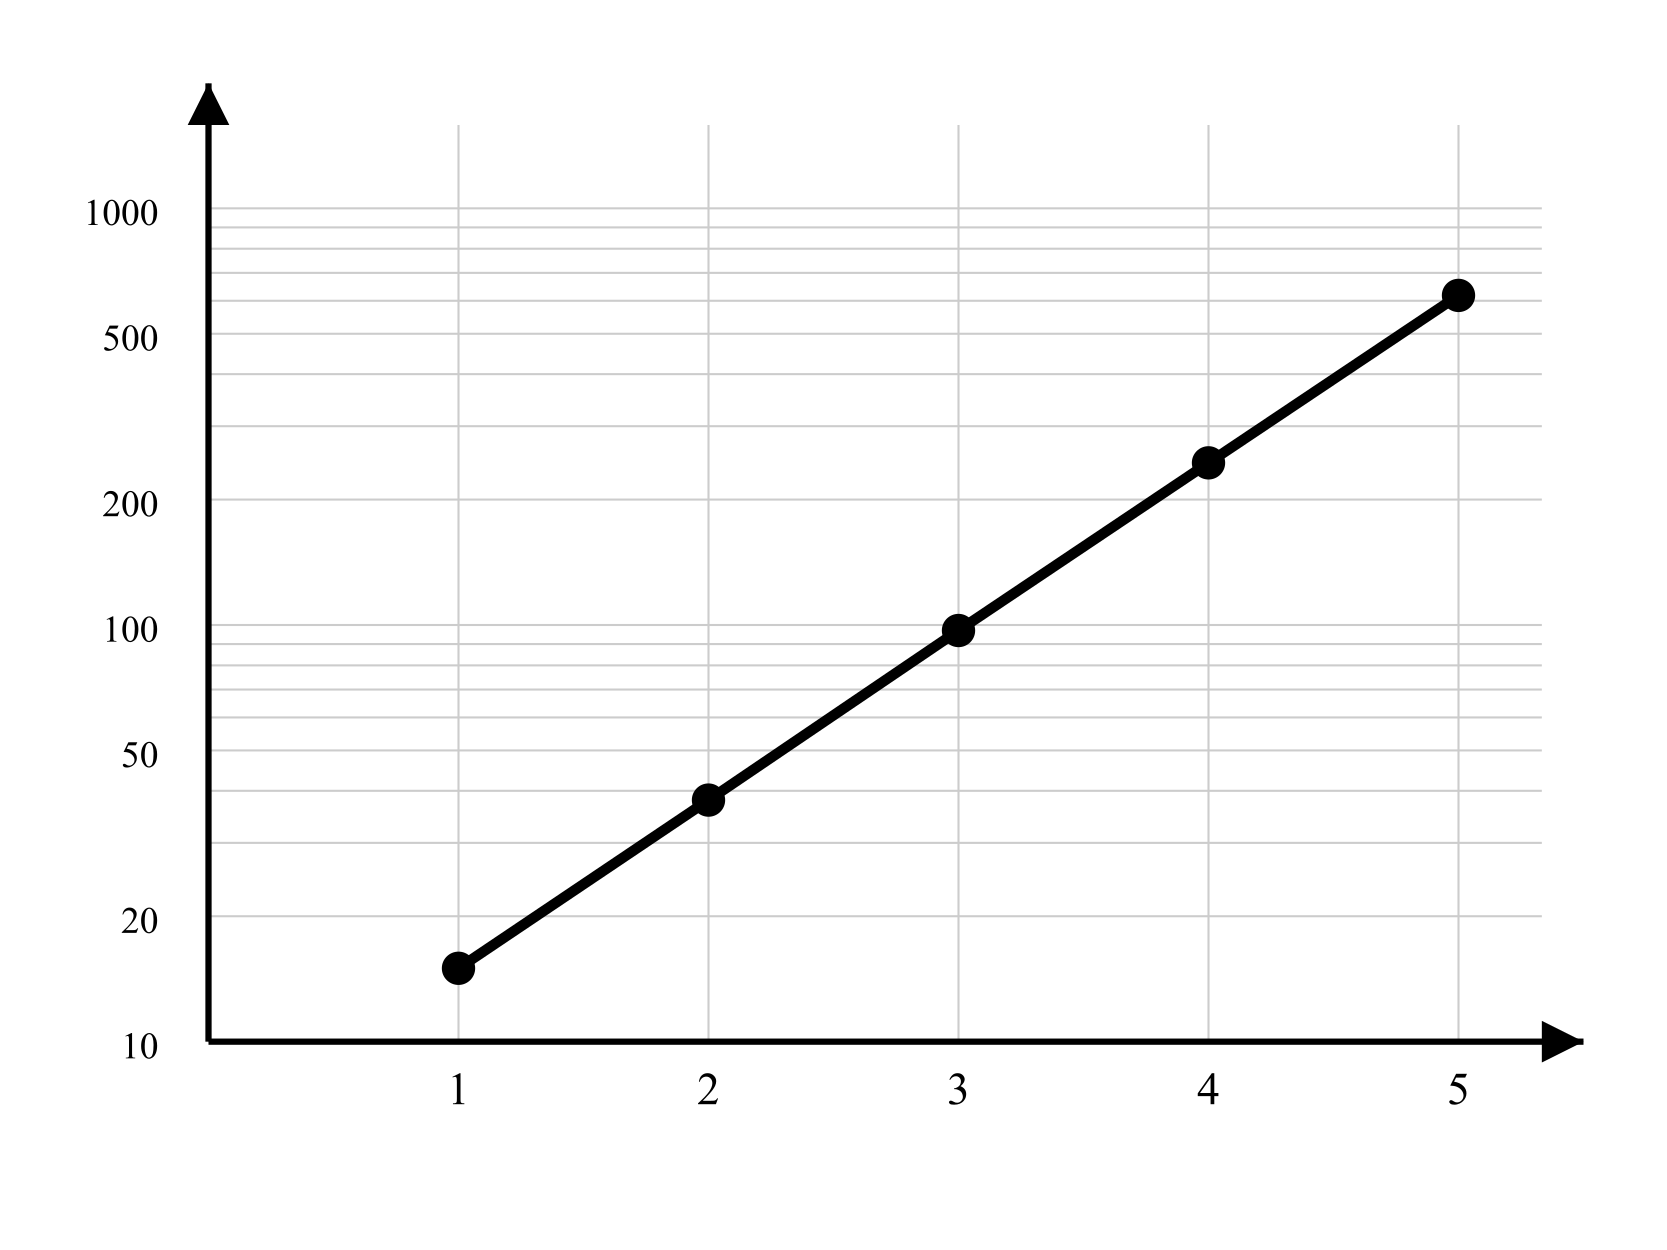
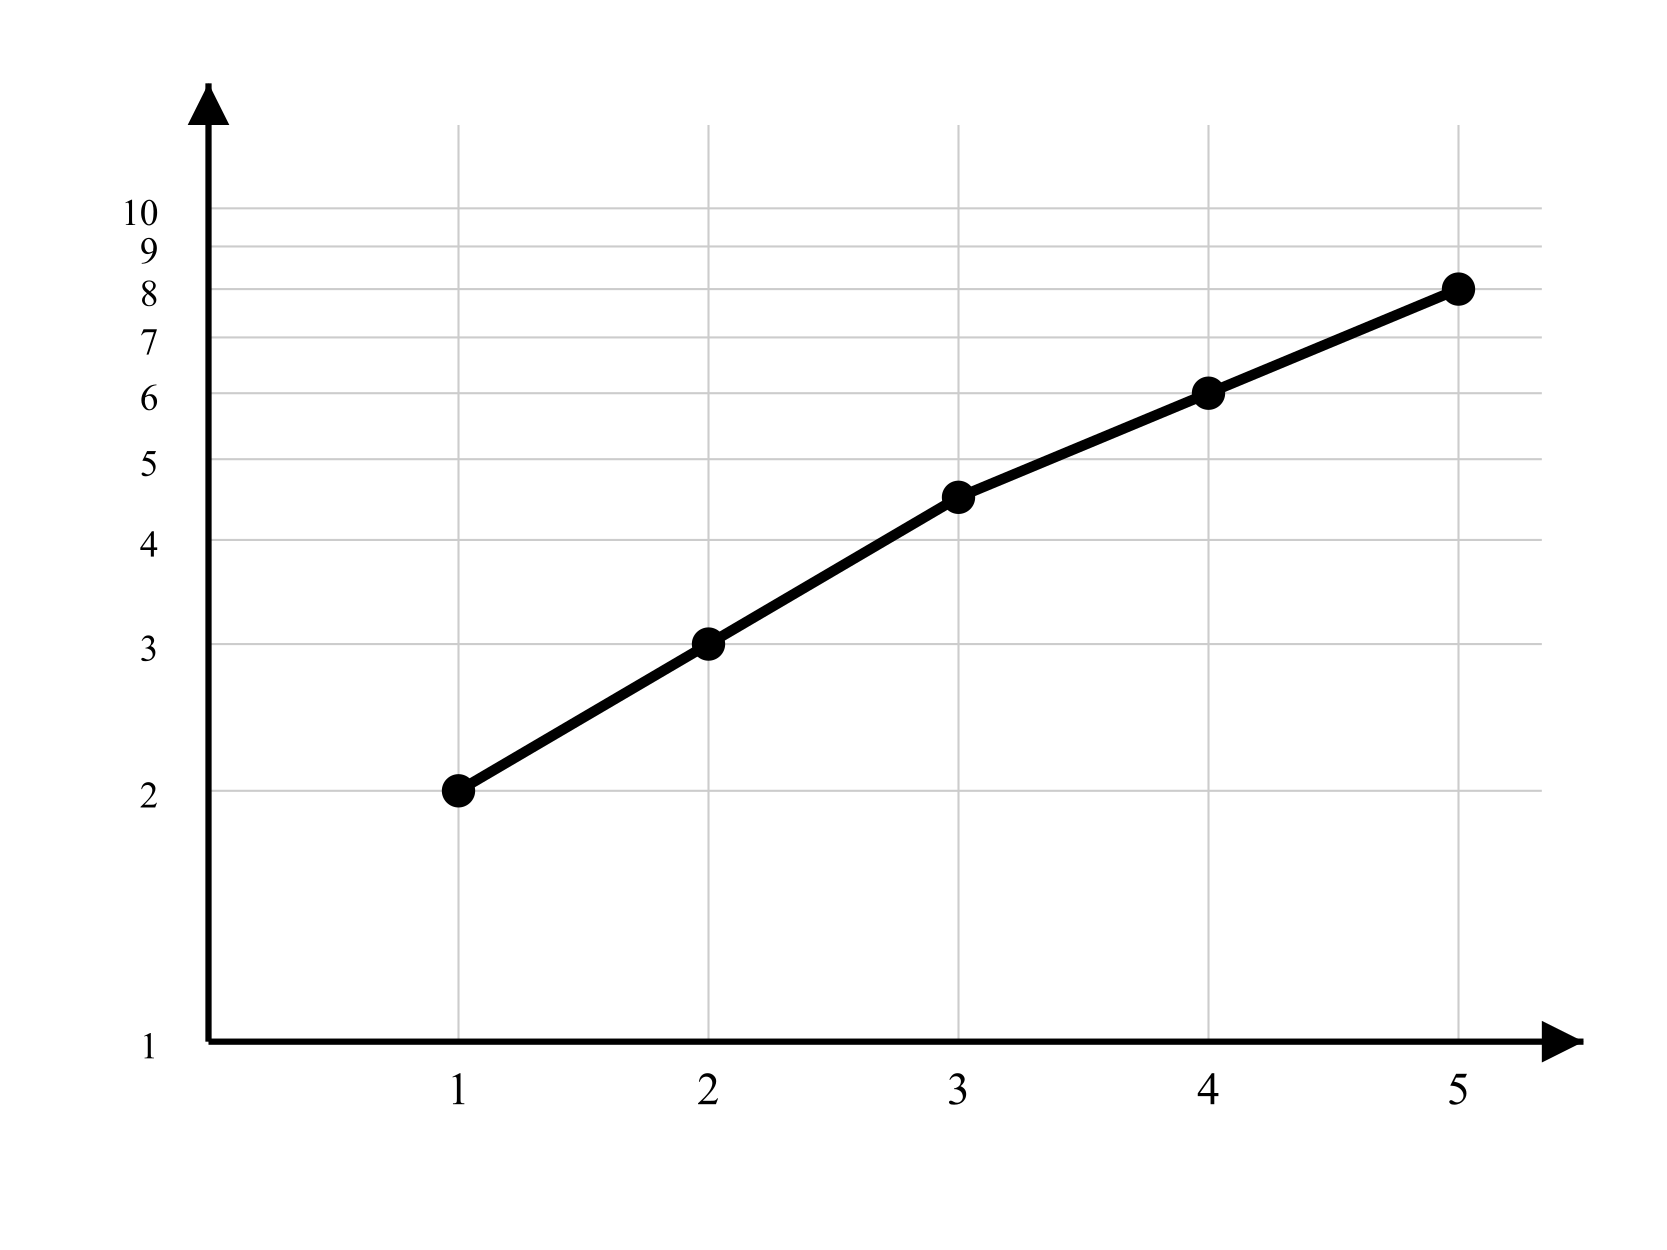
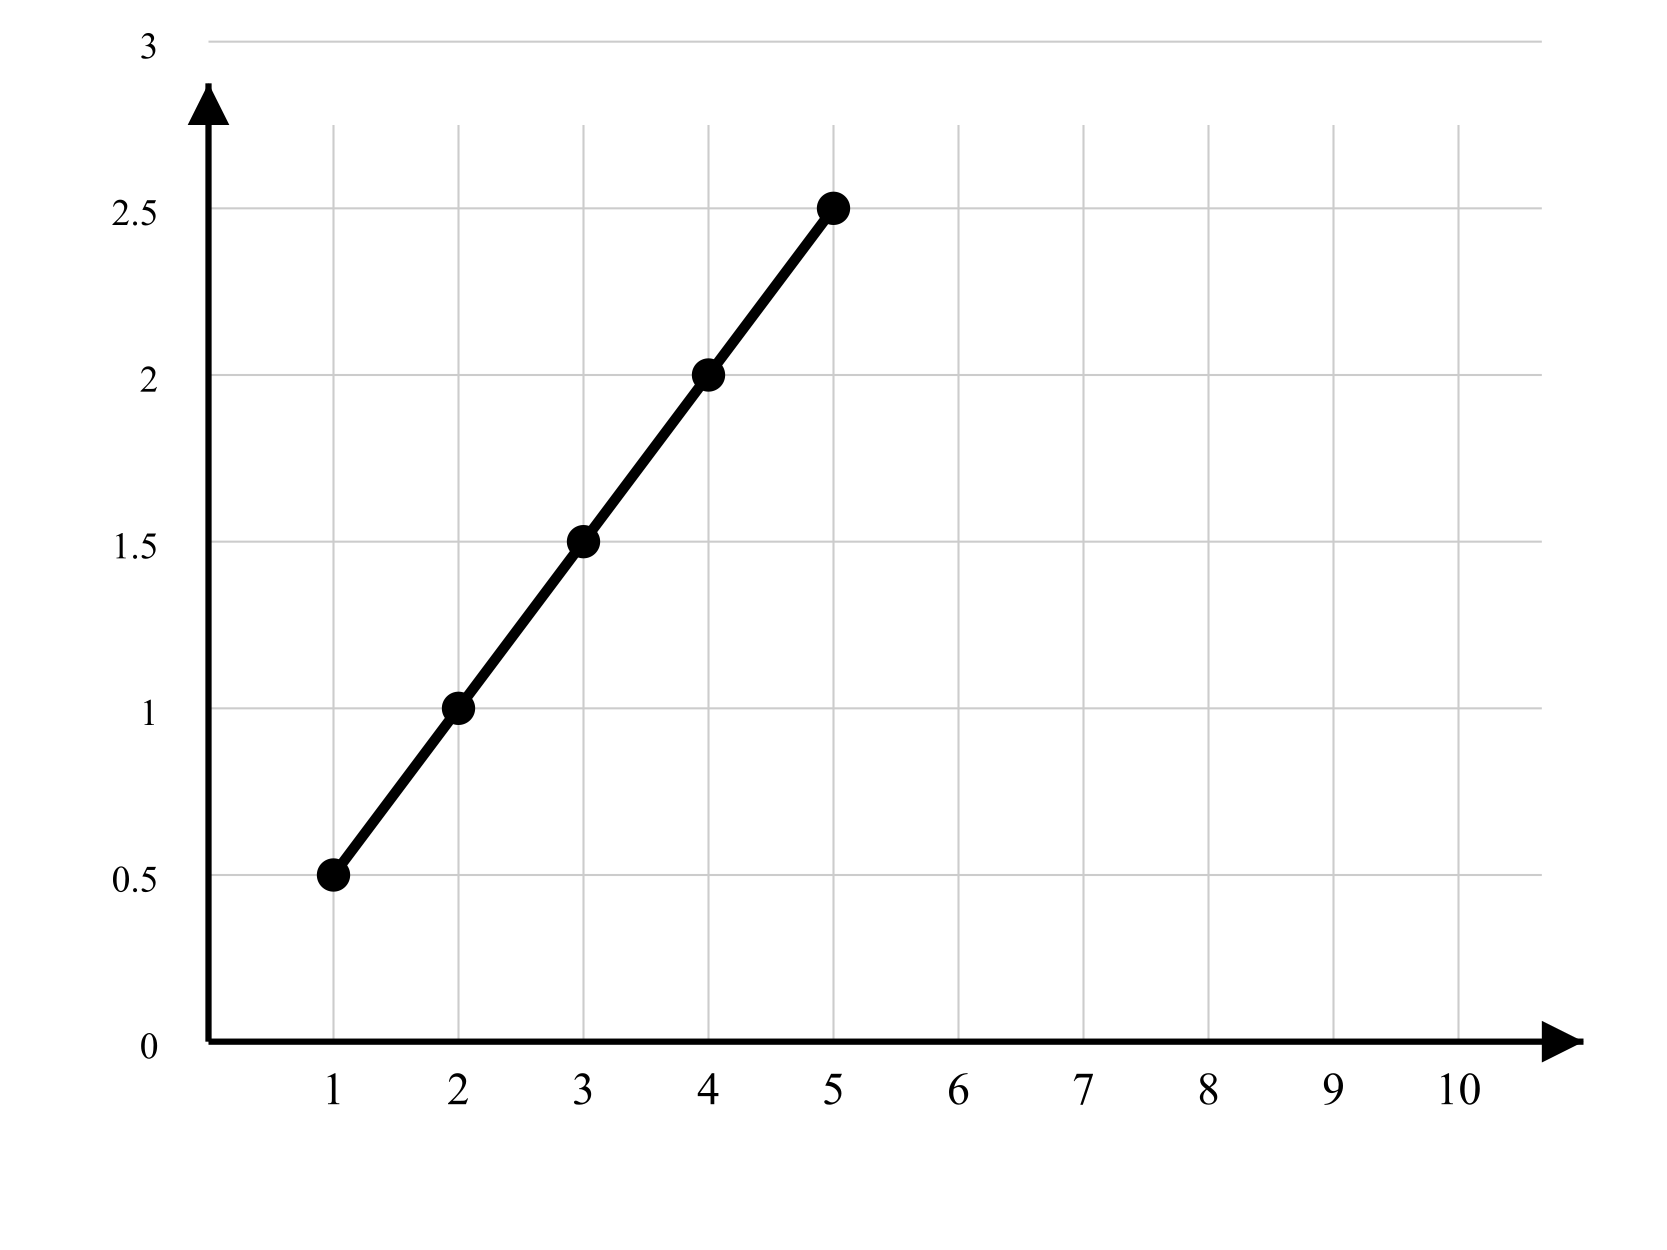
Which of the following graphs could represent these data in a semi-log plot, where the vertical axis is logarithmically scaled?

  • Graph with a linear vertical axis scaled from 0 to 700 and horizontal axis from 1 to 6. Five plotted points at approximately (1, 15), (2, 38), (3, 97), (4, 245), and (5, 618) are connected by line segments. The points curve steeply upward, showing a concave-up shape.
  • Graph with a logarithmic vertical axis scaled from 10 to 1000 and horizontal axis from 1 to 6. Five plotted points at approximately (1, 15), (2, 38), (3, 97), (4, 245), and (5, 618) are connected by line segments. The points appear approximately collinear on this scale.
  • Graph with a logarithmic vertical axis scaled from 1 to 10 and horizontal axis from 1 to 6. Five plotted points connected by line segments appear roughly collinear.
  • Graph with a linear vertical axis scaled from 0 to 3 and horizontal axis from 1 to 10. Five plotted points at approximately (1, 0.5), (2, 1.0), (3, 1.5), (4, 2.0), and (5, 2.5) are connected by line segments, forming a straight line. The scale and values do not match the given data.
7
Sme Calculator
1 mark

Two function models f and g are constructed to represent the temperature of a liquid being heated. Both f \left(t\right) and g \left(t\right) represent the temperature, in degrees Celsius, after t minutes for t \geq 1. If f open parentheses t close parentheses equals 80 plus 12 ln t and g open parentheses t close parentheses equals 3 t plus 77, what is the first time t that the temperature predicted by the logarithmic model will be 0.5 degrees more than the temperature predicted by the linear model?

  • t = 0.750

  • t equals 1.058

  • t equals 10.073

  • t equals 12.210

8
Sme Calculator
1 mark

A biologist records the number of bacteria, in thousands, in a culture sample at the end of each day. The data are shown in the table.

Day, d

Bacteria count (thousands)

0

15

1

28

2

52

3

97

4

183

The biologist uses exponential regression to fit a model of the form B left parenthesis d right parenthesis equals a b to the power of d to the data. What is the value predicted by the model for the bacteria count, in thousands, when d = 2.5?

  • 69.888

  • 71.337

  • 95.250

  • 97.483

9
Sme Calculator
1 mark

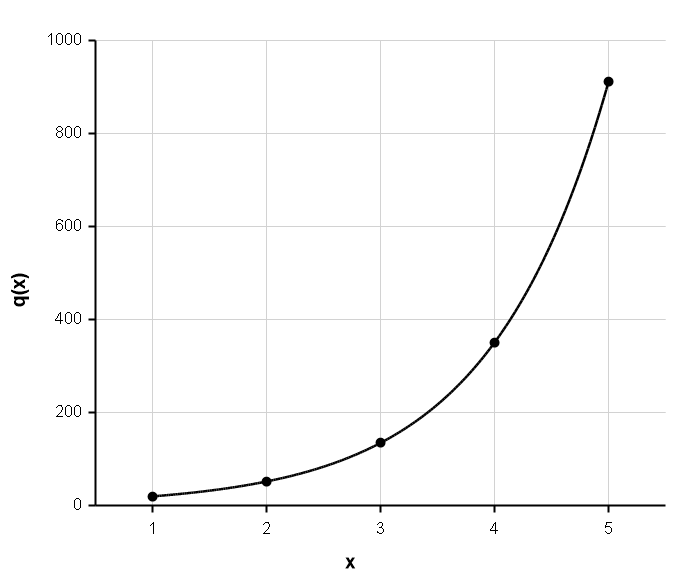
The table gives values for a function q at selected values of x.

x

1

2

3

4

5

q \left(x\right)

20

52

135

351

912

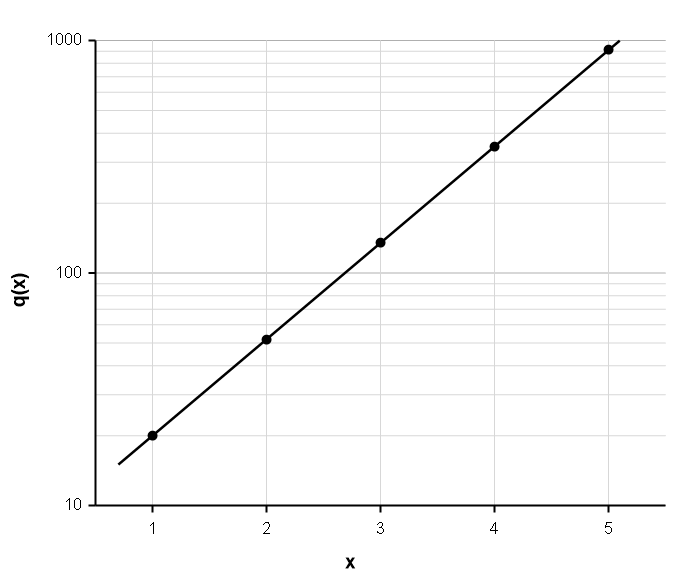
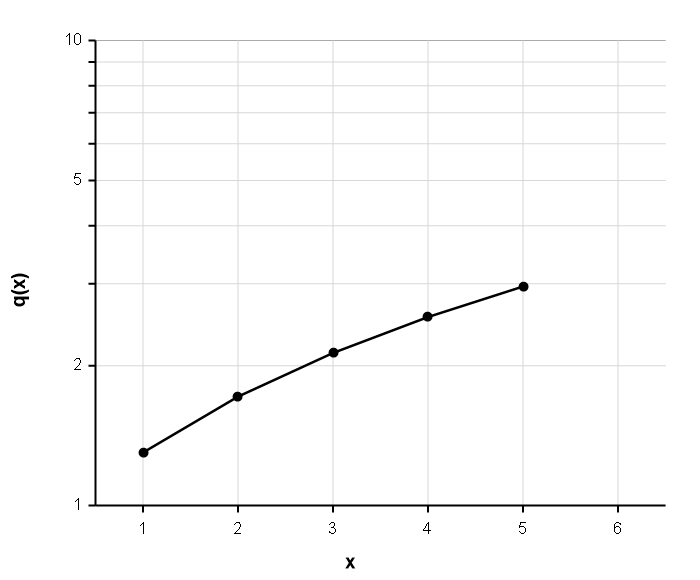
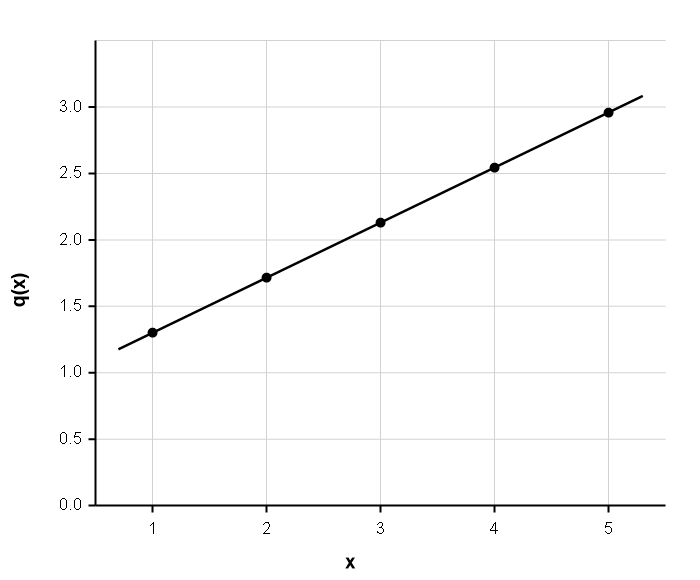
Which of the following graphs could represent these data in a semi-log plot, where the vertical axis is logarithmically scaled?

  • Graph with a linear vertical axis scaled from 0 to 1000 and horizontal axis from 1 to 6. Five plotted points at approximately (1, 20), (2, 52), (3, 135), (4, 351), and (5, 912) are connected by line segments. The points curve steeply upward, showing a concave-up shape.
  • Graph with a logarithmic vertical axis scaled from 10 to 1000 and horizontal axis from 1 to 6. Five plotted points at approximately (1, 20), (2, 52), (3, 135), (4, 351), and (5, 912) are connected by line segments. The points appear approximately collinear on this scale.
  • Graph with a logarithmic vertical axis scaled from 1 to 10 and horizontal axis from 1 to 6. Five plotted points connected by line segments appear roughly linear, but the vertical scale does not match the data values.
  • Graph with a linear vertical axis scaled from 0 to 3 and horizontal axis from 1 to 6. Five plotted points at approximately (1, 1.3), (2, 1.7), (3, 2.1), (4, 2.5), and (5, 3.0) are connected by line segments, forming a straight line. The scale and values do not match the original data.
10
Sme Calculator
1 mark
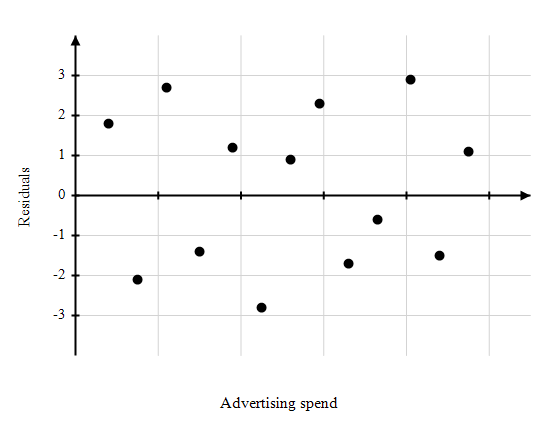
A residual plot with the horizontal axis labelled "Advertising spend" and the vertical axis labelled "Residuals", with tick marks at −3, −2, −1, 0, 1, 2, 3. A bold horizontal reference line is drawn at residual = 0. Thirteen data points are scattered randomly above and below the reference line with no discernible curve, trend, or systematic pattern. Roughly equal numbers of points appear above and below zero, and the vertical spread is consistent across the full range of advertising spend values.

A gym owner believes there is a linear relationship between monthly advertising spend and the number of new memberships signed up. After fitting a linear regression model, the residuals are plotted against advertising spend, as shown in the figure. Which of the following statements about the linear regression model is true?

  • The linear model is not appropriate, because there is a clear pattern in the graph of the residuals

  • The linear model is not appropriate, because the graph of the residuals has more points above 0 than below 0

  • The linear model is appropriate, because there is a clear pattern in the graph of the residuals

  • The linear model is appropriate, because the residuals are randomly scattered above and below 0 with no clear pattern

11
Sme Calculator
1 mark

Two function models f and g are constructed to represent the speed of a racing car. Both f \left(t\right) and g \left(t\right) represent the speed, in kilometres per hour, after t minutes for t \geq 1. If f \left(t\right) = 60 + 8 \ln t and g \left(t\right) = 2 t + 58, what is the first time t that the speed predicted by the logarithmic model will be 0.5 kilometres per hour more than the speed predicted by the linear model?

  • t \approx 0 . 921

  • t \approx 1 . 088

  • t \approx 9 . 933

  • t \approx 10 . 348

12
Sme Calculator
1 mark

The number of subscribers, in thousands, of a streaming service is modelled by the function S. The number of subscribers is expected to increase by 4\% each month. At time t = 0 years, the service has 200 thousand subscribers. If t is measured in years, which of the following is an expression for S(t)?

(Note: There are 12 months in a year.)

  • 200(0.04)^{t/12}

  • 200(0.04)^{12t}

  • 200(1.04)^{t/12}

  • 200(1.04)^{12t}

13
Sme Calculator
1 mark

A radioactive substance has a half-life of 24 minutes. In a particular sample, the amount of the substance remaining after m minutes is modelled by h left parenthesis m right parenthesis equals A subscript 0 left parenthesis 0.5 right parenthesis to the power of m divided by 24 end exponent, where A_0 is the amount at time m = 0. Which of the following functions k models the amount of the substance remaining after s seconds, where A_0 is the amount at time s = 0?

(Note: There are 60 seconds in a minute, so m equals s over 60.)

  • A_0(0.5)^{s/60}

  • A_0\left(0.5^{1/60}\right)^{24s}

  • A_0\left(0.5^{60}\right)^{s/24}

  • A_0\left(0.5^{1/1440}\right)^{s}

14
Sme Calculator
1 mark

A scientist measures the number of bacterial colonies in a culture, in thousands, at hourly intervals. The table gives the number of colonies space y at time x, where x is the number of hours since the start of the experiment.

space x

1

2

3

4

space y

7 . 50

11 . 25

16 . 88

25 . 31

Which of the following functions best models the data?

  • y = 5 . 91 x + 0 . 47

  • y = 1 . 41 x^{2} - 1 . 13 x + 7 . 50

  • y = 5 \cdot \left(1 . 5\right)^{x}

  • y = 5 . 82 + 12 . 19 \ln x

15
Sme Calculator
1 mark

An exponential model is constructed to predict the population of a species in a wildlife reserve. The reserve has a maximum sustainable population of 5,000 individuals (the carrying capacity). Initially the model fits the population well, but over a longer time horizon the model's predictions become increasingly inaccurate. Which of the following best explains why the model's error increases over time?

  • The model includes too many parameters, leading to compounded measurement errors over time.

  • Exponential models cannot be used for population data — only logarithmic models are appropriate.

  • The model's percentage growth rate becomes too small over time, causing it to underestimate the actual population.

  • The exponential model grows without bound, but the actual population is limited by the carrying capacity.

16
Sme Calculator
1 mark

The number of registered users for a social media app, in millions, is modeled by the function U given by U open parentheses t close parentheses equals 2.5 plus 4.1 ln open parentheses t plus 1 close parentheses, where t is the number of months since the app launched. Based on the model, what is the value of t, as a decimal approximation, when the number of registered users first reaches 12 million?

  • t \approx 1 . 317

  • t \approx 2 . 317

  • t \approx 9 . 146

  • t \approx 10 . 146

17
Sme Calculator
1 mark

The temperature, in degrees Celsius, of a metal rod placed in an oven t minutes after being placed is modeled by the function T given by T open parentheses t close parentheses equals a plus b ln open parentheses t plus 1 close parentheses, where a and b are constants. The temperature of the rod at t equals 0 is 20 degrees Celsius, and at t equals 7 minutes is 50 degrees Celsius.

According to the model, what is the temperature of the rod at t = 15 minutes?

  • 60 . 000

  • 61 . 763

  • 84 . 286

  • 103 . 178

18
Sme Calculator
1 mark

In the x y-plane, the graph of log subscript 2 y as a function of x is a line that passes through the points open parentheses 0 comma 3 close parentheses and open parentheses 2 comma 7 close parentheses.

Which of the following is the exponential function space y equals a times b to the power of x that models the relationship between x and y?

  • space y equals 3 times 2 to the power of x

  • space y equals 3 times 4 to the power of x

  • space y equals 8 times 2 to the power of x

  • space y equals 8 times 4 to the power of x

19
Sme Calculator
1 mark

A function space f is modeled by space f open parentheses x close parentheses equals a times b to the power of x, where a and b are constants. The graph of space f passes through the points open parentheses 2 comma 12 close parentheses and open parentheses 5 comma 96 close parentheses.

According to the model, what is the value of space f open parentheses 7 close parentheses?

  • 152

  • 384

  • 768

  • 1536