Sinusoidal Functions (College Board AP® Precalculus): Revision Note

Sinusoidal functions
What is a sinusoidal function?
A sinusoidal function is any function that can be obtained by applying additive and multiplicative transformations to the sine function
Both the sine function and the cosine function are sinusoidal functions
The cosine function is a phase shift (horizontal translation) of the sine function
i.e. is the same as shifted to the left by radians
This means any sinusoidal function can be written in terms of either sine or cosine
Sinusoidal functions are used to model a wide range of periodic phenomena
They are the most common type of periodic function encountered in this course
Key characteristics of sinusoidal functions
What are the period and frequency of a sinusoidal function?
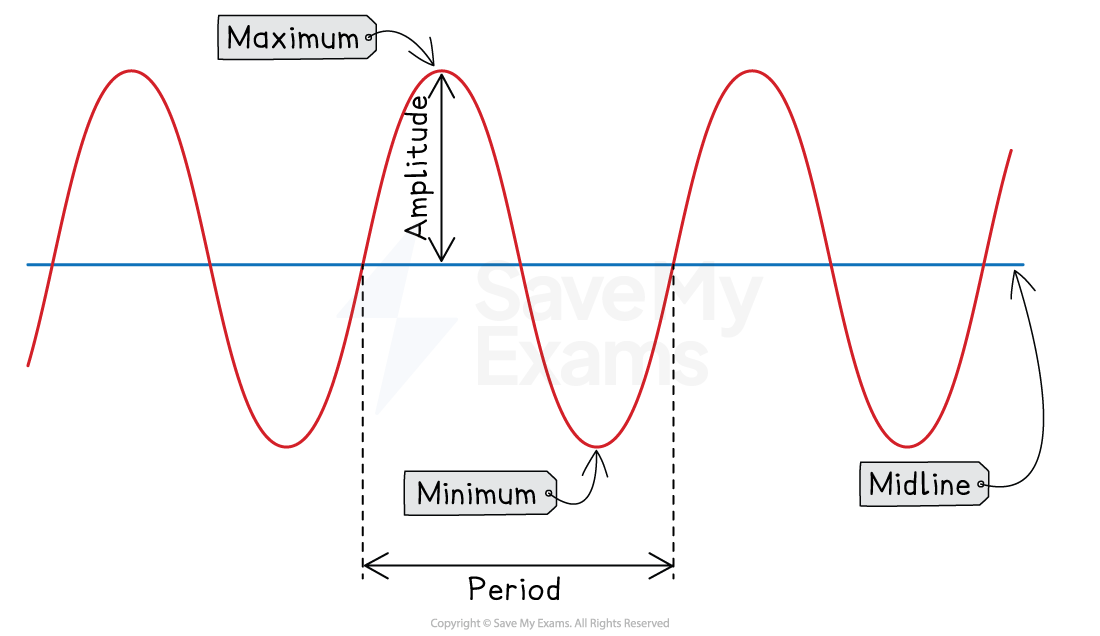
The period of a sinusoidal function is the length of one complete cycle
For the base functions and , the period is
The frequency of a sinusoidal function is the number of complete cycles per unit of input
For the base sine and cosine functions, the frequency is
The period and frequency are always reciprocals of each other
What is the amplitude of a sinusoidal function?
The amplitude of a sinusoidal function is half the difference between the maximum and minimum output values
For the base functions and
The maximum value is and the minimum value is
So the amplitude is
The amplitude measures the height of the wave above (or below) its midline
What is the midline of a sinusoidal function?
The midline of the graph of a sinusoidal function is the horizontal line located at the average (arithmetic mean) of the maximum and minimum output values:
For the base functions and
The midline is
The graph oscillates symmetrically above and below the midline
The amplitude can also be understood as the distance from the midline to the maximum (or to the minimum)
How does the concavity of a sinusoidal function change?
As the input values increase, the graph of a sinusoidal function oscillates between concave down and concave up
Sections of the graph near a maximum are concave down
the graph curves downward, shaped like an upside-down cup
Sections of the graph near a minimum are concave up
the graph curves upward, shaped like a cup
The changeover between concave up and concave down occurs at points of inflection
which are located on the midline
This alternating concavity is directly linked to how the rate of change behaves:
When the graph is concave down, the rate of change is decreasing
When the graph is concave up, the rate of change is increasing
What symmetry do the sine and cosine functions have?
The sine function has rotational symmetry about the origin
This makes sine an odd function
Graphically, rotating the graph about the origin produces the same graph
The cosine function has reflective symmetry over the -axis
This makes cosine an even function
Graphically, reflecting the graph across the -axis produces the same graph
Examiner Tips and Tricks
When an exam question asks you to describe the "behavior" of a sinusoidal function at a particular input value, it is asking about two things:
Whether the function is increasing or decreasing
and whether the rate of change is increasing or decreasing (which is determined by the concavity)
Thinking about where the input value falls relative to the maximum, minimum, and midline of the function will help you answer these questions. A quick sketch of the graph can make this much easier to see.
Worked Example
The average daily temperature, in degrees Fahrenheit, for a certain city can be modeled by the function given by , where is the day of the year for . Which of the following best describes the behavior of on day 170?
(A) The average daily temperature is increasing at a decreasing rate.
(B) The average daily temperature is decreasing at a decreasing rate.
(C) The average daily temperature is increasing at an increasing rate.
(D) The average daily temperature is decreasing at an increasing rate.
Answer:
A question like this would appear on the calculator part of the exam
So start by using your calculator to graph the function
noting especially what is happening at the point where
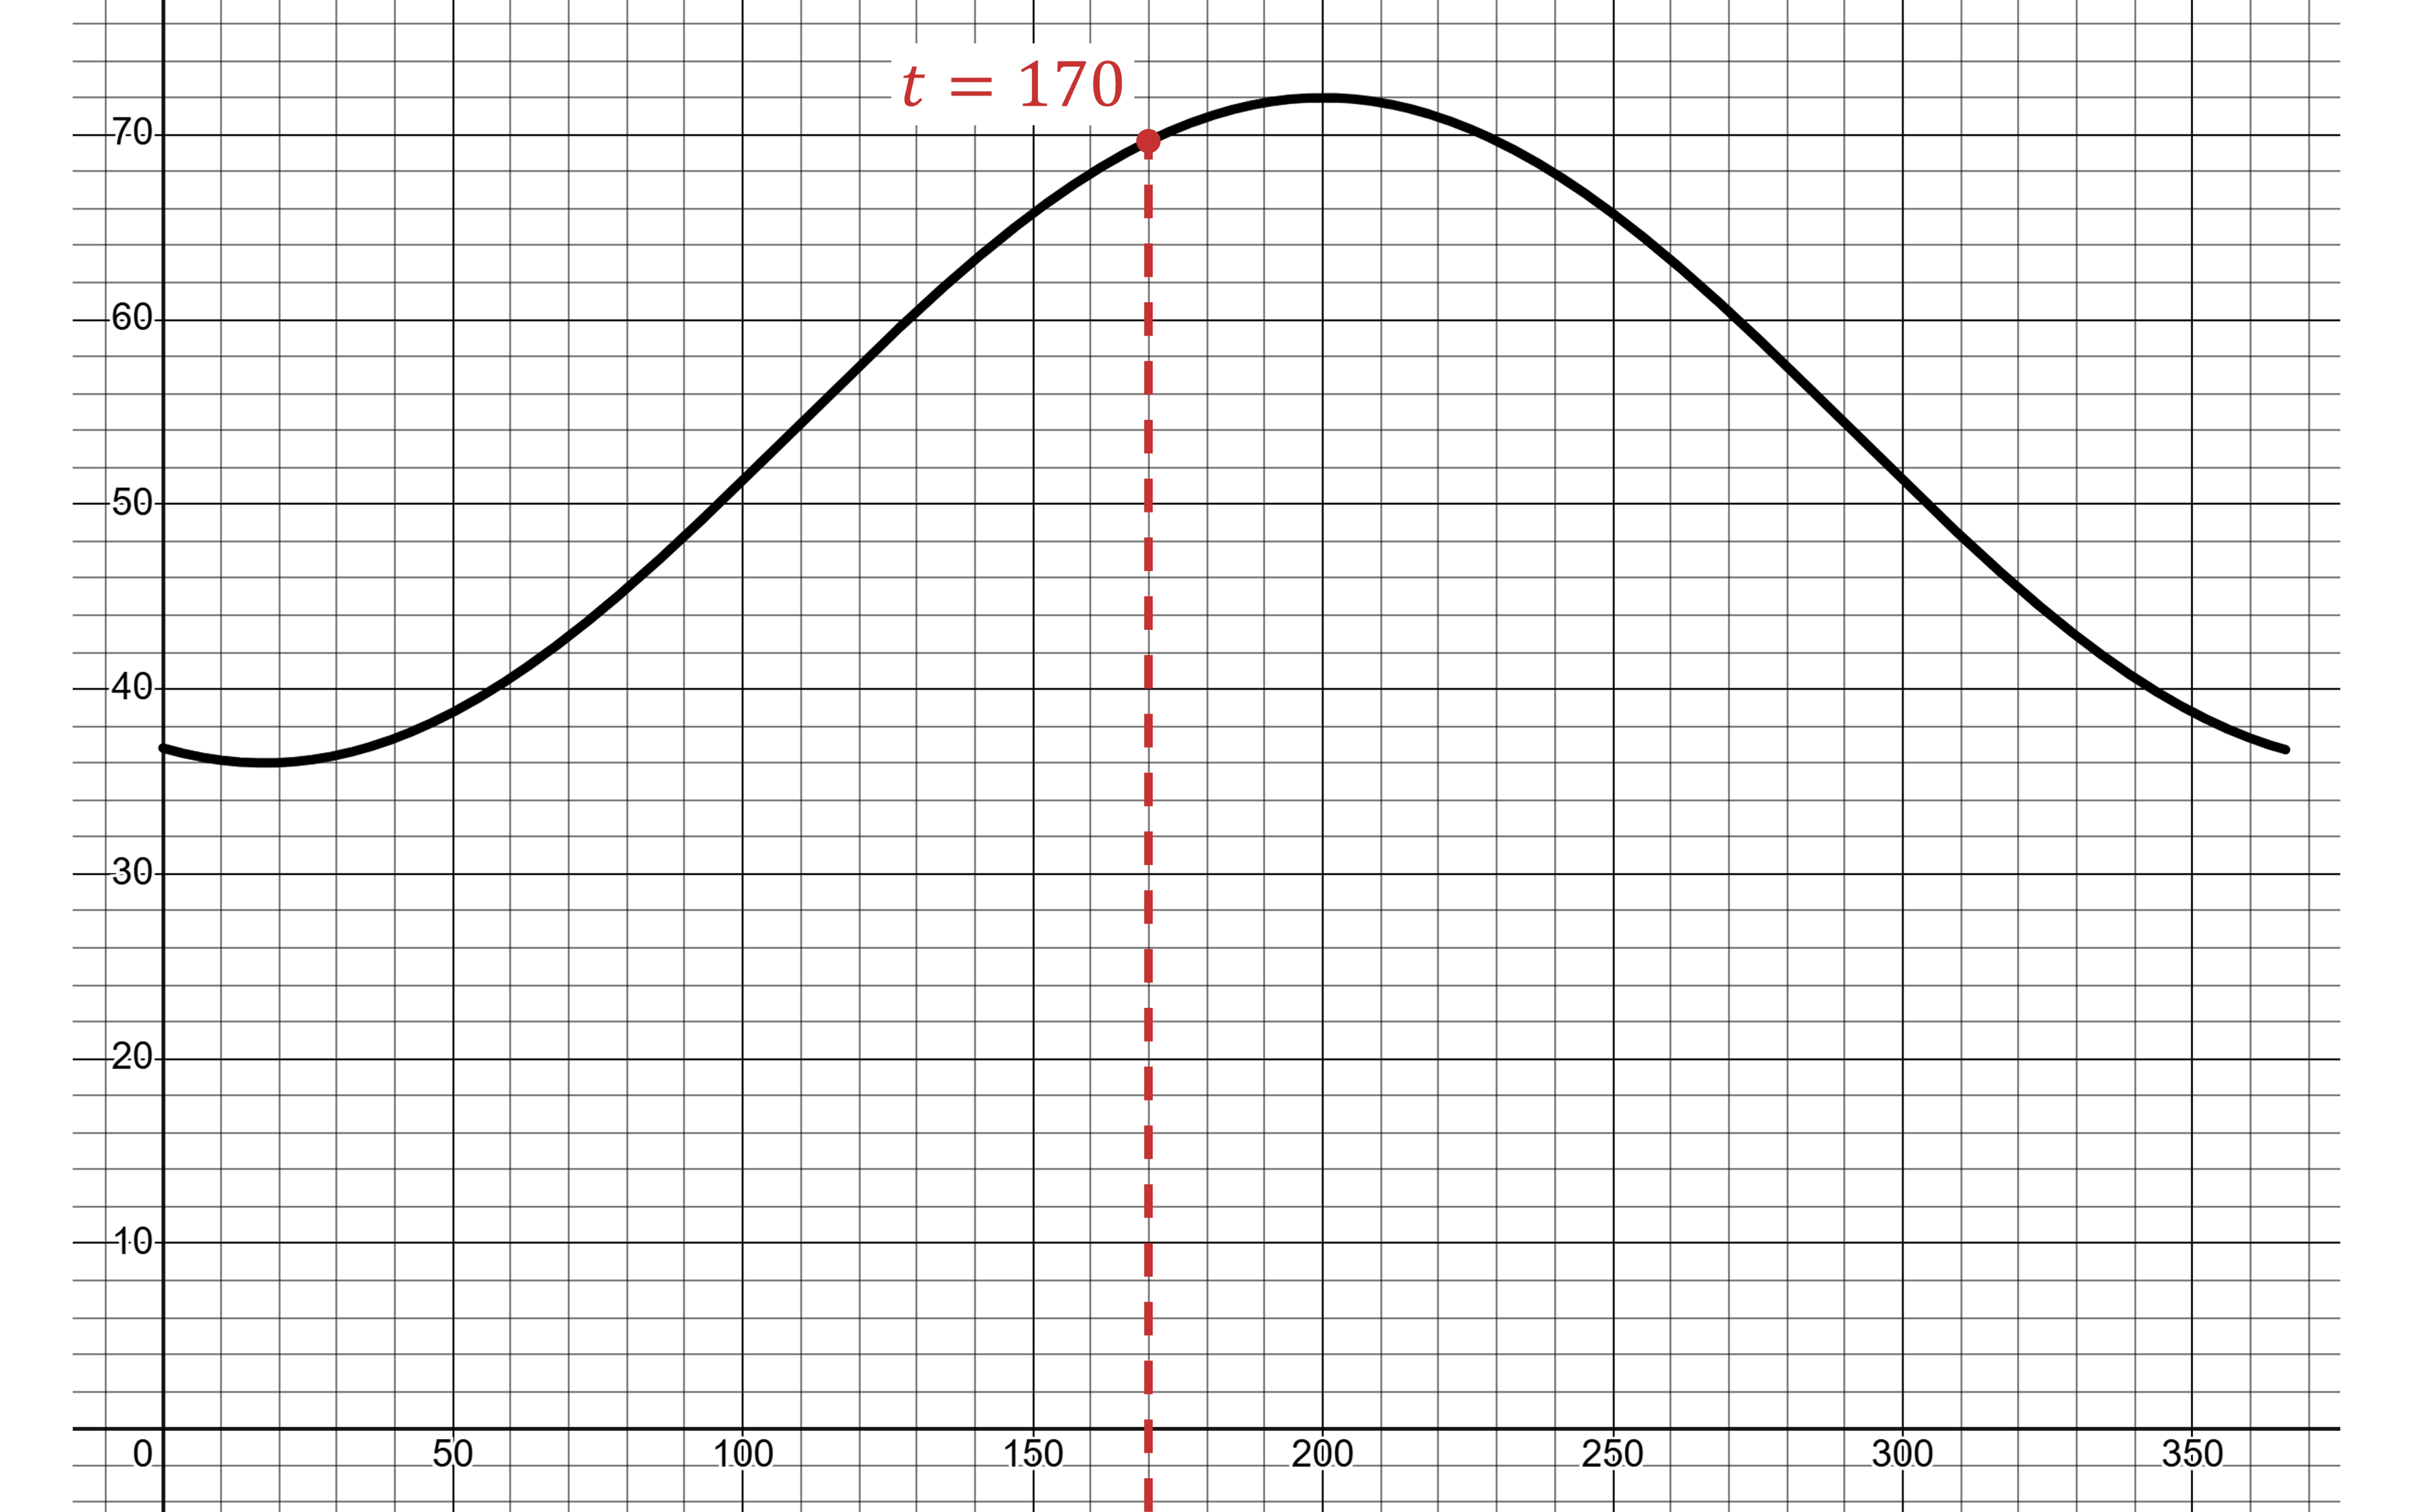
At that point the graph is just to the left of the maximum
so the temperature is increasing
The point is also clearly between the midline (at ) and the maximum
so the function is concave down at that point
which means the rate of change is decreasing
(A) The average daily temperature is increasing at a decreasing rate

Unlock more, it's free!
Join the 100,000+ Students that ❤️ Save My Exams
the (exam) results speak for themselves:

Was this revision note helpful?
Build on this topic