Combined Transformations of Sinusoidal Functions (College Board AP® Precalculus): Revision Note

Roger B

Written by: Roger B

Reviewed by: Mark Curtis

Updated on

Combined transformations of sinusoidal functions

How do all four transformations work together?

  • The general form of a sinusoidal function with all transformations combined is

    • space f left parenthesis theta right parenthesis equals a sin left parenthesis b left parenthesis theta plus c right parenthesis right parenthesis plus d    text or end text    f left parenthesis theta right parenthesis equals a cos left parenthesis b left parenthesis theta plus c right parenthesis right parenthesis plus d

  • The parameters a comma space b comma space c and d describe the following characteristics of the graph

Parameter

Characteristic

How to find it from the graph

open vertical bar a close vertical bar

Amplitude

\frac{\text{max} - \text{min}}{2}

d

Vertical shift (midline at space y equals d)

\frac{\text{max} + \text{min}}{2}

fraction numerator 2 pi over denominator open vertical bar b close vertical bar end fraction

Period

Horizontal distance between two consecutive maxima (or minima)

-c

Phase shift

Horizontal displacement from the base function's starting position

  • If bold italic a bold greater than bold 0, the function oscillates normally

  • If bold italic a bold less than bold 0, the graph is reflected over the midline

    • peaks and troughs are swapped

How can the amplitude and vertical shift be found from a graph?

  • Read the maximum and minimum output values from the graph

  • The amplitude is

    • vertical line a vertical line equals fraction numerator text max end text minus text min end text over denominator 2 end fraction

  • The vertical shift (midline) is

    • d equals fraction numerator text max end text plus text min end text over denominator 2 end fraction

  • For example, if a sinusoidal graph has a maximum of 7 and a minimum of 1

    • Amplitude: vertical line a vertical line equals fraction numerator 7 minus 1 over denominator 2 end fraction equals 3

    • Vertical shift: d equals fraction numerator 7 plus 1 over denominator 2 end fraction equals 4

      • so the midline is y equals 4

How can the period and the value of b be found from a graph?

  • The period is the horizontal distance between

    • two consecutive maxima

    • two consecutive minima

    • or any two consecutive corresponding points on the graph

  • Once the period is known, the value of bold vertical line bold italic b bold vertical line can be found using:

    • vertical line b vertical line equals fraction numerator 2 pi over denominator text period end text end fraction

  • For example, if consecutive maxima occur at x = 1 and x = 5

    • Period: 5 - 1 = 4

    • |b| = \frac{2\pi}{4} = \frac{\pi}{2}

How can the phase shift be determined?

  • The phase shift describes the horizontal displacement of the graph

    • compared to the base sine or cosine function

  • For a cosine model (a cos left parenthesis b left parenthesis theta plus c right parenthesis right parenthesis plus d)

    • The base cosine function has its maximum at \theta = 0

    • If the graph's first maximum occurs at theta equals h

      • then the phase shift is h units to the right

      • which means c equals negative h

        • or equivalently, the shift is negative c equals h

  • For a sine model (a sin left parenthesis b left parenthesis theta plus c right parenthesis right parenthesis plus d)

    • The base sine function crosses the midline (going upward) at theta equals 0

    • If the graph first crosses the midline going upward at theta equals h

      • then the phase shift is h units to the right

      • which means c equals negative h

        • or equivalently, the shift is negative c equals h

  • The phase shift is often the trickiest parameter to determine

    • It helps to first decide whether to use a sine or cosine model (a question may decide this for you)

    • and then identify the appropriate reference point on the graph

Examiner Tips and Tricks

When reading a graph to determine the phase shift, be careful about the difference between the shift in the theta-value and the value of c in the equation.

If a cosine graph reaches its first maximum at theta equals h, then the equation has left parenthesis theta minus h right parenthesis inside the cosine, which means c equals negative h.

  • A common error is to write c = h instead

  • Always verify your equation by substituting a known point from the graph

What is the systematic process for finding the equation from a graph?

  • Start by reading the maximum and minimum values from the graph

    • Use these to find the amplitude (vertical line a vertical line) and vertical shift (d)

      • Unless a question specifies otherwise, you can assume that a is positive

        • in which case a is simply equal to the amplitude

  • Next identify two consecutive maxima (or minima)

    • Use these to find the period

    • then calculate vertical line b vertical line

      • Unless a question specifies otherwise, you can assume that b is positive

        • in which case b is simply equal to fraction numerator 2 pi over denominator text period end text end fraction

  • At this point you need to decide whether to use a sine or cosine model

    • Cosine is often convenient when a maximum or minimum is clearly visible

    • Sine is convenient when a midline crossing (going upward) is clearly visible

    • Often a question will tell you whether a sine or cosine model is to be used

  • Now you can identify the phase shift

    • by comparing the graph's reference point

    • to where the base function would normally have that feature

  • Finally write the equation

    • and verify by checking that the function matches at least one or two key points on the graph

Examiner Tips and Tricks

Remember that the same graph can be described by either a sine or cosine model. A cosine function is just a phase-shifted sine function, and vice versa

  • However on the exam, if you are given a specific form to use (e.g. h left parenthesis t right parenthesis equals a sin left parenthesis b left parenthesis t plus c right parenthesis right parenthesis plus d), make sure you use it

    • even if a different model might feel more natural to you

Also note that the parameters a and b will almost always be positive in exam questions.

  • It is always possible to write a model using a greater than 0 and b greater than 0

  • The difference between that and a model with negative values for a and b can always be represented instead as an appropriate phase shift

Worked Example

Sine wave graph with peaks at (-2pi/3,4), (pi/3,4), (4pi/3,4), and troughs at (-pi/6,-2), (5pi/6,-2), (11pi/6,-2); labelled axes x and y.

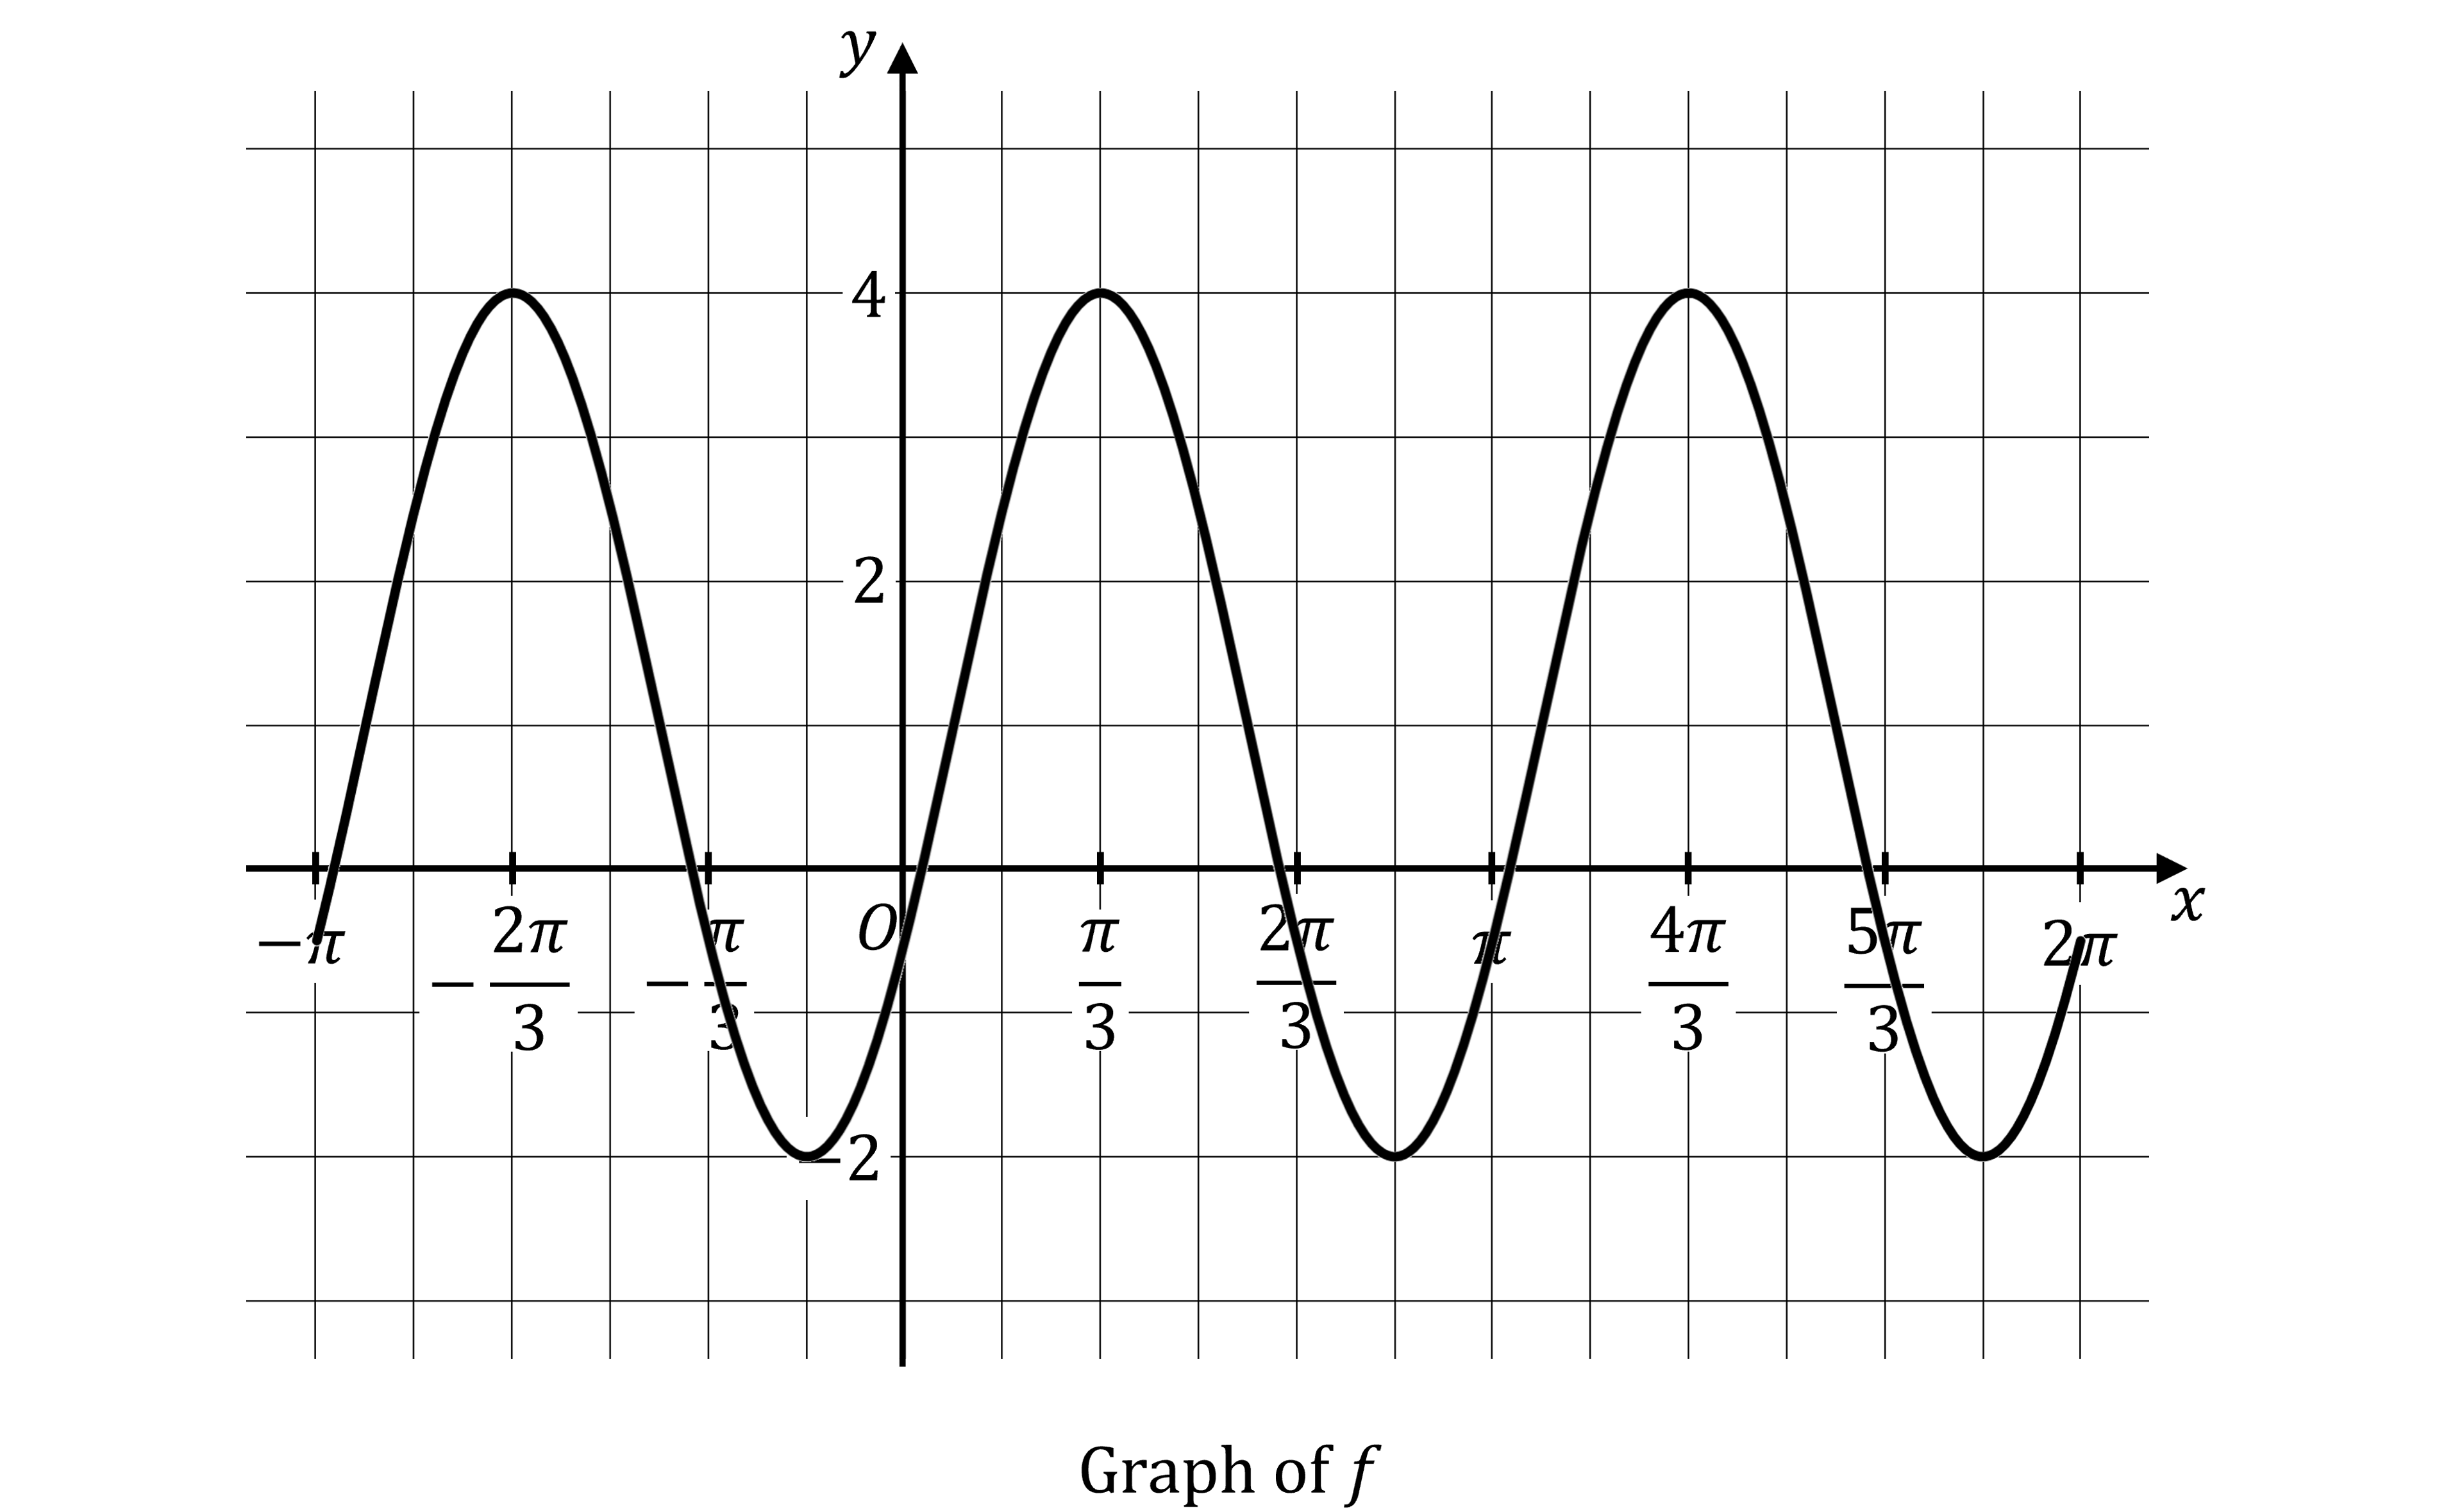
The figure shows the graph of a trigonometric function space f. Which of the following could be an expression for space f left parenthesis x right parenthesis?

(A) space 3 cos space blank open parentheses 2 space blank open parentheses x minus pi over 3 close parentheses close parentheses plus 1

(B) space 3 cos space blank open parentheses 2 space blank open parentheses x minus pi over 6 close parentheses close parentheses plus 1

(C) space 3 sin space blank open parentheses 2 space blank open parentheses x minus pi over 3 close parentheses close parentheses plus 1

(D) space 3 sin space blank open parentheses 2 space blank open parentheses x minus pi over 6 close parentheses close parentheses plus 1

Answer:

Start by finding the amplitude and vertical shift

  • The maximum value is 4 and the minimum value is -2

vertical line a vertical line equals fraction numerator 4 minus left parenthesis negative 2 right parenthesis over denominator 2 end fraction equals 3 comma    space space d equals fraction numerator 4 plus left parenthesis negative 2 right parenthesis over denominator 2 end fraction equals 1

So the amplitude is 3 and the midline is at space y equals 1

  • This is consistent with all four answer options

Next find the period and b

  • Consecutive maxima appear at x equals pi over 3 and x equals fraction numerator 4 pi over denominator 3 end fraction

\text{period} = \frac{4\pi}{3} - \frac{\pi}{3} = \pi

|b| = \frac{2\pi}{\pi} = 2

  • This is also consistent with all four options.

To distinguish between the models, determine the phase shift

  • The graph reaches a maximum at x equals pi over 3

  • For a cosine model, the maximum of the base function cos theta occurs at theta equals 0, so the maximum has been shifted right to x equals pi over 3

  • This means

b(x + c) = 0 \text{ when } x = \frac{\pi}{3}

2 blank open parentheses pi over 3 plus c close parentheses equals 0 space space rightwards double arrow space space c equals negative pi over 3 space

This gives option (A) as the correct answer, 3 cos space blank open parentheses 2 space blank open parentheses x minus pi over 3 close parentheses close parentheses plus 1

  • You can verify this by checking a couple of points

At x equals pi over 3:
3 cos left parenthesis 2 times 0 right parenthesis plus 1 equals 3 left parenthesis 1 right parenthesis plus 1 equals 4

At x equals fraction numerator 5 pi over denominator 6 end fraction:
3 cos space blank open parentheses 2 space blank open parentheses fraction numerator 5 pi over denominator 6 end fraction minus pi over 3 close parentheses close parentheses plus 1 equals 3 cos left parenthesis pi right parenthesis plus 1 equals negative 3 plus 1 equals negative 2

It's worth looking at why the other options are incorrect

  • Option (B) uses c equals negative pi over 6 instead of c equals negative pi over 3

    • This function would have a maximum at open parentheses pi over 6 comma space 4 close parentheses instead of at open parentheses pi over 3 comma space 4 close parentheses

  • Option (C) uses a sine function, 3 sin space blank open parentheses 2 space blank open parentheses x minus pi over 3 close parentheses close parentheses plus 1

    • That particular model would have a midline crossing at x equals pi over 3, not a maximum point

  • Option (D) also uses a sine function, 3 sin space blank open parentheses 2 space blank open parentheses x minus pi over 6 close parentheses close parentheses plus 1

    • That particular model would have a midline crossing at x equals pi over 6, and a maximum point at fraction numerator 5 pi over denominator 12 end fraction

(A) space 3 cos space blank open parentheses 2 space blank open parentheses x minus pi over 3 close parentheses close parentheses plus 1

Unlock more, it's free!

Join the 100,000+ Students that ❤️ Save My Exams

the (exam) results speak for themselves:

Roger B

Author: Roger B

Expertise: Maths Content Creator

Roger's teaching experience stretches all the way back to 1992, and in that time he has taught students at all levels between Year 7 and university undergraduate. Having conducted and published postgraduate research into the mathematical theory behind quantum computing, he is more than confident in dealing with mathematics at any level the exam boards might throw at you.

Mark Curtis

Reviewer: Mark Curtis

Expertise: Maths Content Creator

Mark graduated twice from the University of Oxford: once in 2009 with a First in Mathematics, then again in 2013 with a PhD (DPhil) in Mathematics. He has had nine successful years as a secondary school teacher, specialising in A-Level Further Maths and running extension classes for Oxbridge Maths applicants. Alongside his teaching, he has written five internal textbooks, introduced new spiralling school curriculums and trained other Maths teachers through outreach programmes.