Graph of an Inverse Function (College Board AP® Precalculus): Revision Note

Graph of an inverse function
How is the graph of an inverse function related to the graph of the original?
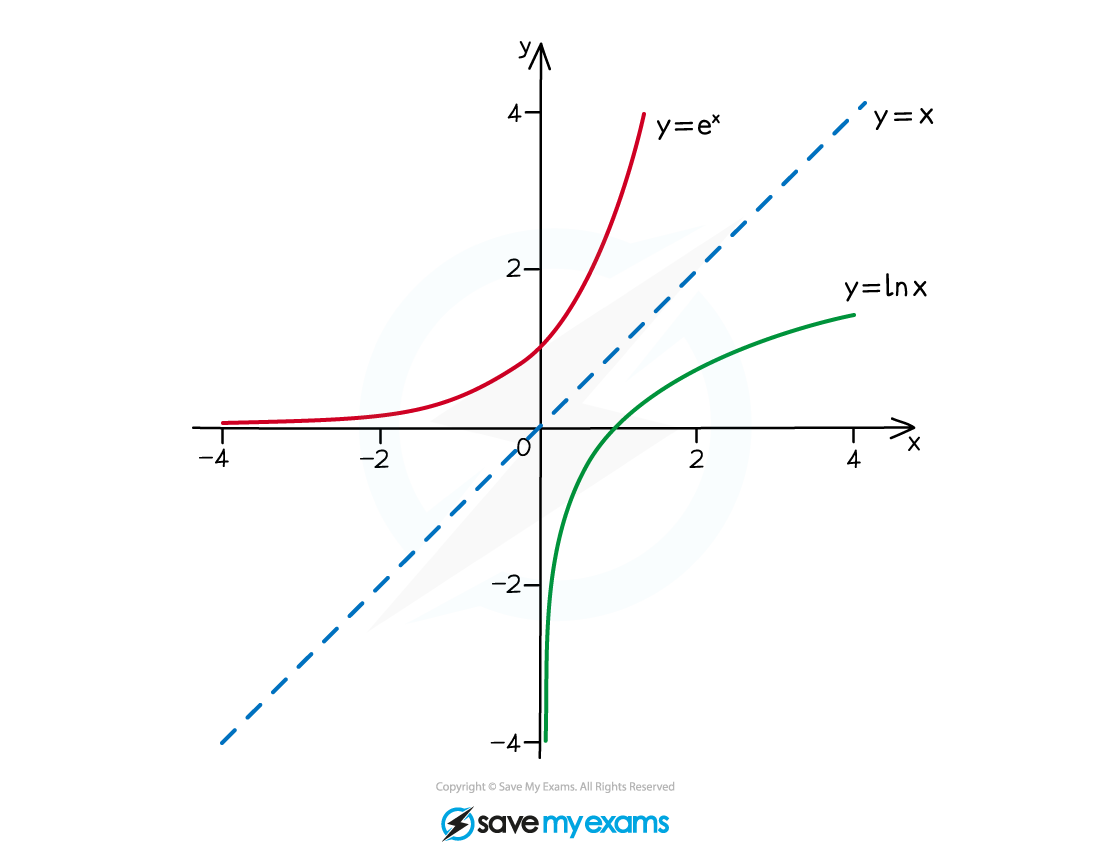
The graph of is the reflection of the graph of
over the line
This is because
reflecting a point over the line
gives the point
which is exactly the swap of inputs and outputs that the inverse performs
If a point lies on the graph of ,
then the point lies on the graph of
Key features of the graph also swap:
-intercepts of become -intercepts of
and vice versa
Vertical asymptotes of become horizontal asymptotes of
and vice versa
If is increasing, then is also increasing
Examiner Tips and Tricks
When reading inverse values from a graph of :
to find , locate on the -axis (not the -axis)
then read across to the curve and down to the -axis
A common mistake is to look up on the -axis instead.
Worked Example

The graph of the piecewise-linear function is shown in the figure. Let be the inverse function of . What is the maximum value of ?
(A)
(B)
(C)
(D)
Answer:
The graph of an function's inverse is a reflection of the graph of the function over the line
Sketch the reflection of the graph of
point goes to
point goes to
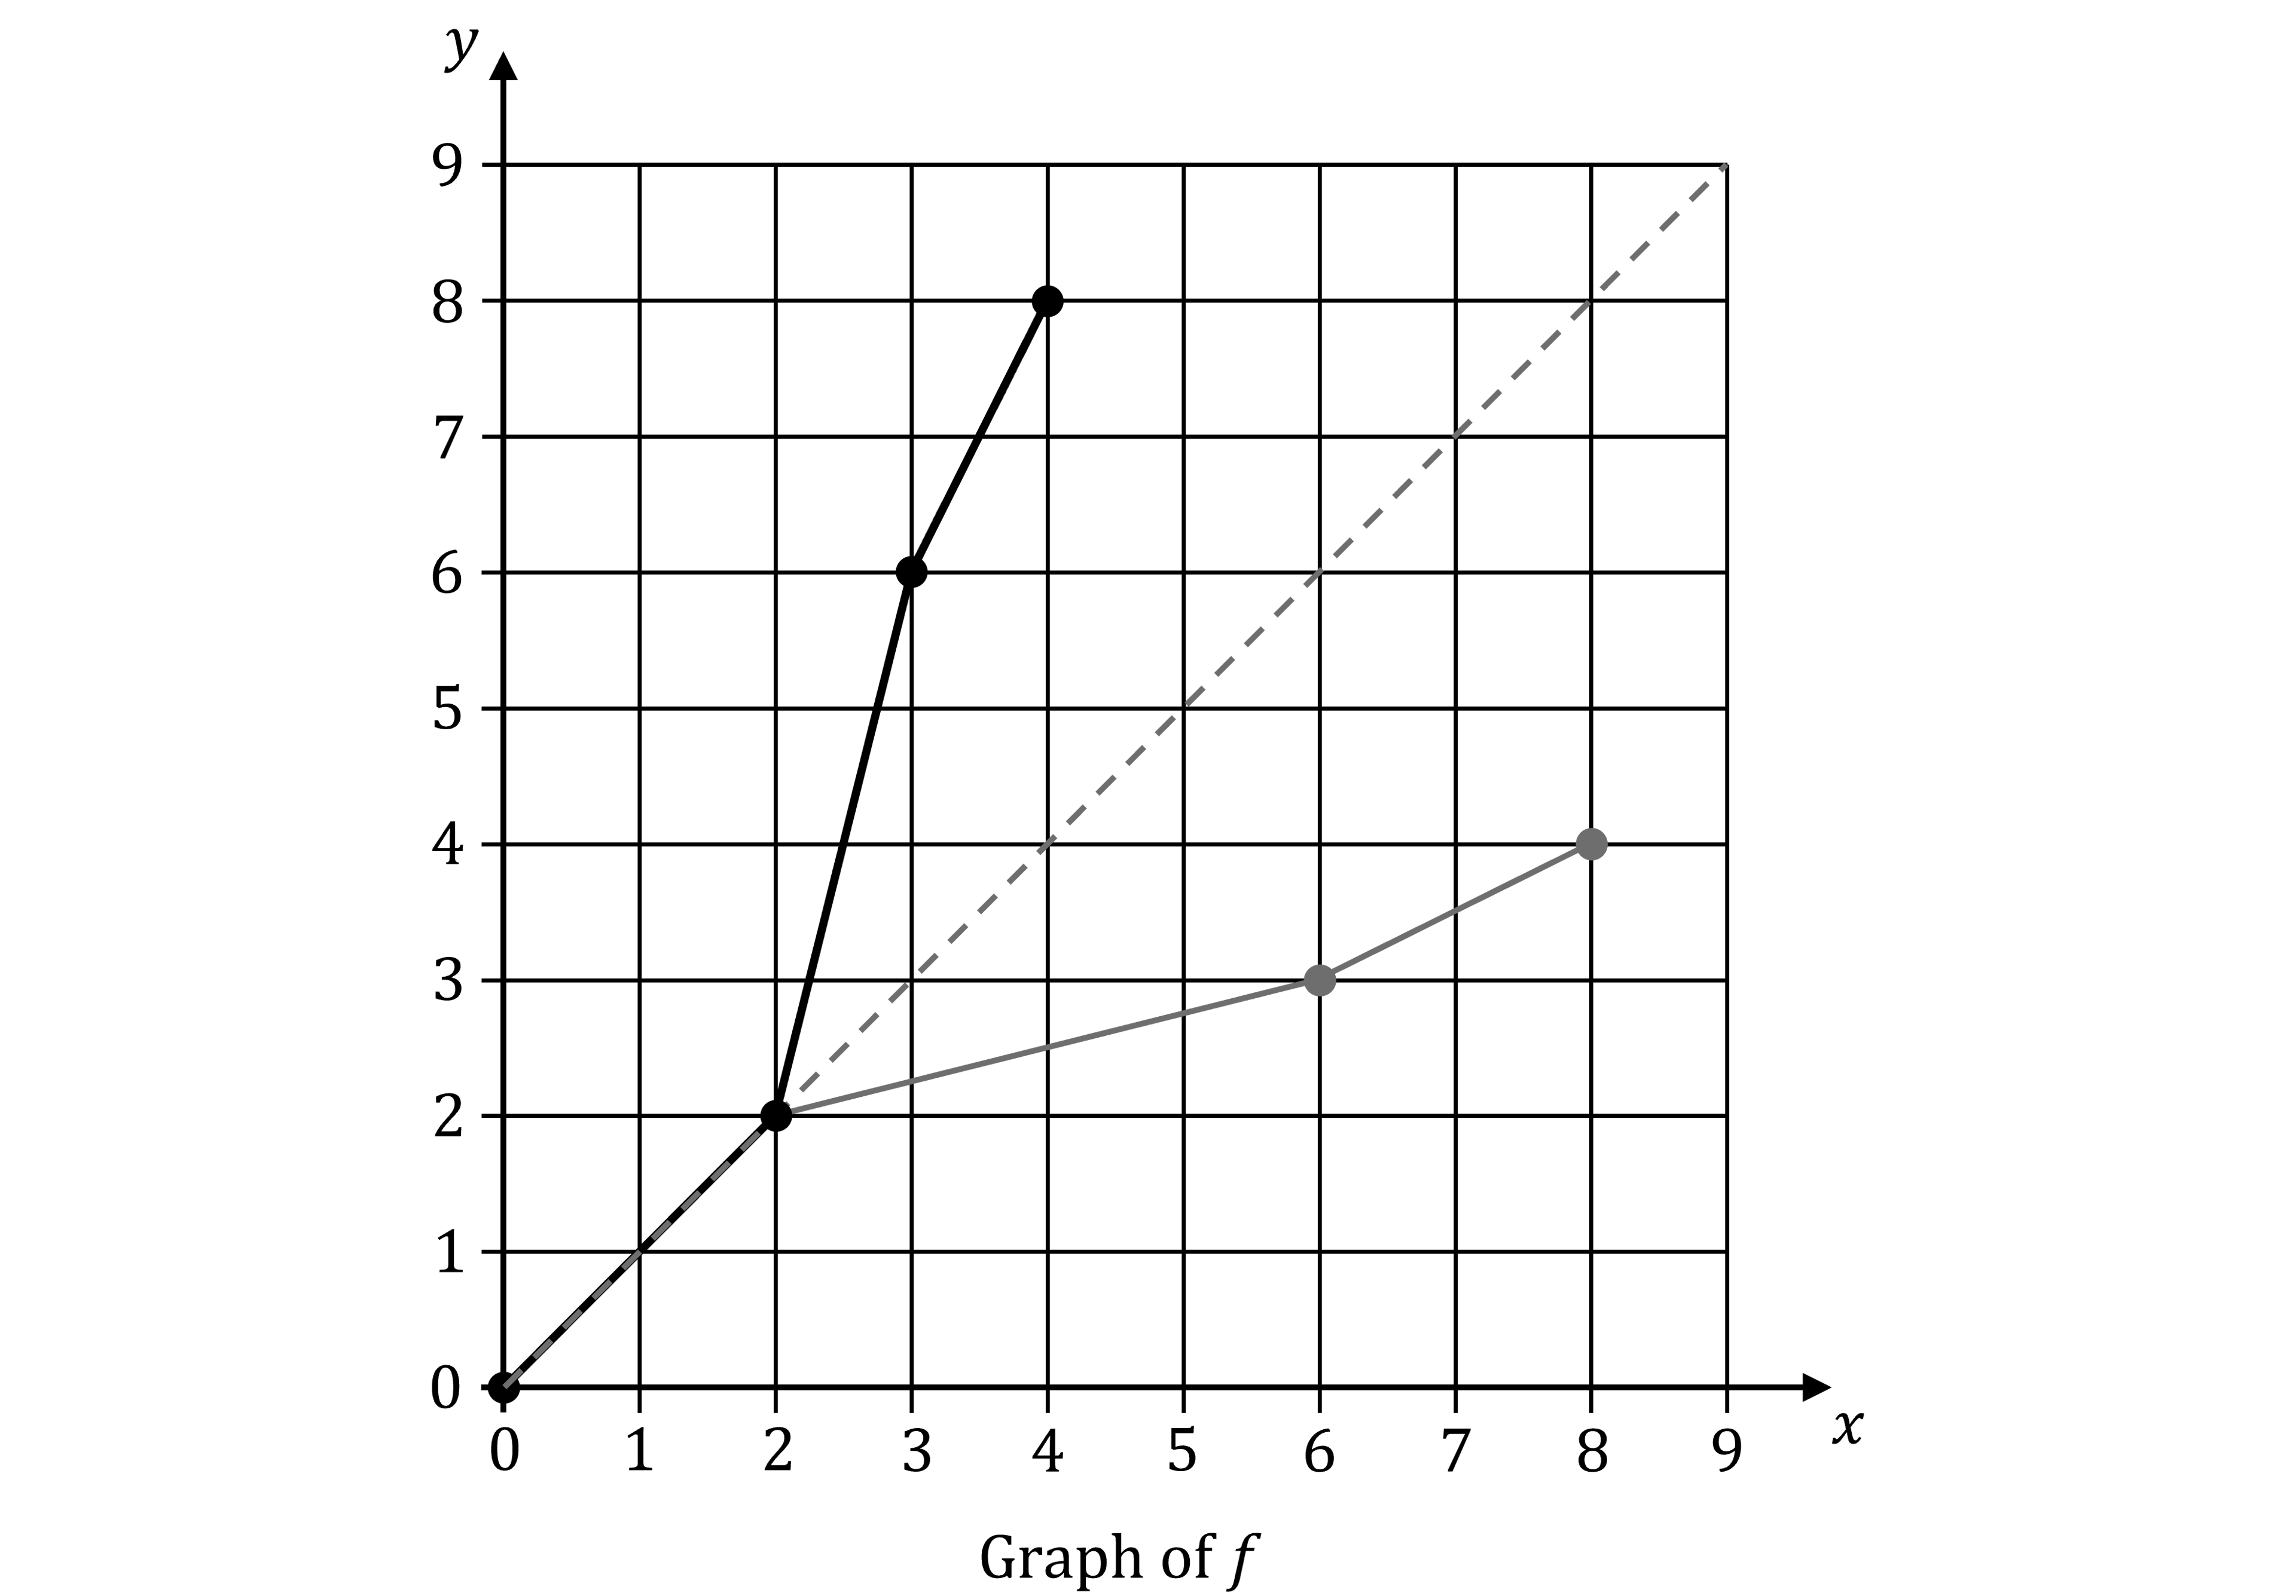
You can see from the sketch that the maximum value of occurs at the point
(C)

Unlock more, it's free!
Join the 100,000+ Students that ❤️ Save My Exams
the (exam) results speak for themselves:

Was this revision note helpful?
Build on this topic
