Scientific Communication (Edexcel AS Physics): Revision Note
Exam code: 8PH0

Scientific Communication
Scientific communication of the results of an experiment are extremely important
The ideas must be communicated in an appropriate way using appropriate terminology
This involves using terms such as accuracy, validity and stating the sources of random and systematic errors
Scientists have to design an experiment to answer a question or investigate something
These will involve dependent and independent variables
An independent variable is what is changed
A dependent variable is what is measured
The control variables are what do not change
For example, in an investigation of the variation of potential difference and current across a light bulb
The independent variable is the potential difference
The dependent variable is the current
The control variable would be the temperature of the apparatus
Data must always be presented in a scientific way
This may include:
Tables
Graphs
Diagrams
Presenting Data in Tables
When taking readings, a sensible range should be taken, and the values should all be stated to an appropriate number of significant figures or decimal places
This is usually the same number as the resolution of the measuring instrument
The columns in any table should have both a quantity and a unit in their heading
When labelling columns, the names of the quantities should be separated from their unit by a forward slash ( / )
For data displayed in a table:
The first column should contain the independent variable
The second column should contain the dependent variable
If repeat readings of the dependent variable are required, these should be included with a column for the mean value at the end
Any columns required for processing data e.g. calculations should come after this
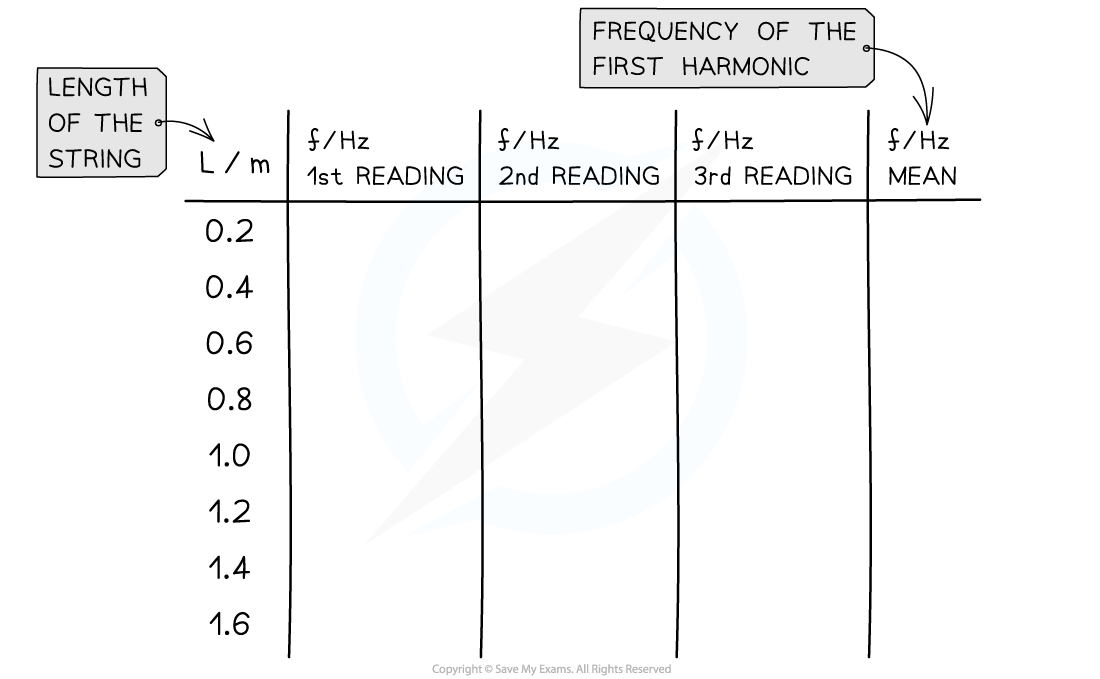
Conventions for presenting data in a table. The length is the independent variable and the frequency is the dependent variable
In summary, when presenting tables the following must be included:
Clear headings, or symbols, for columns
Relevant units for measurements
Readings listed to the same number of significant figures

An example of a correctly labelled table with corresponding graph
Presenting Data on a Graph
All readings, including suspected anomalous results, should be plotted on a graph so that they can be easily identified
When taking repeat readings, it is the mean value that is plotted
The way data is presented on a graph depends on what type of data it is
Discrete data
Only certain values can be taken, normally a whole number e.g. number of students
This should be displayed on a scatter graph or bar chart
Continuous data
Can take any value on a scale e.g. voltage in a circuit
This should be displayed on a line or scatter graph
Categorical data
Values that can be sorted into categories e.g. types of material
This should be displayed on a pie or bar chart
Ordered data
Data that can be put in ordered categories e.g. low, medium, high
This should be displayed on a bar chart
In summary, when presenting graphs the following must be included:
An explanatory title
Clearly labeled axes
Relevant units for measurements
Well plotted points
A smooth line or curve of best fit

An example of a correctly labelled and plotted graph
Presenting Diagrams
When presenting diagrams, such as apparatus set-up, all the relevant parts must be clearly labelled

An appropriately labeled diagram of the set-up of an investigation into simple harmonic motion

Unlock more, it's free!
Join the 100,000+ Students that ❤️ Save My Exams
the (exam) results speak for themselves:

Was this revision note helpful?
Build on this topic