Determining Uncertainties from Graphs (DP IB Physics): Revision Note

Determining uncertainties from graphs
Uncertainty bars
The uncertainty in a measurement can be represented on a graph as an uncertainty bar, or error bar
This bar is drawn above and below the point (or from side to side) and shows the uncertainty in that measurement
Error bars are plotted on graphs to show the absolute uncertainty of values plotted
Representing uncertainty bars on a graph

Examiner Tips and Tricks
A common exam question in Paper 1B (data-based questions) is to ask whether a relationship between two variables is consistent with experimental data. Typically, given a graph with plotted data points and error bars, you would be expected to say that a line of best fit should pass through all the error bars.
The relationship between two variables is
linear if it is possible to draw a straight line through all the error bars
non-linear if it is possible to draw a smooth curve through all the error bars, but not a straight line
Calculating uncertainty in gradients and intercepts
To calculate the uncertainty in a gradient, two lines of best fit should be drawn on the graph:
The ‘best’ line of best fit, which passes as close to the points as possible
The ‘worst’ line of best fit, either the steepest possible or the shallowest possible line which fits within all the error bars
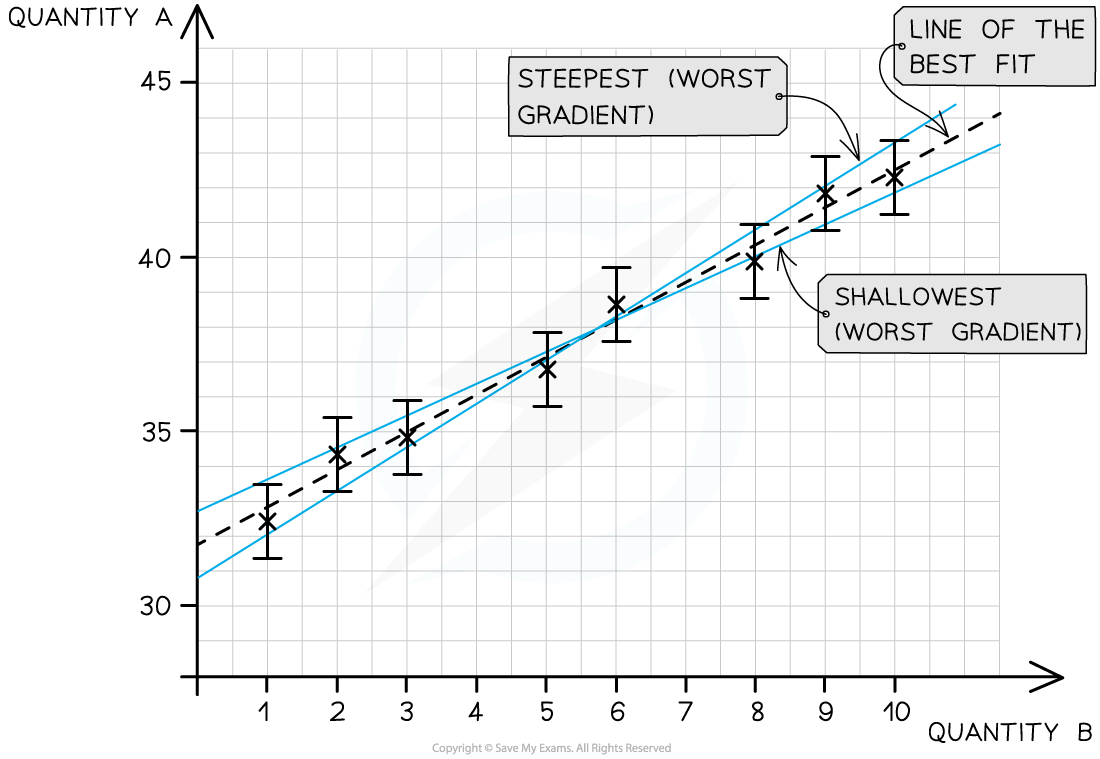
The line of best fit passes as close as possible to all the points. The steepest and shallowest lines are known as the worst fit
The percentage uncertainty in the gradient can be found using the magnitude of the 'best' and 'worst' gradients:
percentage uncertainty = ![]()
Either the steepest or shallowest line of best fit may have the 'worst' gradient on a case-by-case basis
The 'worst' gradient will be the one with the greatest difference in magnitude from the 'best' line of best fit.
The equation above is for the case where the 'worst' gradient is the shallowest.
If the 'worst' gradient is the steepest, then the 'worst' gradient should be subtracted from the 'best' gradient and then divided by the best gradient and multiplied by 100
Alternatively, the average of the two maximum and minimum lines can be used to calculate the absolute uncertainty:
absolute uncertainty = ![]()
The percentage and absolute uncertainty in the y-intercept can be found using:
percentage uncertainty = ![]()
absolute uncertainty = ![]()
Worked Example
On the axes provided, plot the graph for the following data and draw error bars and lines of best and worst fit.
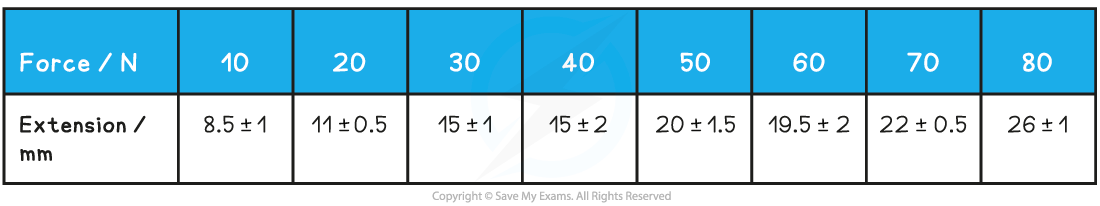
Find the percentage uncertainty in the gradient from your graph.

Answer:
Step 1: Draw sensible scales on the axes and plot the data

Step 2: Draw the errors bars for each point

Step 3: Draw the line of best fit

Step 4: Draw the line of worst fit

Step 5: Work out the gradient of each line and calculate the percentage uncertainty

best gradient =
format('truetype')%3Bfont-weight%3Anormal%3Bfont-style%3Anormal%3B%7D%3C%2Fstyle%3E%3C%2Fdefs%3E%3Cline%20stroke%3D%22%23000%22%20stroke-linecap%3D%22square%22%20stroke-width%3D%221%22%20x1%3D%222.5%22%20x2%3D%2230.5%22%20y1%3D%2223.5%22%20y2%3D%2223.5%22%2F%3E%3Ctext%20font-family%3D%22math1c878e24efc05354e08bac6a2b5%22%20font-size%3D%2216%22%20text-anchor%3D%22middle%22%20x%3D%2211.5%22%20y%3D%2216%22%3E%26%23x2206%3B%3C%2Ftext%3E%3Ctext%20font-family%3D%22Times%20New%20Roman%22%20font-size%3D%2218%22%20font-style%3D%22italic%22%20text-anchor%3D%22middle%22%20x%3D%2223.5%22%20y%3D%2216%22%3Ey%3C%2Ftext%3E%3Ctext%20font-family%3D%22math1c878e24efc05354e08bac6a2b5%22%20font-size%3D%2216%22%20text-anchor%3D%22middle%22%20x%3D%2211.5%22%20y%3D%2241%22%3E%26%23x2206%3B%3C%2Ftext%3E%3Ctext%20font-family%3D%22Times%20New%20Roman%22%20font-size%3D%2218%22%20font-style%3D%22italic%22%20text-anchor%3D%22middle%22%20x%3D%2223.5%22%20y%3D%2241%22%3Ex%3C%2Ftext%3E%3Ctext%20font-family%3D%22math1c878e24efc05354e08bac6a2b5%22%20font-size%3D%2216%22%20text-anchor%3D%22middle%22%20x%3D%2245.5%22%20y%3D%2230%22%3E%3D%3C%2Ftext%3E%3Cline%20stroke%3D%22%23000%22%20stroke-linecap%3D%22square%22%20stroke-width%3D%221%22%20x1%3D%2260.5%22%20x2%3D%22115.5%22%20y1%3D%2223.5%22%20y2%3D%2223.5%22%2F%3E%3Ctext%20font-family%3D%22Times%20New%20Roman%22%20font-size%3D%2218%22%20text-anchor%3D%22middle%22%20x%3D%2271.5%22%20y%3D%2216%22%3E26%3C%2Ftext%3E%3Ctext%20font-family%3D%22math1c878e24efc05354e08bac6a2b5%22%20font-size%3D%2216%22%20text-anchor%3D%22middle%22%20x%3D%2292.5%22%20y%3D%2216%22%3E%26%23x2212%3B%3C%2Ftext%3E%3Ctext%20font-family%3D%22Times%20New%20Roman%22%20font-size%3D%2218%22%20text-anchor%3D%22middle%22%20x%3D%22109.5%22%20y%3D%2216%22%3E6%3C%2Ftext%3E%3Ctext%20font-family%3D%22Times%20New%20Roman%22%20font-size%3D%2218%22%20text-anchor%3D%22middle%22%20x%3D%2271.5%22%20y%3D%2241%22%3E80%3C%2Ftext%3E%3Ctext%20font-family%3D%22math1c878e24efc05354e08bac6a2b5%22%20font-size%3D%2216%22%20text-anchor%3D%22middle%22%20x%3D%2292.5%22%20y%3D%2241%22%3E%26%23x2212%3B%3C%2Ftext%3E%3Ctext%20font-family%3D%22Times%20New%20Roman%22%20font-size%3D%2218%22%20text-anchor%3D%22middle%22%20x%3D%22109.5%22%20y%3D%2241%22%3E0%3C%2Ftext%3E%3Ctext%20font-family%3D%22math1c878e24efc05354e08bac6a2b5%22%20font-size%3D%2216%22%20text-anchor%3D%22middle%22%20x%3D%22130.5%22%20y%3D%2230%22%3E%3D%3C%2Ftext%3E%3Ctext%20font-family%3D%22Times%20New%20Roman%22%20font-size%3D%2218%22%20text-anchor%3D%22middle%22%20x%3D%22147.5%22%20y%3D%2230%22%3E0%3C%2Ftext%3E%3Ctext%20font-family%3D%22math1c878e24efc05354e08bac6a2b5%22%20font-size%3D%2216%22%20text-anchor%3D%22middle%22%20x%3D%22154.5%22%20y%3D%2230%22%3E.%3C%2Ftext%3E%3Ctext%20font-family%3D%22Times%20New%20Roman%22%20font-size%3D%2218%22%20text-anchor%3D%22middle%22%20x%3D%22166.5%22%20y%3D%2230%22%3E25%3C%2Ftext%3E%3C%2Fsvg%3E)
worst gradient =
format('truetype')%3Bfont-weight%3Anormal%3Bfont-style%3Anormal%3B%7D%3C%2Fstyle%3E%3C%2Fdefs%3E%3Cline%20stroke%3D%22%23000%22%20stroke-linecap%3D%22square%22%20stroke-width%3D%221%22%20x1%3D%222.5%22%20x2%3D%2230.5%22%20y1%3D%2223.5%22%20y2%3D%2223.5%22%2F%3E%3Ctext%20font-family%3D%22math1c878e24efc05354e08bac6a2b5%22%20font-size%3D%2216%22%20text-anchor%3D%22middle%22%20x%3D%2211.5%22%20y%3D%2216%22%3E%26%23x2206%3B%3C%2Ftext%3E%3Ctext%20font-family%3D%22Times%20New%20Roman%22%20font-size%3D%2218%22%20font-style%3D%22italic%22%20text-anchor%3D%22middle%22%20x%3D%2223.5%22%20y%3D%2216%22%3Ey%3C%2Ftext%3E%3Ctext%20font-family%3D%22math1c878e24efc05354e08bac6a2b5%22%20font-size%3D%2216%22%20text-anchor%3D%22middle%22%20x%3D%2211.5%22%20y%3D%2241%22%3E%26%23x2206%3B%3C%2Ftext%3E%3Ctext%20font-family%3D%22Times%20New%20Roman%22%20font-size%3D%2218%22%20font-style%3D%22italic%22%20text-anchor%3D%22middle%22%20x%3D%2223.5%22%20y%3D%2241%22%3Ex%3C%2Ftext%3E%3Ctext%20font-family%3D%22math1c878e24efc05354e08bac6a2b5%22%20font-size%3D%2216%22%20text-anchor%3D%22middle%22%20x%3D%2245.5%22%20y%3D%2230%22%3E%3D%3C%2Ftext%3E%3Cline%20stroke%3D%22%23000%22%20stroke-linecap%3D%22square%22%20stroke-width%3D%221%22%20x1%3D%2260.5%22%20x2%3D%22129.5%22%20y1%3D%2223.5%22%20y2%3D%2223.5%22%2F%3E%3Ctext%20font-family%3D%22Times%20New%20Roman%22%20font-size%3D%2218%22%20text-anchor%3D%22middle%22%20x%3D%2271.5%22%20y%3D%2216%22%3E27%3C%2Ftext%3E%3Ctext%20font-family%3D%22math1c878e24efc05354e08bac6a2b5%22%20font-size%3D%2216%22%20text-anchor%3D%22middle%22%20x%3D%2292.5%22%20y%3D%2216%22%3E%26%23x2212%3B%3C%2Ftext%3E%3Ctext%20font-family%3D%22Times%20New%20Roman%22%20font-size%3D%2218%22%20text-anchor%3D%22middle%22%20x%3D%22109.5%22%20y%3D%2216%22%3E4%3C%2Ftext%3E%3Ctext%20font-family%3D%22math1c878e24efc05354e08bac6a2b5%22%20font-size%3D%2216%22%20text-anchor%3D%22middle%22%20x%3D%22116.5%22%20y%3D%2216%22%3E.%3C%2Ftext%3E%3Ctext%20font-family%3D%22Times%20New%20Roman%22%20font-size%3D%2218%22%20text-anchor%3D%22middle%22%20x%3D%22123.5%22%20y%3D%2216%22%3E7%3C%2Ftext%3E%3Ctext%20font-family%3D%22Times%20New%20Roman%22%20font-size%3D%2218%22%20text-anchor%3D%22middle%22%20x%3D%2278.5%22%20y%3D%2241%22%3E80%3C%2Ftext%3E%3Ctext%20font-family%3D%22math1c878e24efc05354e08bac6a2b5%22%20font-size%3D%2216%22%20text-anchor%3D%22middle%22%20x%3D%2299.5%22%20y%3D%2241%22%3E%26%23x2212%3B%3C%2Ftext%3E%3Ctext%20font-family%3D%22Times%20New%20Roman%22%20font-size%3D%2218%22%20text-anchor%3D%22middle%22%20x%3D%22116.5%22%20y%3D%2241%22%3E0%3C%2Ftext%3E%3Ctext%20font-family%3D%22math1c878e24efc05354e08bac6a2b5%22%20font-size%3D%2216%22%20text-anchor%3D%22middle%22%20x%3D%22144.5%22%20y%3D%2230%22%3E%3D%3C%2Ftext%3E%3Ctext%20font-family%3D%22Times%20New%20Roman%22%20font-size%3D%2218%22%20text-anchor%3D%22middle%22%20x%3D%22161.5%22%20y%3D%2230%22%3E0%3C%2Ftext%3E%3Ctext%20font-family%3D%22math1c878e24efc05354e08bac6a2b5%22%20font-size%3D%2216%22%20text-anchor%3D%22middle%22%20x%3D%22168.5%22%20y%3D%2230%22%3E.%3C%2Ftext%3E%3Ctext%20font-family%3D%22Times%20New%20Roman%22%20font-size%3D%2218%22%20text-anchor%3D%22middle%22%20x%3D%22180.5%22%20y%3D%2230%22%3E28%3C%2Ftext%3E%3C%2Fsvg%3E)
% uncertainty =
format('truetype')%3Bfont-weight%3Anormal%3Bfont-style%3Anormal%3B%7D%3C%2Fstyle%3E%3C%2Fdefs%3E%3Cline%20stroke%3D%22%23000%22%20stroke-linecap%3D%22square%22%20stroke-width%3D%221%22%20x1%3D%222.5%22%20x2%3D%2294.5%22%20y1%3D%2223.5%22%20y2%3D%2223.5%22%2F%3E%3Ctext%20font-family%3D%22Times%20New%20Roman%22%20font-size%3D%2218%22%20text-anchor%3D%22middle%22%20x%3D%228.5%22%20y%3D%2216%22%3E0%3C%2Ftext%3E%3Ctext%20font-family%3D%22math1f57fd4d82586f841b705632d04%22%20font-size%3D%2216%22%20text-anchor%3D%22middle%22%20x%3D%2215.5%22%20y%3D%2216%22%3E.%3C%2Ftext%3E%3Ctext%20font-family%3D%22Times%20New%20Roman%22%20font-size%3D%2218%22%20text-anchor%3D%22middle%22%20x%3D%2227.5%22%20y%3D%2216%22%3E28%3C%2Ftext%3E%3Ctext%20font-family%3D%22math1f57fd4d82586f841b705632d04%22%20font-size%3D%2216%22%20text-anchor%3D%22middle%22%20x%3D%2248.5%22%20y%3D%2216%22%3E%26%23x2212%3B%3C%2Ftext%3E%3Ctext%20font-family%3D%22Times%20New%20Roman%22%20font-size%3D%2218%22%20text-anchor%3D%22middle%22%20x%3D%2265.5%22%20y%3D%2216%22%3E0%3C%2Ftext%3E%3Ctext%20font-family%3D%22math1f57fd4d82586f841b705632d04%22%20font-size%3D%2216%22%20text-anchor%3D%22middle%22%20x%3D%2272.5%22%20y%3D%2216%22%3E.%3C%2Ftext%3E%3Ctext%20font-family%3D%22Times%20New%20Roman%22%20font-size%3D%2218%22%20text-anchor%3D%22middle%22%20x%3D%2284.5%22%20y%3D%2216%22%3E25%3C%2Ftext%3E%3Ctext%20font-family%3D%22Times%20New%20Roman%22%20font-size%3D%2218%22%20text-anchor%3D%22middle%22%20x%3D%2237.5%22%20y%3D%2241%22%3E0%3C%2Ftext%3E%3Ctext%20font-family%3D%22math1f57fd4d82586f841b705632d04%22%20font-size%3D%2216%22%20text-anchor%3D%22middle%22%20x%3D%2244.5%22%20y%3D%2241%22%3E.%3C%2Ftext%3E%3Ctext%20font-family%3D%22Times%20New%20Roman%22%20font-size%3D%2218%22%20text-anchor%3D%22middle%22%20x%3D%2256.5%22%20y%3D%2241%22%3E25%3C%2Ftext%3E%3Ctext%20font-family%3D%22math1f57fd4d82586f841b705632d04%22%20font-size%3D%2216%22%20text-anchor%3D%22middle%22%20x%3D%22105.5%22%20y%3D%2230%22%3E%26%23xD7%3B%3C%2Ftext%3E%3Ctext%20font-family%3D%22Times%20New%20Roman%22%20font-size%3D%2218%22%20text-anchor%3D%22middle%22%20x%3D%22127.5%22%20y%3D%2230%22%3E100%3C%2Ftext%3E%3Ctext%20font-family%3D%22Times%20New%20Roman%22%20font-size%3D%2218%22%20text-anchor%3D%22middle%22%20x%3D%22149.5%22%20y%3D%2230%22%3E%25%3C%2Ftext%3E%3Ctext%20font-family%3D%22math1f57fd4d82586f841b705632d04%22%20font-size%3D%2216%22%20text-anchor%3D%22middle%22%20x%3D%22170.5%22%20y%3D%2230%22%3E%3D%3C%2Ftext%3E%3Ctext%20font-family%3D%22Times%20New%20Roman%22%20font-size%3D%2218%22%20text-anchor%3D%22middle%22%20x%3D%22192.5%22%20y%3D%2230%22%3E12%3C%2Ftext%3E%3Ctext%20font-family%3D%22Times%20New%20Roman%22%20font-size%3D%2218%22%20text-anchor%3D%22middle%22%20x%3D%22209.5%22%20y%3D%2230%22%3E%25%3C%2Ftext%3E%3C%2Fsvg%3E)
Examiner Tips and Tricks
A common misconception is that error bars need to all be the same size. In physics, this is not the case and each data point can have different error bar sizes as they have different uncertainties.

Unlock more, it's free!
Join the 100,000+ Students that ❤️ Save My Exams
the (exam) results speak for themselves:

Was this revision note helpful?
