11 mark
Figure 1.1 shows data collected at a farm in Finland.
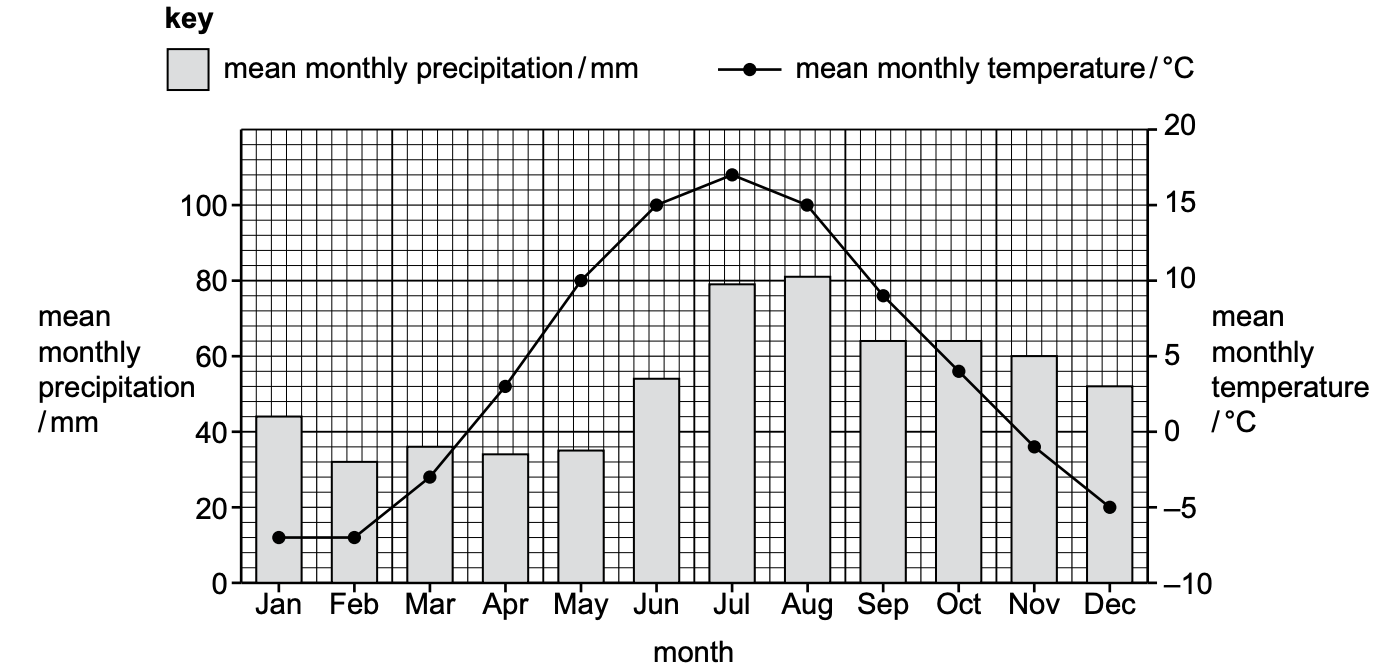
Identify the month with the highest mean monthly precipitation.
Was this exam question helpful?
Exam code: 0680
Figure 1.1 shows data collected at a farm in Finland.
Identify the month with the highest mean monthly precipitation.
Was this exam question helpful?
Figure 1.1 shows data collected at a farm in Finland.
State the number of months with a mean monthly precipitation less than 60 mm.
Was this exam question helpful?
Figure 1.1 shows data collected at a farm in Finland.
Calculate the annual temperature range for this farm.
Was this exam question helpful?
Figure 1.1 shows data collected at a farm in Finland.
Sorghum is a crop plant. Sorghum needs a growing season of four months.
Sorghum seeds need a minimum temperature of 12 °C to start to grow.
Sorghum plants need a minimum temperature of 15 °C to grow into a crop that can be harvested.
Suggest why sorghum is not a suitable crop to grow on the farm in Finland.
Use Figure 1.1 to support your answer.
Was this exam question helpful?
A scientist investigates soils.
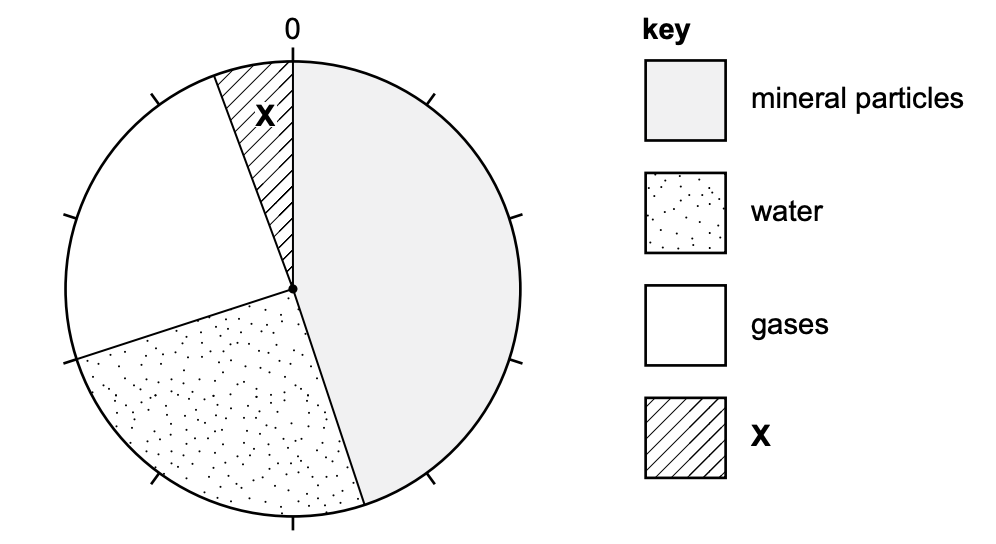
Figure 3.1 shows the composition of a soil.
Identify the component of the soil labelled X.
Was this exam question helpful?
A scientist investigates soils.
Figure 3.1 shows the composition of a soil.
Determine the percentage of the soil that is mineral particles.
Was this exam question helpful?
A scientist investigates soils.
Figure 3.1 shows the composition of a soil.
Calculate the percentage of the soil that is pore space.
Was this exam question helpful?
A scientist investigates soils.
Explain why the gas content of a soil is important for plant growth.
Was this exam question helpful?