Speed-Time Graphs (Cambridge (CIE) IGCSE Co-ordinated Sciences (Double Award): Physics): Revision Note
Exam code: 0654 & 0973

Speed-time graphs
A speed-time graph is used to describe the speed of an object and calculate its acceleration
Constant acceleration on a speed-time graph
If an object is moving at a constant acceleration, the speed-time graph will be a straight line
If the constant acceleration is zero, the line will be horizontal
If the constant acceleration is non-zero, the line will have a gradient
If an object has an acceleration of zero, the object is travelling at a constant velocity
Its velocity is not changing over time
If the constant speed is zero, then the object is stationary
Motion on a speed-time graph

This image shows how to interpret the slope of a speed-time graph
The gradient of a speed-time graph represents the object's acceleration
A steeper slope, or a higher gradient, represents a greater acceleration
A shallower slope, or a lower gradient, represents a slower acceleration
If the gradient is positive, the line slopes upward
A positive gradient represents an increasing speed, or acceleration
If the gradient is negative, the line slopes downward
A negative gradient represents a decreasing speed, or deceleration
Speeding up and slowing down on a speed-time graph
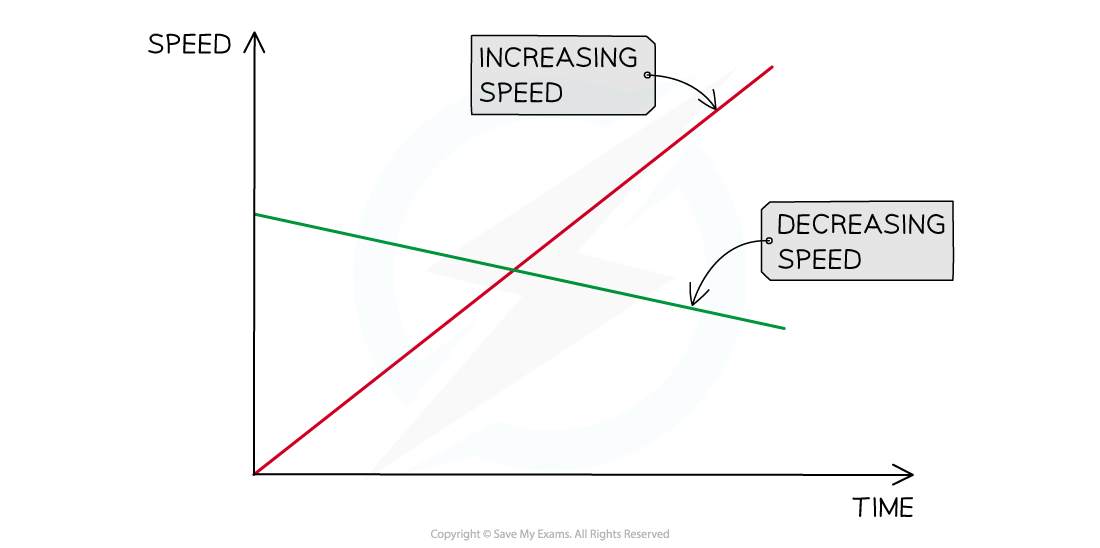
Both of these objects are moving at a constant acceleration, because the lines are straight. The positive gradient represents an increasing speed or positive acceleration. The negative gradient represents a decreasing speed or negative acceleration.
Examiner Tips and Tricks
For CIE IGCSE Physics, you may be asked plot a graph of your own, or to interpret information given to you in a graph. You can read more about graph skills in the article Graph skills in GCSE Physics
Calculating distance from speed-time graphs
Speed-time graphs can also be used to determine the distance travelled by an object
The area under a speed-time graph
The area under a speed-time graph represents the distance travelled

The area under a speed-time graph represents the distance travelled
If the area of a section of the speed-time graph forms a triangle, the area can be calculated using:
If the area of a section of the speed-time graph forms a rectangle, the area can be determined using:
Where:
= area of a triangle
= area of a rectangle
= base
= height
The total distance travelled can be determined by finding the total area under the speed-time graph
The distance travelled for part of the journey can be determined by finding the area under the graph for a specific time interval
Area under a speed-time graph split into sections
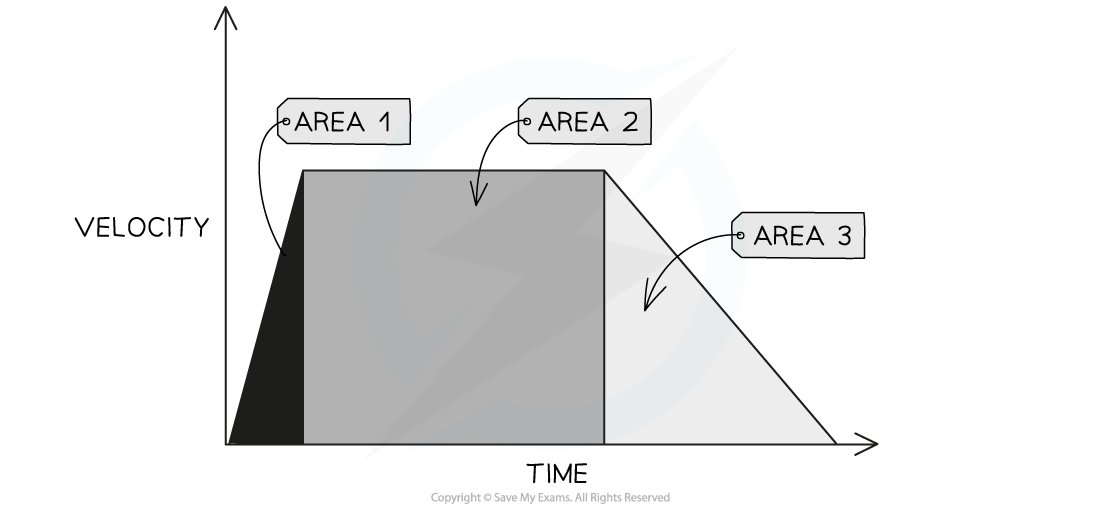
The area under a speed-time graph can split into triangular and rectangular sections
Worked Example
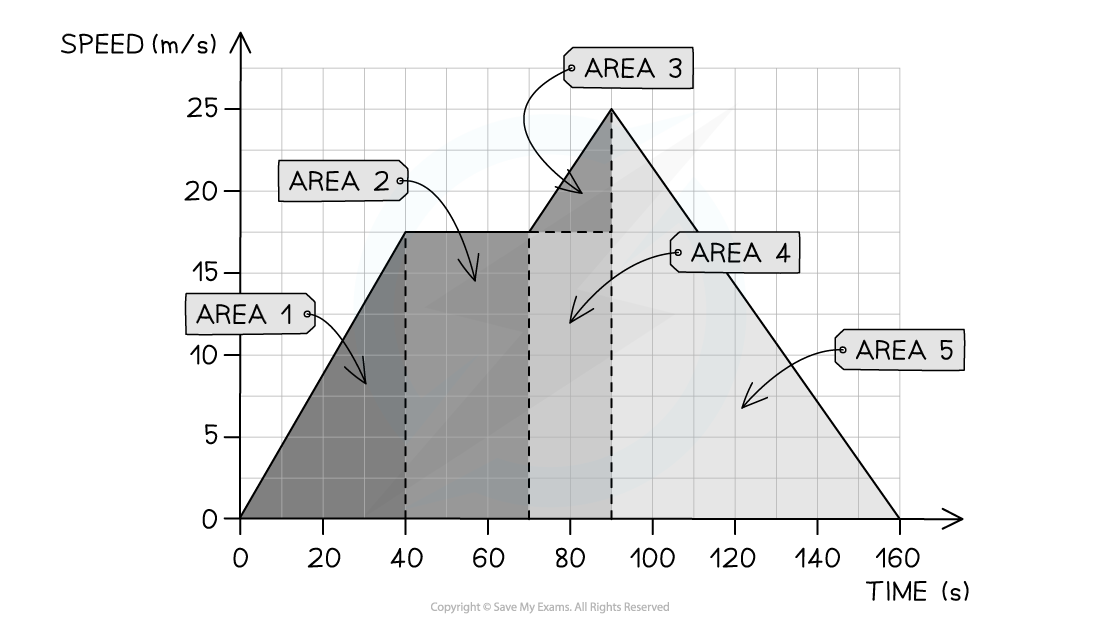
The speed-time graph below shows a car journey that lasts for 160 seconds.

Calculate the total distance travelled by the car on this journey.
Answer:
Step 1: Recall that the area under a velocity-time graph represents the distance travelled
In order to calculate the total distance travelled, the total area underneath the line must be determined
Step 2: Identify each enclosed area
In this example, there are five enclosed areas under the line
These can be labelled as areas 1, 2, 3, 4 and 5, as shown in the image below:
Step 3: Calculate the area of each enclosed shape under the line
Area 1 = area of a triangle
Area 2 = area of a rectangle
Area 3 = area of a triangle
Area 4 = area of a rectangle
Area 5 = area of a triangle
Step 4: Calculate the total distance travelled by finding the total area under the line
Add up each of the five areas enclosed:
Examiner Tips and Tricks
Some areas will need to be split into a triangle and a rectangle to determine the area for a specific time interval, like areas 3 & 4 in the worked example above.
If you are asked to find the distance travelled for a specific time interval, then you just need to find the area of the section above that time interval.
For example, the distance travelled between 70 s and 90 s is the sum of Area 3 + Area 4

Unlock more, it's free!
Join the 100,000+ Students that ❤️ Save My Exams
the (exam) results speak for themselves:

Was this revision note helpful?
Build on this topic