Inequality in Education UK Statistics 2026: Insights from 1,000+ UK Students

Written by: Victoria Burton
Reviewed by: Holly Barrow
Published
Contents
Understanding Inequality in Education in the UK
Not every student has the same opportunities to succeed in education. Family income, where they live and the school they attend can all affect their access to learning resources, extra support and a suitable place to study. These differences can also affect exam results and future opportunities.
Educational inequality refers to differences in access to education and academic outcomes. One way to measure it is through the attainment gap – the difference in achievement between disadvantaged pupils and their peers.
In England, the Department for Education's attainment measures generally define disadvantaged pupils as those who have been eligible for free school meals in the previous six years, or who have been looked after or adopted from care.
To explore these inequalities, Save My Exams surveyed 1,101 UK students about their experiences of studying, access to resources and the financial pressures affecting their education. We've combined their responses with published research and official statistics to build a picture of educational inequality across the UK in 2026.
Key Takeaways
65.1% of students surveyed agreed that money affects their educational choices.
67.0% of students reported that responsibilities outside school reduced their study time at least a few times a week.
22.3% of students wanted private tutoring but had never received it.
66.0% of students used free AI tools for studying at least a few times a week.
34.0% of students who had ever been eligible for free school meals (FSM) identified the cost of learning resources as a barrier, compared with 14.4% who had never been eligible.
66.0% of never-tutored students with a history of FSM eligibility cited cost as a reason for not receiving tutoring, compared with 40.1% of those never eligible.
26.5% of pupils in England were eligible for free school meals in January 2026 (Department for Education, 2026).
The disadvantage gap at GCSE in England was equivalent to 19 months of learning in 2025 (Education Policy Institute, 2026).
48.7% of school leavers entitled to FSM in Northern Ireland achieved at least five GCSEs at grades A*–C, including English and maths, in 2024/25, compared with 77.9% of other school leavers (Department of Education NI, 2026).
Only 9% of teachers surveyed by the Digital Poverty Alliance believed pupils could complete all coursework using a smartphone alone (Digital Poverty Alliance, 2026).
Inequality in Education: What UK Students Told Us (Primary Data)
Save My Exams analysed responses from 1,101 UK-based students to understand how access to resources, private tutoring and financial pressures affect their experiences of education.
The findings reflect the experiences of those surveyed, rather than all UK students, and do not measure differences in exam results.
Study resources and the digital divide at home
Having your own computer, reliable internet and somewhere quiet to revise can make studying easier. But not every student has the same access to these essentials.
Our survey found that students who had ever been eligible for free school meals (FSM) were less likely to have access to most study resources than those who had never been eligible.
Study resource | Ever eligible for FSM | Never eligible for FSM |
Own laptop or computer | 69.6% | 87.0% |
Paid revision or learning platform | 52.9% | 72.2% |
Printer | 52.9% | 70.3% |
Up-to-date textbooks or revision guides | 62.3% | 76.8% |
Reliable internet or broadband | 77.0% | 87.9% |
Quiet place to study | 70.7% | 79.0% |
Shared laptop or computer | 27.7% | 20.6% |
The largest gap was in access to paid revision or learning platforms: 52.9% of students with a history of FSM eligibility had access, compared with 72.2% of those never eligible – a difference of 19.3 percentage points. Gaps were also evident in access to personal computers and printers.
Across the survey, 45 students reported having neither their own nor a shared laptop or computer.
Private tutoring: who gets it, who misses out and why
Private tutoring can be a brilliant way to help students build confidence, tackle tough subjects and get ready for exams. But what happens when students want that extra support and can't afford it?
Our survey found that more than half of students had received private tutoring, either currently (29.4%) or in the past (27.7%). However, 22.3% wanted tutoring but had never received it, while 20.6% had never been tutored and didn't want it.
Cost was the biggest barrier for students who wanted tutoring but hadn't received it. Among these 245 students, 65.7% said it was too expensive.
Across all 472 students who had never received private tutoring, the most commonly reported reasons were:
44.1% said it was too expensive.
23.1% said they didn't need it.
18.9% preferred to study independently.
Cost was more frequently cited by students with a history of free school meal eligibility. Among students who had never received tutoring, 66.0% of those who had ever been eligible for FSM said it was too expensive, compared with 40.1% of those who had never been eligible.
These findings highlight differences in access to private tutoring, particularly for students who want additional support but cannot afford it.
The cost of studying: money, time and responsibilities
Finding time to study isn't always straightforward, particularly when money worries and responsibilities outside school compete with revision.
Our survey revealed how these pressures affect students:
65.1% agreed that money affected their educational choices.
67.0% said responsibilities outside school reduced their study time at least a few times a week.
20.8% said these responsibilities reduced their study time every day.
For students with a history of free school meal eligibility, the impact was greater. Almost three in ten (29.8%) said responsibilities outside school reduced their study time every day, compared with 18.2% of students who had never been eligible.
For some students, the challenge isn't just finding the right resources to revise. It's finding the time to use them.
Free AI tools and the new divide in study support
Free AI tools are becoming a regular part of students' revision routines. Many use them because they're convenient, but others say they turn to AI because they can't afford paid study resources or private tutoring.
Our survey found that 66% of students used free AI tools for studying at least a few times a week, including 30.8% who used them daily or almost daily.
Students gave different reasons for choosing free AI tools:
42.3% gave convenience as their main reason.
26.2% selected using AI alongside paid resources or tutoring.
9.6% said they couldn't afford paid study support.
For disadvantaged students, affordability was an even bigger factor. Almost one in five (19.4%) respondents with a history of free school meal eligibility gave cost as their main reason, compared with 7.6% of their peers.
While some students use AI as an additional study resource, others report choosing free tools because paid support is out of reach.
Note: Percentages for reasons for choosing free AI tools are based on all 1,101 survey respondents, including those who rarely or never use AI.
Barriers to studying and university expectations
Not every student has the same opportunities or support to do their best at school. For those who can't afford extra help outside the classroom, challenges such as large classes or limited teacher time can be even harder to overcome.
Our survey found that 83.2% of students with a history of free school meal eligibility expected to go to university, compared with 87.3% of those who had never been eligible. Overall, 60.9% of students definitely expected to go to university, while another 25.3% said they probably would.
Students identified several barriers to doing their best at school:
39.0% said they didn't get enough one-to-one time with teachers.
26.4% reported large class sizes.
21.6% lacked a quiet place to study.
20.8% said their school didn't offer the subjects they wanted.
17.8% reported the cost of learning resources as a barrier.
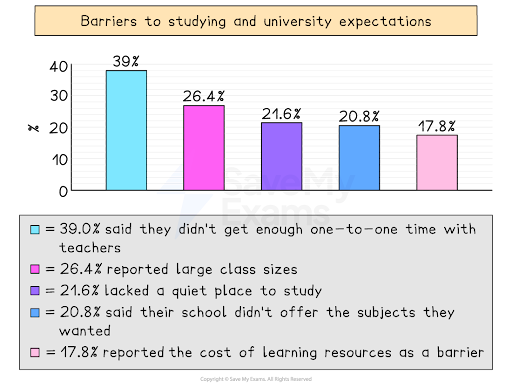
The cost of learning resources was a barrier for 34.0% of students with a history of FSM eligibility, compared with 14.4% of those who had never been eligible.
Students with a history of FSM eligibility were also less likely to rate their careers, university and apprenticeship advice positively (55.5% vs 61.7%). Across the survey, 8.4% had received no advice at all.
Students' experiences of careers, university and apprenticeship advice also varied by school type. Among those attending independent or private schools, 67.5% rated the advice they received as good or very good, compared with 53.7% at academies or free schools and 53.6% at state comprehensives.
Around one in ten academy or free-school students (10.6%) reported receiving no advice at all, compared with 4.3% of sixth-form or college students.
Regional differences were also apparent. In the South East, 66.2% rated their advice positively, compared with 57.8% in London. These figures reflect the experiences of students surveyed, rather than representative assessments of guidance provision across schools or regions.
How inequality in education differs by region, school type and gender
Fair and equal access to education is about more than household income. Where students live, their gender, the type of school they attend and their stage of education can all play a part in shaping their experiences and opportunities.
Our survey highlighted some key differences:
75.6% of grammar-school students had received private tutoring, compared with 46.7% of academy/free-school students.
32.2% of academy/free-school students wanted tutoring but had never received it, compared with 10.9% of grammar-school students.
93.2% of independent-school students had their own laptop or computer, compared with 78.0% of academy/free-school students.
68.0% of students surveyed in London had received private tutoring, compared with 45.7% in the South West.
23.2% of female students reported not having a quiet place to study, compared with 16.5% of male students.
72.6% of A Level students said money affected their educational choices, compared with 61.6% of GCSE students.
Education Inequality UK Statistics (Secondary Data)
What is the attainment gap?
The attainment gap is the difference in academic achievement between disadvantaged pupils and their peers. Research shows that this gap widens as children progress through school and is reflected in GCSE results and later educational outcomes.
According to the Education Policy Institute (2026), the disadvantage gap in England in 2025 was equivalent to:
4.9 months of learning by the end of reception.
10 months of learning by the end of primary school (Key Stage 2).
19 months of learning by GCSE (Key Stage 4).
The scale of this widening gap is clear in GCSE attainment figures. In 2025/26, just 27.5% of disadvantaged pupils in England achieved grade 5 or above in both English and maths, compared with 54.3% of their peers (Department for Education, 2026).
Free school meals and disadvantaged pupils
Free school meals (FSM) eligibility is one indicator of educational disadvantage, although not every child living in poverty qualifies for them.
The latest figures show how many pupils are eligible for or registered for free school meals across the UK:
England: More than 2.2 million pupils (26.5%) were eligible in January 2026 (Department for Education, 2026).
Scotland: 364,760 pupils (52.4%) were registered in 2025, including children covered by universal primary school meal provision (Scottish Government, 2025).
Wales: 83,699 pupils (18.4%) were eligible in 2025/26, rising to 108,495 (23.9%) when pupils with transitional protection are included (StatsWales, 2026).
Northern Ireland: Approximately 90,900 pupils (25.9%) were entitled to free school meals in 2025/26 (NISRA, 2026).
Eligibility rules are different across the nations of the UK, so percentages are not directly comparable.
Beyond free school meals, the latest UK child poverty figures show that 4 million children (27% of all children) were living in relative poverty after housing costs in 2024/25 (Department for Work and Pensions, 2026).
Inequality in education by ethnicity
GCSE results by ethnicity vary considerably in England. We can see these differences in Attainment 8 scores, which measure a pupil's achievement by adding together points from eight qualifications, including English and maths.
In 2025/26, average Attainment 8 scores in England were:
Chinese pupils: 66.4
Indian pupils: 59.6
Bangladeshi pupils: 51.8
African pupils: 48.3
White British pupils: 44.4
Caribbean pupils: 39.1
Irish Traveller pupils: 29.7
Gypsy pupils: 20.5
The average across all pupils in England was 46.2 (Department for Education, 2026).
There are also wide differences in how often pupils are suspended or permanently excluded from school.
In 2024/25, suspension rates per 100 pupils in England were:
Gypsy/Roma pupils: 40.32
Traveller of Irish heritage pupils: 30.72
White and Black Caribbean pupils: 19.86
Caribbean pupils: 14.21
Indian pupils: 1.31
Chinese pupils: 1.10
The average across all pupils in England was 10.88 suspensions per 100 pupils.
Permanent exclusion rates also varied considerably. Per 100 pupils, the figures included:
Traveller of Irish heritage pupils: 0.490
Gypsy/Roma pupils: 0.455
White and Black Caribbean pupils: 0.264
Caribbean pupils: 0.215
Indian pupils: 0.013
Chinese pupils: 0.008
The England average was 0.118 permanent exclusions per 100 pupils (Department for Education, 2026).
Note: Suspension rates count incidents rather than individual pupils, so pupils suspended more than once are counted multiple times.
SEND attainment gaps
Pupils with special educational needs and disabilities (SEND) experience some of the largest attainment gaps in England's education system. In 2025, pupils with an education, health and care plan (EHCP) were an estimated 38.9 months behind pupils without identified SEND by the end of Key Stage 4. For pupils receiving SEN support without an EHCP, the gap was 21.1 months (Education Policy Institute, 2026).
Both gaps have narrowed since 2019.
Gender inequality in education statistics UK
Gender differences in education are not just about exam results. They can also be seen in the subjects students choose, the qualifications they take and their progression to university.
GCSE and A Level results
The gender gap in GCSE attainment is narrowing, while boys now have a small lead in the highest A Level grades.
In England, the gap between girls and boys achieving grade 5 or above in both GCSE English and maths fell from 6.6 percentage points in 2019 to 3.1 percentage points in 2025/26 (Department for Education, 2026).
The difference in average GCSE Attainment 8 scores was 3.9 points in favour of girls in 2025/26 (Department for Education, 2026).
In 2026, 28.9% of male A Level entries achieved A*–A grades, compared with 28.0% of female entries (JCQ, 2026).
In 2019, the figures were almost identical, at 25.4% for males and 25.5% for females (JCQ, 2019).
Gender differences in STEM subjects
Girls and boys continue to make different A Level subject choices, particularly in science, technology, engineering and maths (STEM).
In 2026, female students accounted for:
18.9% of A Level computing entries.
23.7% of physics entries.
37.1% of mathematics entries.
56.6% of chemistry entries.
65.0% of biology entries (JCQ, 2026).
These figures show that female participation varies considerably across STEM subjects, rather than following a single pattern.
Gender differences in technical education
Gender differences are also evident in T Level qualifications, which offer a technical alternative to A Levels.
In England in 2025/26:
Female students accounted for 95.6% of Education and Early Years T Level results.
Female students accounted for 91.4% of Health T Level results.
Male students accounted for 97.5% of Building Services Engineering T Level results.
Male students accounted for 94.4% of Onsite Construction T Level results (Department for Education, 2026).
University entry by gender
Women are more likely than men to enter higher education at age 18.
In 2025, 41.4% of UK 18-year-old women entered higher education, compared with 30.4% of men. This represents a gap of 11 percentage points (UCAS, 2025).
Regional inequality in education across the UK
Where pupils live can make a substantial difference to their educational attainment and opportunities after school. However, the latest figures show that educational disadvantage does not follow a simple North–South divide.
Regional attainment gaps in England
In 2025/26, the proportion of disadvantaged pupils achieving grade 5 or above in both GCSE English and maths varied considerably between regions:
London: 39.7% of disadvantaged pupils, compared with 62.9% of their peers — a 23.2-percentage-point gap.
West Midlands: 27.4%, compared with 50.7% — a 23.3-point gap.
North East: 26.4%, compared with 53.9% — a 27.5-point gap.
South West: 23.2%, compared with 53.3% — a 30.1-point gap.
South East: 22.9%, compared with 55.9% — a 33-point gap.
Among these five regions, London had the smallest disadvantage gap, while the South East had the largest. Despite lower overall GCSE attainment in the North East, its disadvantage gap was smaller than those in the South East and South West (Department for Education, 2026).
Regional differences in progression after school
Geographical inequality continues beyond GCSEs.
In 2024/25, 83.2% of disadvantaged pupils in England sustained an education, apprenticeship or employment destination after GCSEs, compared with 94.1% of other pupils (Department for Education, 2026).
London had the highest regional rate of sustained destinations after GCSEs, while the North East had the lowest.
Among pupils eligible for free school meals, 50.8% in Inner London entered higher education by age 19, compared with just 18.4% in the South West.
The South West also had the lowest overall higher education participation rate by age 19, at 38.2%, compared with 60.3% in London (Department for Education, 2026).
Pupil premium funding in England
In England, pupil premium funding provides additional support to state-funded schools to improve outcomes for disadvantaged pupils. In 2026/27, approximately £3.2 billion was allocated through the scheme, supporting around 2.3 million eligible pupils.
Schools receive £1,550 per eligible primary-aged pupil and £1,100 per eligible secondary-aged pupil under the deprivation element of the scheme (House of Commons Library, 2026; Department for Education, 2026).
Scotland
Scotland's poverty-related attainment gap has narrowed in literacy and numeracy, although inequalities remain.
In 2024/25, the gaps between pupils in the most and least deprived areas were:
Primary literacy: 19.4 percentage points, down from 20.2 in 2023/24.
Primary numeracy: 16.6 points, down from 17.4.
S3 literacy: 10.8 points, down from 12.7.
S3 numeracy: 11.6 points, down from 12.0.
These were the narrowest gaps recorded since the measures began. However, the Scottish Government's 2026 evaluation of the Scottish Attainment Challenge found mixed progress, with some school-leaver qualification gaps widening despite improvements in literacy and numeracy (Scottish Government, 2026).
Wales
In Wales in 2024/25, pupils eligible for means-tested free school meals averaged 300.8 points on the Capped 9 GCSE attainment measure, compared with 379.4 for other pupils — a gap of 78.6 points (Welsh Government, 2025).
Inequalities also affect progression beyond school. In 2023/24, just 18.9% of young people from Wales's most deprived areas entered higher education, compared with 26% across the UK for the equivalent deprivation group (Senedd, 2025).
Among Year 11 school leavers in Wales in 2025, 93.9% continued in education or work-based training (Careers Wales, 2026).
Northern Ireland
In Northern Ireland in 2024/25, educational outcomes differed substantially by free school meal entitlement:
48.7% of FSM-entitled school leavers achieved at least five GCSEs at grades A*–C, including English and maths, compared with 77.9% of other leavers.
20.1% of FSM-entitled school leavers progressed to higher education, compared with 45.5% of other leavers.
61.1% of FSM-entitled school leavers progressed to further or higher education, compared with 75.1% of other leavers (Department of Education Northern Ireland, 2026).
The digital divide in education
Digital inequality is about more than owning a device. Having reliable internet access, a suitable computer and the resources needed to study at home can all affect pupils' opportunities to learn.
Access to devices and broadband
In a 2026 survey of 1,036 UK parents, 15% reported having neither a laptop nor a desktop computer at home (Digital Poverty Alliance, 2026).
Children had their own laptop or desktop computer in 29% of families reporting free school meal eligibility in the previous two years, compared with 36% of families overall (Digital Poverty Alliance, 2026).
Research published by the Good Things Foundation found that 15% of young people aged 8–25 lacked home broadband, rising to 23% among those receiving free school meals (Good Things Foundation, 2024).
Among 209 teachers surveyed in 2026, 30% reported teaching at least ten pupils without a suitable device and/or home internet access. Just 9% believed a smartphone alone was sufficient for all coursework (Digital Poverty Alliance, 2026).
The impact on educational attainment
Research suggests that unequal digital access can reinforce existing educational disadvantage, particularly for pupils from lower-income households.
Broadband and attainment: A 2025 study using pupil-level data from England found that faster home broadband improved test scores. However, the benefits were concentrated among higher-attaining pupils and those not eligible for free school meals (Sanchis-Guarner, Montalbán and Weinhardt, 2025).
Digital access during the pandemic: 25% of pupils in England's most deprived schools had poor access to digital devices at home, compared with 15% in the least deprived schools (Ofqual, 2021).
Post-pandemic learning loss: Disadvantaged pupils experienced greater learning losses during the pandemic. Limited access to technology was one of several barriers to remote learning, although it was not the sole cause (Ofqual, 2021).
These findings suggest that improving digital access is important, but access alone may not be enough to close existing attainment gaps.
Closing the attainment gap: what the evidence shows
Interventions that work
The evidence suggests that the right teaching and support can make a real difference to disadvantaged pupils. The Education Endowment Foundation (EEF) identifies several approaches that can help pupils make additional progress.
Which interventions have the greatest impact?
According to the EEF Teaching and Learning Toolkit, pupils make the following additional progress on average (Education Endowment Foundation, 2026):
Intervention | Additional progress |
Metacognition and self-regulation | +8 months |
Feedback | +6 months |
Peer tutoring | +6 months |
One-to-one tuition | +5 months |
Small-group tuition | +4 months |
These figures are averages across research studies, not guaranteed outcomes. How well these approaches work also depends on how they're put into practice.
The National Tutoring Programme: participation and costs
England's National Tutoring Programme (NTP) provided additional academic support between 2020/21 and 2023/24.
In its final year:
1.07 million pupils received tutoring.
1.50 million tutoring courses were delivered, totalling approximately 16.4 million hours.
59.4% of schools participated, down from 73.8% in 2022/23.
45.2% of pupils receiving tutoring were known to have been eligible for free school meals in the previous six years (Department for Education, 2024).
But funding made it difficult for some schools to take part:
The government subsidy covered up to 50% of tuition costs in 2023/24, leaving schools to fund the remainder.
Among surveyed school leaders who had never participated, 47% cited insufficient funding to cover their contribution, while 32% said their funding allocation was too small (Department for Education/NFER, 2024).
Did the National Tutoring Programme improve attainment?
An independent evaluation of the programme's third year (2022/23) found:
Small improvements in Key Stage 2 attainment, generally equivalent to one month of additional progress or less.
The evidence of improvement at Key Stage 4 was less clear.
Smaller measured effects than the average gains reported in the EEF's wider research on tutoring (Department for Education/NFER, 2024).
The evidence is encouraging, but it also shows that what works in research doesn't always produce the same results in schools. How support is delivered, and whether it meets pupils' needs, matters.
Appendix: Full List of Statistics
The following statistics are drawn from Save My Exams' October 2026 survey of 1,101 UK-based students and published research on educational inequality. Survey findings describe the respondents rather than representing all UK students. Percentages are rounded to one decimal place where appropriate.
Among students who had ever been eligible for free school meals (FSM), 69.6% had their own laptop or computer, compared with 87.0% of those who had never been eligible.
Access to paid revision or learning platforms was 52.9% among ever-FSM students, compared with 72.2% among never-FSM students — a gap of 19.3 percentage points.
Printer access was 52.9% among ever-FSM students and 70.3% among never-FSM students.
Access to up-to-date textbooks or revision guides was 62.3% among ever-FSM students and 76.8% among never-FSM students.
Reliable internet or broadband access was reported by 77.0% of ever-FSM students and 87.9% of never-FSM students.
A quiet place to study was available to 70.7% of ever-FSM students, compared with 79.0% of never-FSM students.
Access to a shared laptop or computer was reported by 27.7% of ever-FSM students and 20.6% of never-FSM students.
Across the full survey, 45 students reported having neither their own nor a shared laptop or computer.
29.4% of surveyed students were currently receiving private tutoring.
27.7% had received private tutoring in the past.
22.3% wanted private tutoring but had never received it (245 students).
20.6% had never received private tutoring and did not want it.
Among the 245 students who wanted tutoring but had never received it, 65.7% said it was too expensive.
Among all 472 students who had never received private tutoring, 44.1% cited cost as the main reason.
Among never-tutored students, 23.1% said they did not need tutoring.
Among never-tutored students, 18.9% preferred to study independently.
Among never-tutored students with a history of FSM eligibility, 66.0% cited cost as a reason for not receiving tutoring, compared with 40.1% of never-FSM students.
65.1% of surveyed students agreed that money affected their educational choices.
67.0% said responsibilities outside school reduced their study time at least a few times a week.
20.8% said outside responsibilities reduced their study time every day.
Daily disruption to study time was reported by 29.8% of ever-FSM students, compared with 18.2% of never-FSM students.
66.0% of students used free AI tools for studying at least a few times a week.
30.8% used free AI tools daily or almost daily.
42.3% selected convenience or speed as their main reason for choosing free AI tools.
26.2% selected using AI alongside paid revision resources or tutoring.
9.6% selected being unable to afford paid resources or tutoring as their main reason for choosing free AI tools.
Affordability was selected as the main reason for choosing free AI tools by 19.4% of ever-FSM students, compared with 7.6% of never-FSM students.
83.2% of ever-FSM students expected to attend university, compared with 87.3% of never-FSM students.
Across the survey, 60.9% definitely expected to attend university.
A further 25.3% probably expected to attend university.
39.0% reported insufficient one-to-one time with teachers as a barrier to doing their best at school.
26.4% identified large class sizes as a barrier.
21.6% identified the lack of a quiet place to study as a barrier.
20.8% reported that their school did not offer the subjects they wanted.
17.8% identified the cost of learning resources as a barrier.
The cost of learning resources was identified as a barrier by 34.0% of ever-FSM students, compared with 14.4% of never-FSM students.
55.5% of ever-FSM students rated their careers, university and apprenticeship advice positively, compared with 61.7% of never-FSM students.
8.4% of students reported receiving no careers, university or apprenticeship advice.
Positive ratings of careers advice were reported by 67.5% of independent-school students, 53.7% of academy/free-school students and 53.6% of state-comprehensive students.
No careers advice was reported by 10.6% of academy/free-school students, compared with 4.3% of sixth-form or college students.
Positive ratings of careers advice were reported by 66.2% of students surveyed in the South East, compared with 57.8% in London.
75.6% of grammar-school students had received private tutoring, compared with 46.7% of academy/free-school students.
32.2% of academy/free-school students wanted tutoring but had never received it, compared with 10.9% of grammar-school students.
93.2% of independent-school students had their own laptop or computer, compared with 78.0% of academy/free-school students.
68.0% of surveyed students in London had received private tutoring, compared with 45.7% in the South West.
23.2% of female students reported not having a quiet place to study, compared with 16.5% of male students.
72.6% of A Level students agreed that money affected their educational choices, compared with 61.6% of GCSE students.
In 2025, the disadvantage gap in England was equivalent to 4.9 months of learning by the end of reception (Education Policy Institute, 2026).
By the end of primary school (Key Stage 2), the disadvantage gap was equivalent to 10 months of learning (Education Policy Institute, 2026).
By GCSE (Key Stage 4), the disadvantage gap had widened to 19 months of learning (Education Policy Institute, 2026).
In 2025/26, 27.5% of disadvantaged pupils in England achieved grade 5 or above in both GCSE English and maths, compared with 54.3% of other pupils (Department for Education, 2026).
More than 2.2 million pupils in England, representing 26.5%, were eligible for free school meals in January 2026 (Department for Education, 2026).
In Scotland, 364,760 pupils (52.4%) were registered for free school meals in 2025, including pupils covered by universal primary provision (Scottish Government, 2025).
In Wales in 2025/26, 83,699 pupils (18.4%) were eligible for free school meals, rising to 108,495 (23.9%) when transitional protection was included (StatsWales, 2026).
Approximately 90,900 pupils in Northern Ireland (25.9%) were entitled to free school meals in 2025/26 (NISRA, 2026).
In 2024/25, approximately 4 million UK children (27%) were living in relative poverty after housing costs (Department for Work and Pensions, 2026).
Average Attainment 8 scores in England in 2025/26 were 66.4 for Chinese pupils, 59.6 for Indian pupils, 51.8 for Bangladeshi pupils and 48.3 for African pupils (Department for Education, 2026).
Average Attainment 8 scores were 44.4 for White British pupils, 39.1 for Caribbean pupils, 29.7 for Irish Traveller pupils and 20.5 for Gypsy pupils. The England average was 46.2 (Department for Education, 2026).
In 2024/25, suspension rates per 100 pupils were 40.32 for Gypsy/Roma pupils, 30.72 for Traveller of Irish heritage pupils and 19.86 for White and Black Caribbean pupils (Department for Education, 2026).
Suspension rates per 100 pupils were 14.21 for Caribbean pupils, 1.31 for Indian pupils and 1.10 for Chinese pupils, compared with the England average of 10.88 (Department for Education, 2026).
Permanent exclusion rates per 100 pupils were 0.490 for Traveller of Irish heritage pupils, 0.455 for Gypsy/Roma pupils and 0.264 for White and Black Caribbean pupils (Department for Education, 2026).
Permanent exclusion rates per 100 pupils were 0.215 for Caribbean pupils, 0.013 for Indian pupils and 0.008 for Chinese pupils, compared with an England average of 0.118 (Department for Education, 2026).
In 2025, pupils with an education, health and care plan (EHCP) were an estimated 38.9 months behind pupils without identified SEND by the end of Key Stage 4 (Education Policy Institute, 2026).
Pupils receiving SEN support without an EHCP were an estimated 21.1 months behind pupils without identified SEND (Education Policy Institute, 2026).
The gap between girls and boys achieving grade 5 or above in GCSE English and maths in England fell from 6.6 percentage points in 2019 to 3.1 points in 2025/26 (Department for Education, 2026).
The average Attainment 8 gender gap in England in 2025/26 was 3.9 points in favour of girls (Department for Education, 2026).
In 2026, 28.9% of male A Level entries achieved A*–A grades, compared with 28.0% of female entries (JCQ, 2026).
In 2019, 25.4% of male A Level entries and 25.5% of female entries achieved A*–A grades (JCQ, 2019).
Female students accounted for 18.9% of A Level computing entries and 23.7% of physics entries in 2026 (JCQ, 2026).
Female students accounted for 37.1% of mathematics entries, 56.6% of chemistry entries and 65.0% of biology entries in 2026 (JCQ, 2026).
In England in 2025/26, female students accounted for 95.6% of Education and Early Years T Level results and 91.4% of Health T Level results (Department for Education, 2026).
Male students accounted for 97.5% of Building Services Engineering T Level results and 94.4% of Onsite Construction T Level results (Department for Education, 2026).
In 2025, 41.4% of UK 18-year-old women entered higher education, compared with 30.4% of men — an 11-percentage-point gap (UCAS, 2025).
In London in 2025/26, 39.7% of disadvantaged pupils achieved grade 5 or above in GCSE English and maths, compared with 62.9% of other pupils — a 23.2-percentage-point gap (Department for Education, 2026).
In the West Midlands, the equivalent figures were 27.4% and 50.7%, a gap of 23.3 percentage points (Department for Education, 2026).
In the North East, the figures were 26.4% and 53.9%, a gap of 27.5 percentage points (Department for Education, 2026).
In the South West, the figures were 23.2% and 53.3%, a gap of 30.1 percentage points (Department for Education, 2026).
In the South East, the figures were 22.9% and 55.9%, a gap of 33.0 percentage points (Department for Education, 2026).
In 2024/25, 83.2% of disadvantaged pupils in England sustained an education, apprenticeship or employment destination after GCSEs, compared with 94.1% of other pupils (Department for Education, 2026).
Among FSM-eligible pupils, 50.8% in Inner London entered higher education by age 19, compared with 18.4% in the South West (Department for Education, 2026).
Overall higher education participation by age 19 was 38.2% in the South West, compared with 60.3% in London (Department for Education, 2026).
Approximately £3.2 billion was allocated to England's pupil premium scheme in 2026/27, supporting around 2.3 million eligible pupils (House of Commons Library, 2026; Department for Education, 2026).
Under the deprivation element of pupil premium, schools receive £1,550 per eligible primary-aged pupil and £1,100 per eligible secondary-aged pupil (Department for Education, 2026).
In Scotland in 2024/25, the poverty-related attainment gap in primary literacy was 19.4 percentage points, down from 20.2 in 2023/24 (Scottish Government, 2026).
Scotland's primary numeracy gap was 16.6 percentage points, down from 17.4 (Scottish Government, 2026).
Scotland's S3 literacy gap was 10.8 percentage points, down from 12.7 (Scottish Government, 2026).
Scotland's S3 numeracy gap was 11.6 percentage points, down from 12.0 (Scottish Government, 2026).
In Wales in 2024/25, pupils eligible for means-tested free school meals averaged 300.8 points on the Capped 9 measure, compared with 379.4 for other pupils — a gap of 78.6 points (Welsh Government, 2025).
In 2023/24, 18.9% of young people from Wales's most deprived areas entered higher education, compared with 26% across the UK for the equivalent deprivation group (Senedd, 2025).
In 2025, 93.9% of Year 11 school leavers in Wales continued in education or work-based training (Careers Wales, 2026).
In Northern Ireland in 2024/25, 48.7% of FSM-entitled school leavers achieved at least five GCSEs at grades A*–C, including English and maths, compared with 77.9% of other leavers (Department of Education Northern Ireland, 2026).
In Northern Ireland, 20.1% of FSM-entitled school leavers progressed to higher education, compared with 45.5% of other leavers (Department of Education Northern Ireland, 2026).
Further or higher education destinations were recorded for 61.1% of FSM-entitled school leavers, compared with 75.1% of other leavers (Department of Education Northern Ireland, 2026).
In a 2026 survey of 1,036 UK parents, 15% reported having neither a laptop nor a desktop computer at home (Digital Poverty Alliance, 2026).
Children had their own laptop or desktop computer in 29% of families reporting FSM eligibility in the previous two years, compared with 36% of families overall (Digital Poverty Alliance, 2026).
15% of young people aged 8–25 lacked home broadband, rising to 23% among those receiving free school meals (Good Things Foundation, 2024).
Among 209 teachers surveyed in 2026, 30% reported teaching at least ten pupils without a suitable device and/or home internet access (Digital Poverty Alliance, 2026).
Just 9% of surveyed teachers believed that a smartphone alone was sufficient for all coursework (Digital Poverty Alliance, 2026).
In England, 25% of pupils in the most deprived schools had poor access to digital devices at home during the pandemic, compared with 15% in the least deprived schools (Ofqual, 2021).
The EEF Teaching and Learning Toolkit estimates an average of eight additional months of progress from metacognition and self-regulation approaches (Education Endowment Foundation, 2026).
The EEF estimates six additional months of progress from feedback and six months from peer tutoring (Education Endowment Foundation, 2026).
The EEF estimates five additional months of progress from one-to-one tuition and four months from small-group tuition (Education Endowment Foundation, 2026).
In 2023/24, England's National Tutoring Programme supported approximately 1.07 million pupils through 1.50 million tutoring courses, totalling 16.4 million hours (Department for Education, 2024).
School participation in the National Tutoring Programme fell from 73.8% in 2022/23 to 59.4% in 2023/24. In its final year, 45.2% of tutored pupils were known to have been eligible for FSM in the previous six years (Department for Education, 2024).
In 2023/24, the government subsidy covered up to 50% of tutoring costs. Among surveyed school leaders who had never participated, 47% cited insufficient funding to cover their contribution and 32% said their allocation was too small (Department for Education/NFER, 2024).
References
Primary data
Save My Exams (2026). Education Inequality UK Survey. Original survey data from 1,101 UK-based students, October 2026.
Secondary data
Education Policy Institute (2026). Annual Report on Education in England 2026. (opens in a new tab)
Department for Education (2026). Key stage 4 performance, academic year 2025/26. (opens in a new tab)
Department for Education (2026). School pupils and their characteristics, academic year 2025/26. (opens in a new tab)
Department for Education (2026). Suspensions and permanent exclusions in England, academic year 2024/25. (opens in a new tab)
Department for Education (2026). Key stage 2 attainment. (opens in a new tab)
Department for Education (2026). Pupil premium funding and allocations. (opens in a new tab)
Department for Work and Pensions (2026). Households Below Average Income, 2024/25. (opens in a new tab)
Joint Council for Qualifications (2026). Examination results: A Level results and subject entries. (opens in a new tab)
Joint Council for Qualifications (2019). A Level examination results. (opens in a new tab)
UCAS (2025). Undergraduate end of cycle data resources and entry rates. (opens in a new tab)
Scottish Government (2025). Achievement of Curriculum for Excellence Levels 2024–25. (opens in a new tab)
Welsh Government (2025). Examination results: September 2024 to August 2025. (opens in a new tab)
Department of Education Northern Ireland (2026). Qualifications and destinations of Northern Ireland school leavers, 2024/25. (opens in a new tab)
Digital Poverty Alliance (2026). UK School Census Report: Smartphones Aren't Enough — Every Child Needs a Laptop. (opens in a new tab)
Good Things Foundation (2024). Digital inclusion datasets and evidence. (opens in a new tab)
Education Endowment Foundation (2026). Teaching and Learning Toolkit. (opens in a new tab)
Education Endowment Foundation. One-to-one tuition. (opens in a new tab)
Education Endowment Foundation. Feedback. (opens in a new tab)
Department for Education (2024). National Tutoring Programme statistics, academic year 2023/24. (opens in a new tab)
Department for Education / NFER. National Tutoring Programme evaluation and reflections. (opens in a new tab)
Was this article helpful?
Sign up for articles sent directly to your inbox
Receive news, articles and guides directly from our team of experts.

Share this article

 written revision resources that improve your