Rates of Reaction (Edexcel A Level Chemistry): Revision Note
Exam code: 9CHO

Core Practical 13a: Titrimetric Methods
The reaction between iodine in an acidic solution and propanone is
CH3COCH3 (aq) + I2 (aq) → CH3COCH2I (aq) + H+ (aq) + I- (aq)
We can follow the rate of this reaction by using a continuous monitoring method and therefore we will be able to deduce the order of reaction with respect to a substance using a concentration line graph
We can calculate the order of reaction with respect to iodine as the propanone and acid are in a large excess so their concentrations do not change during the reaction
Once a portion of the reaction mixture has been removed, we stop the reaction by adding sodium hydrogencarbonate
Performing a titration against sodium thiosulfate solution and using starch as an indicator is used to determine the concentration of iodine
2S2O32- (aq) + I2 (aq) → 2I- (aq) + S4O62- (aq)
Steps in the procedure
Mix 25 cm3 of 1.0 mol dm-3 aqueous propanone with 25 cm3 of 1.0 mol dm-3 sulfuric acid in a beaker
Add 50 cm3 of 0.02 mol dm-3 iodine solution
Start the stop clock as soon this is added to the beaker
Using a pipette, withdraw 10 cm3 portion of the reaction mixture and transfer this to a conical flask
Stop this portion of the reaction by adding a spatula of sodium hydrogen carbonate
Titrate this sample against 0.005 mol dm-3 sodium thiosulfate solution using starch as an indicator
Record your result
Withdraw 10 cm3 of the reaction mixture every 3 minutes and repeat the process of stopping the reaction and titrating against the sodium thiosulfate solution
Practical tips
Note the time at which the sodium hydrogencarbonate is added to the withdrawn portions of reaction mixture as this is when the reaction will be stopped and the concentration of iodine can be calculated accurately
Keep the clock running and note the time throughout the practical rather than stopping the clock
Have everything ready and set up before beginning the procedure
Results
Sample Data from the Reaction
Time / min | Titre / cm3 |
|---|---|
3.0 | 37.65 |
6.0 | 35.15 |
9.0 | 32.85 |
12.0 | 30.35 |
15.0 | 28.05 |
Plotting the titre (which is proportional to the concentration of iodine) against time gives a straight line graph
As the gradient is constant, the rate of reaction is constant, and therefore independent of the concentration of the iodine solution
This means the reaction is zero order with respect to the iodine
The rate equation for the reaction is
Rate = k[CH3COCH3 (aq)] [H+ (aq)]
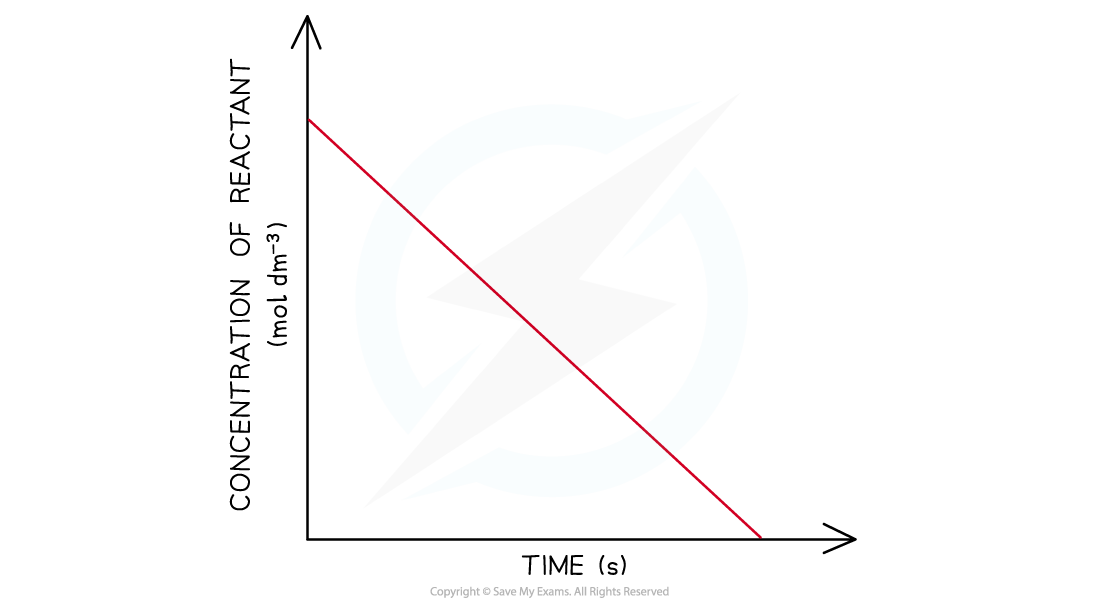
Concentration-time graphs of a zero-order reaction
Core Practical 13b: Investigating a Clock Reaction
Clock reactions are so called because they show a sharp dramatic colour change after a period of time has elapsed
They make ideal reactions for studying kinetics
Iodine clock reactions come in a number of variations, but they generally all use starch to show a sudden blue-black colour at the end of the reaction
A common iodine clock reaction uses the reaction between hydrogen peroxide and iodide ions in acid solution
H2O2 (aq) + 2I- (aq) + 2H+(aq) → I2 (aq) + 2H2O (l)
Adding sodium thiosulfate to the reaction mixture uses up the iodine and acts as the reaction timer
2S2O32- (aq) + I2 (aq) → 2I- (aq) + S4O62- (aq)
The amount of sodium thiosulfate is small compared with the other reagents, so it is used up first
Until then, each iodine molecule produced is immediately reduced back to iodide by the thiosulfate
As soon as all the thiosulfate has been used up, iodine accumulates and the blue-black colour of iodine in starch appears

The iodine clock reaction provides a good way to study reaction kinetics
Steps in the procedure
The solutions are measured in burettes and placed in a small beaker
The sulfuric acid is in excess so can be measured in a measuring cylinder rather than burette
The reaction is started by adding 1cm3 of 0.25 mol dm-3 hydrogen peroxide and starting a timer
The timer is stopped when the blue black colour appears
Suitable volume compositions to use could be as follows:
Iodine Clock Volume Compositions Table
Run | 0.01 mol dm-3 Na2S2O3 (aq) cm3 | H2O cm3 | 0.5 mol dm-3 KI (aq) cm3 | 0.5 mol dm-3 H2SO4 (aq) cm3 | Starch solution cm3 |
|---|---|---|---|---|---|
1 | 1 | 4 | 1 | 25 | 1 |
2 | 1 | 3 | 2 | 25 | 1 |
3 | 1 | 2 | 3 | 25 | 1 |
4 | 1 | 1 | 4 | 25 | 1 |
5 | 1 | 0 | 5 | 25 | 1 |
Practical tips
Hydrogen peroxide is typically found in 'volume' concentrations, based on the volume of oxygen given off when it decomposes:
2H2O2 (aq) → O2 (g) + 2H2O (l)
For example in school laboratories, a suitable concentration of hydrogen peroxide may be listed as 3% or '10 vol'
'10 vol' means that when 1cm3 of hydrogen peroxide decomposes it generates 10 cm3 of oxygen
'10 vol' or 3% hydrogen peroxide has a concentration of about 0.88 mol dm-3
Specimen Results
Here is a set of typical results for the iodine clock reaction
Specimen Results for the Iodine Clock Reaction Table
Concentration of potassium iodide mol dm-3 x 10⁻² | Time for blue colour to appear s | Rate, 1/t s-1 |
|---|---|---|
1.515 | 40 | 0.025 |
3.030 | 20 | 0.050 |
4.545 | 13 | 0.077 |
6.060 | 10 | 0.100 |
7.576 | 8 | 0.125 |
Analysis
The time of reaction is converted to rate of reaction by calculating the reciprocal value
A graph is plotted of rate versus concentration

A rate- concentration graph for the iodine clock reaction
From this graph we can see that the rate of reaction is directly proportional to the concentration of potassium iodide:
As concentration doubles; the rate of reaction also doubles
This tells us that the reaction is first order with respect to potassium iodide

Unlock more, it's free!
Join the 100,000+ Students that ❤️ Save My Exams
the (exam) results speak for themselves:

Was this revision note helpful?
Build on this topic