Reaction Order Graphs (Edexcel A Level Chemistry): Revision Note
Exam code: 9CHO

Reaction Order Graphs
Reaction Order Using Concentration-Time Graphs
In a zero-order reaction, the concentration of the reactant decreases at a constant rate, so it is a linear function of time
This means that the reactant concentration decreases as time increases
The graph is a straight line going down as shown:
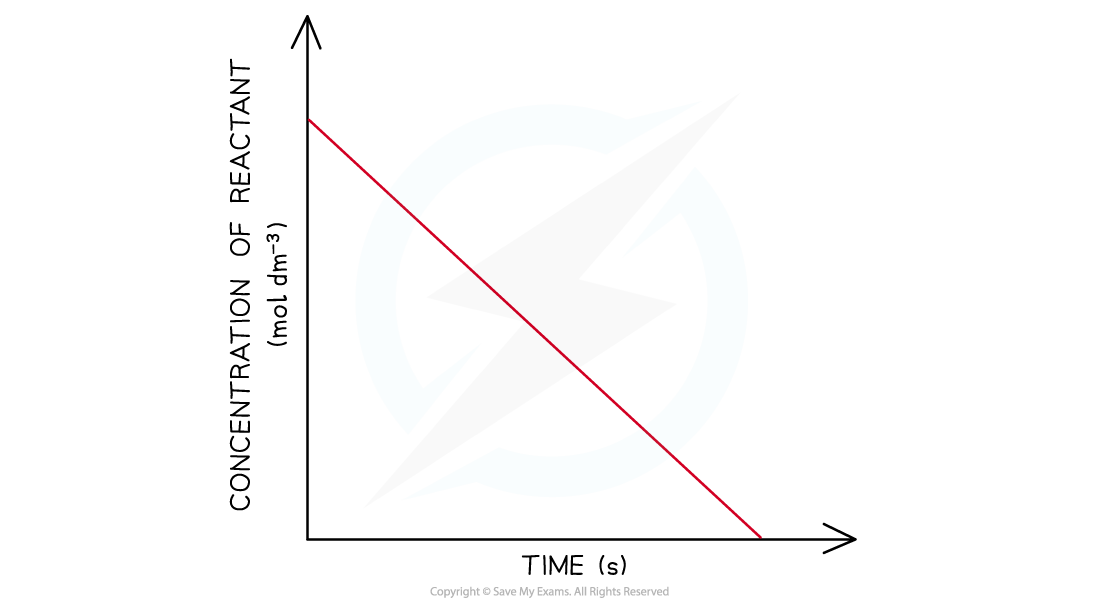
Concentration-time graph of a zero-order reaction
The gradient of the line is the rate of reaction
Calculating the gradient at different points on the graph, will give a constant value for the rate of reaction
When the order with respect to a reactant is 0, a change in the concentration of the reactant has no effect on the rate of the reaction
Therefore:
Rate = k
This equation means that the gradient of the graph is the rate of reaction as well as the rate constant, k
In a first-order reaction, the concentration of the reactant decreases with time
The graph is a curve going downwards and eventually plateaus:
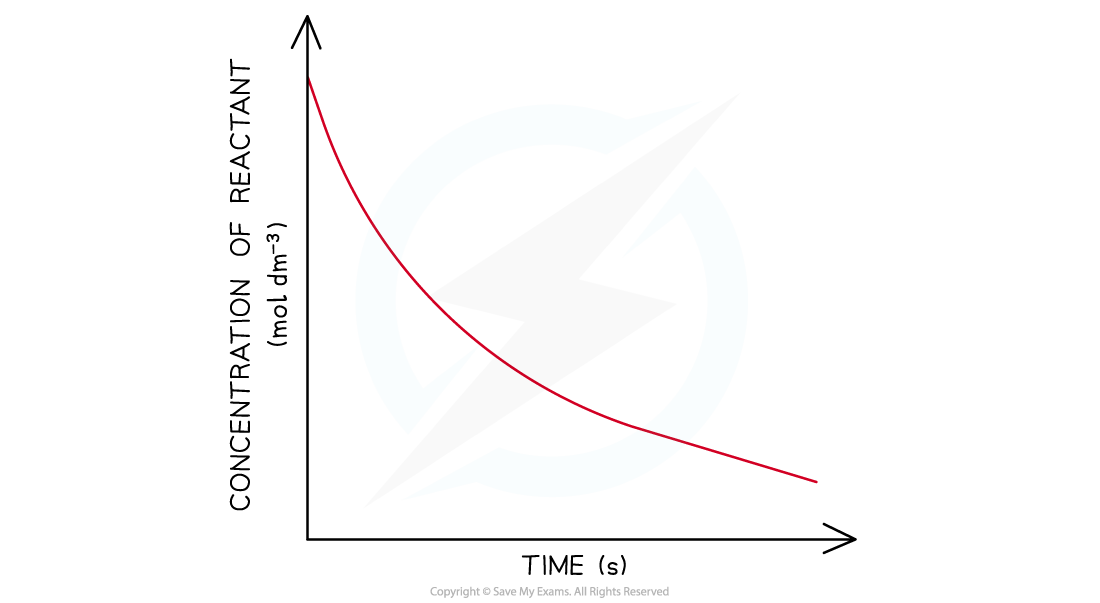
Concentration-time graph of a first-order reaction
In a second-order reaction, the concentration of the reactant decreases more steeply with time
The concentration of reactant decreases more with increasing time compared to a first-order reaction
The graph is a steeper curve going downwards:
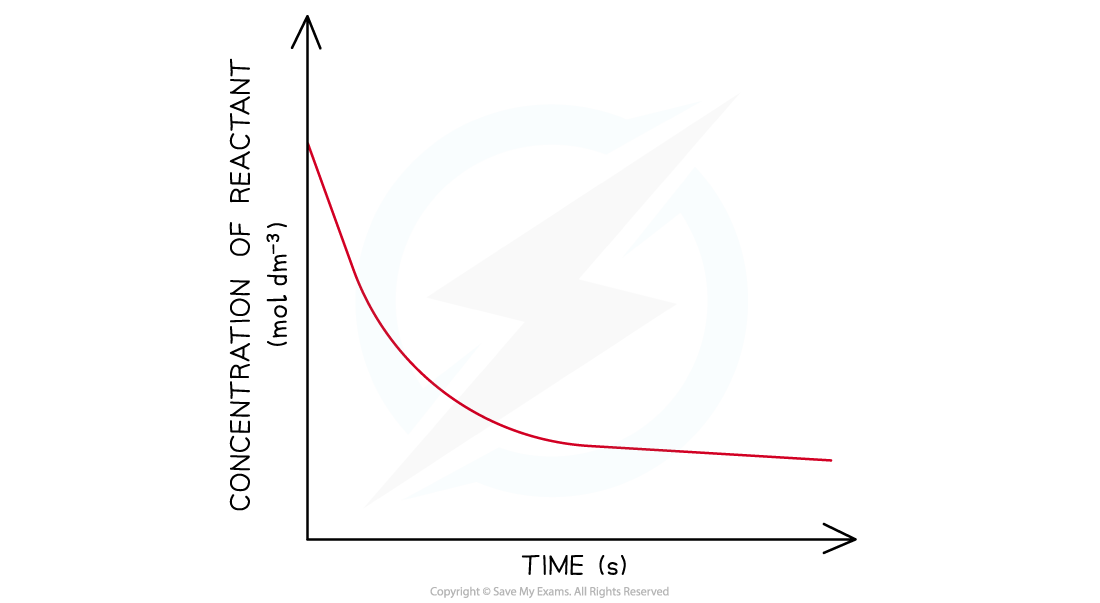
Concentration-time graph of a second-order reaction
Order of reaction from half-life
The order of a reaction can also be deduced from its half-life (t1/2 )
For a zero-order reaction the successive half-lives decrease with time
This means that it would take less time for the concentration of reactant to halve as the reaction progresses
The half-life of a first-order reaction remains constant throughout the reaction
The amount of time required for the concentration of reactants to halve will be the same during the entire reaction
For a second-order reaction, the half-life increases with time
This means that as the reaction is taking place, it takes more time for the concentration of reactants to halve
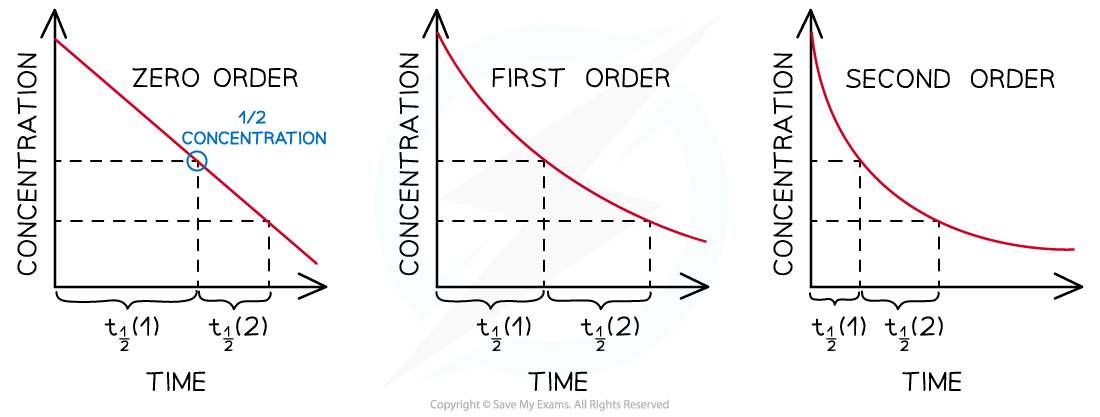
Half-lives of zero, first and second-order reactions
Examiner Tips and Tricks
Make sure that you know the correct shapes for the concentration-time graphs. It can be easy to confuse some concentration-time graphs with the following rate-concentration graphs, particularly;
The straight line of a zero-order concentration-time graph with the straight line of a first-order rate-concentration graph.
The curve of a first-order concentration-time graph with the curve of a second-order rate-concentration graph.
Reaction order using rate-concentration graphs
In a zero-order reaction, the rate doesn’t depend on the concentration of the reactant
The rate of the reaction therefore remains constant throughout the reaction
The graph is a horizontal line
The rate equation is rate = k
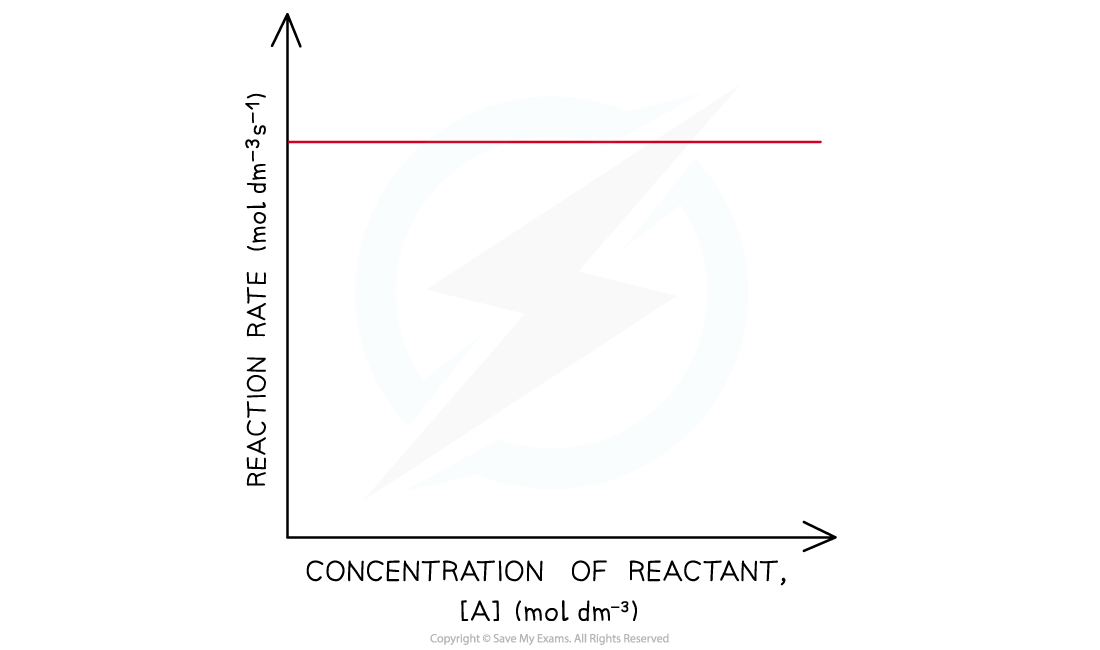
Rate-concentration graph of a zero-order reaction
In a first-order reaction, the rate is directly proportional to the concentration of a reactant
The rate of the reaction increases as the concentration of the reactant increases
This means that the rate of the reaction decreases as the concentration of the reactant decreases when it gets used up during the reaction
The graph is a straight line
The rate equation is rate = k[A]
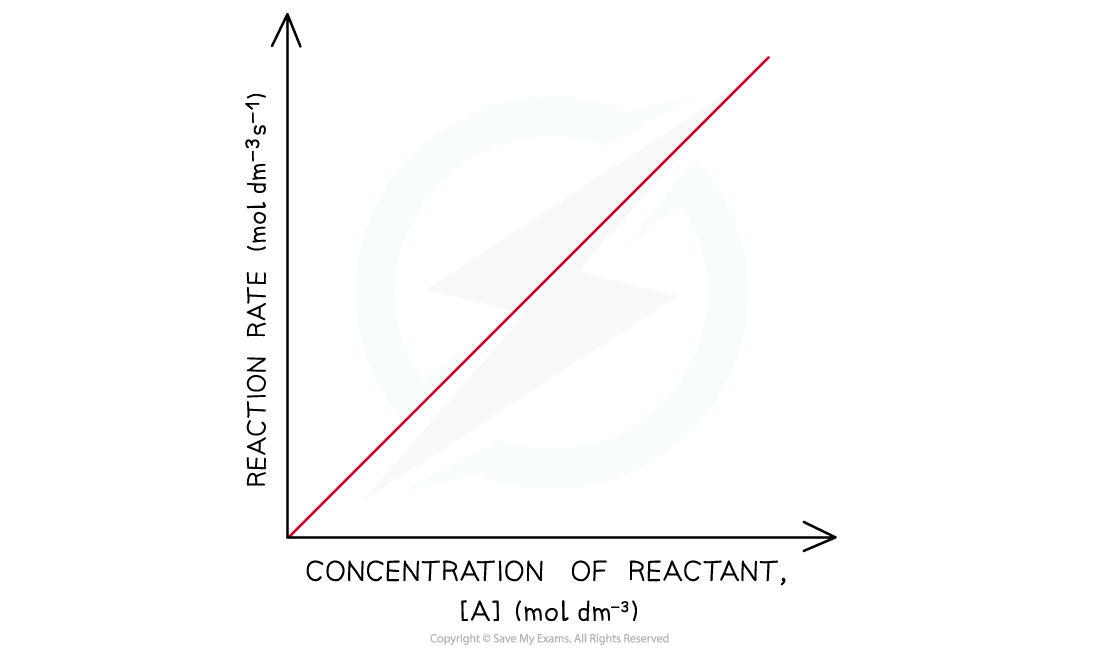
Rate-concentration graph of a first-order reaction
In a second-order reaction, the rate is directly proportional to the square of concentration of a reactant
The rate of the reaction increases more as the concentration of the reactant increases
This means that the rate of the reaction decreases more as the concentration of the reactant decreases when it gets used up during the reaction
The graph is a curved line
The rate equation is rate = k[A]2
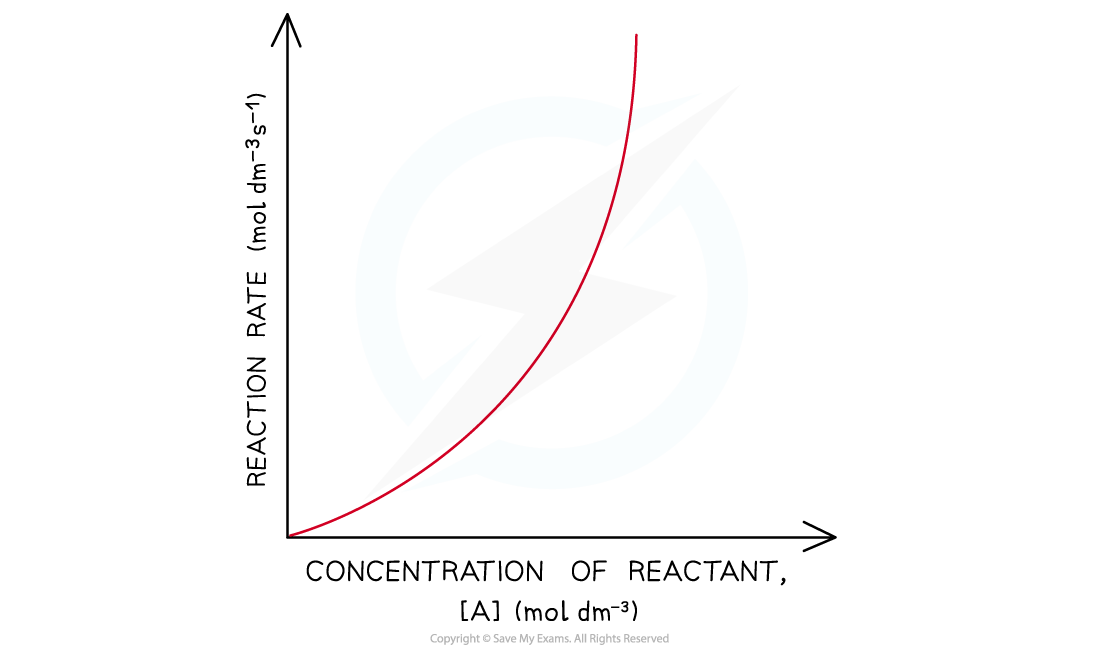
Rate-concentration graphs of a second-order reaction
Examiner Tips and Tricks
Careful - sometimes when asked to complete calculations for the rate constant, k, the exam question will give you a graph as well as tabulated data. Do not ignore the graph as this demonstrates the order of one of the reactants, while the tabulated data allows you to determine the order for the other reactants.

Unlock more, it's free!
Join the 100,000+ Students that ❤️ Save My Exams
the (exam) results speak for themselves:

Was this revision note helpful?
Build on this topic