1
4 marks
Outline the role of the water and carbon cycles in supporting life on Earth.
Was this exam question helpful?
Exam code: 7037
Outline the role of the water and carbon cycles in supporting life on Earth.
Was this exam question helpful?
Explain how positive feedback loops in the carbon cycle can amplify climate change.
Was this exam question helpful?
Outline how changes in industrial combustion can reduce global carbon emissions.
Was this exam question helpful?
Explain how changes in land use can alter carbon transfers between stores.
Was this exam question helpful?
Outline the role of international agreements such as the Paris Agreement in mitigating climate change.
Was this exam question helpful?
Outline the relationship between the water cycle and the carbon cycle in the atmosphere.
Was this exam question helpful?
Figure 1 shows the impact of different rates of deforestation and afforestation upon land surface temperature (LST) at different latitudes. The data was collected between 2000 and 2011.
Figure 1
The impact of different rates of deforestation and afforestation upon land surface temperature (LST) at different latitudes. The data was collected between 2000 and 2011.

Analyse the data shown in Figure 1.
[6]
Was this exam question helpful?
Figure 1 shows change in greenhouse gas (GHG) emissions, grouped by relative wealth of country, between 1970 and 2010.
Figure 1
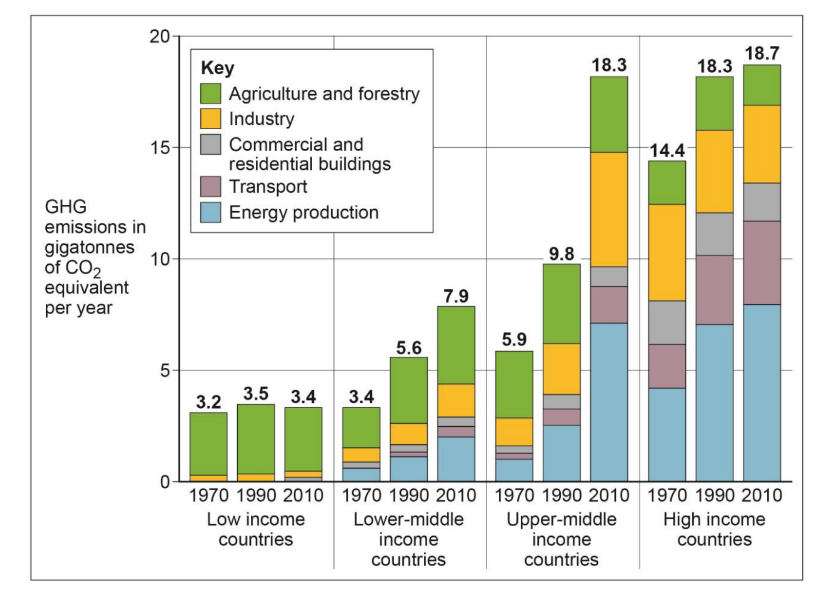
Analyse the data shown in Figure 1.
[6]
Was this exam question helpful?
Figure 2 shows the contribution of the top ten greenhouse gas emitters and information regarding the ratification of the Paris Accord climate change agreement as of May 2017.
Figure 2

Using Figure 2 and your own knowledge, assess the challenges associated with reducing greenhouse gas emissions.
[6]
Was this exam question helpful?
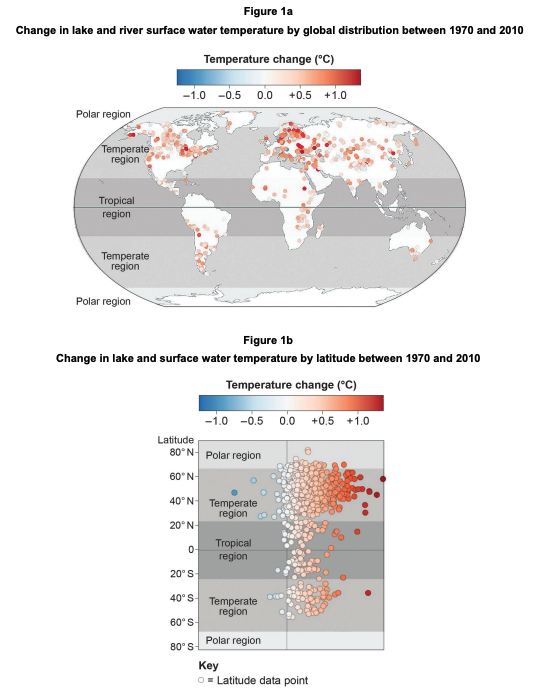
Figure 1a and Figure 1b are in the insert.
Figure 1a shows change in lake and river surface water temperature by global distribution between 1970 and 2010. Figure 1b shows change in lake and surface water temperature by latitude between 1970 and 2010.
Analyse the data shown in Figure 1a and Figure 1b.
Was this exam question helpful?
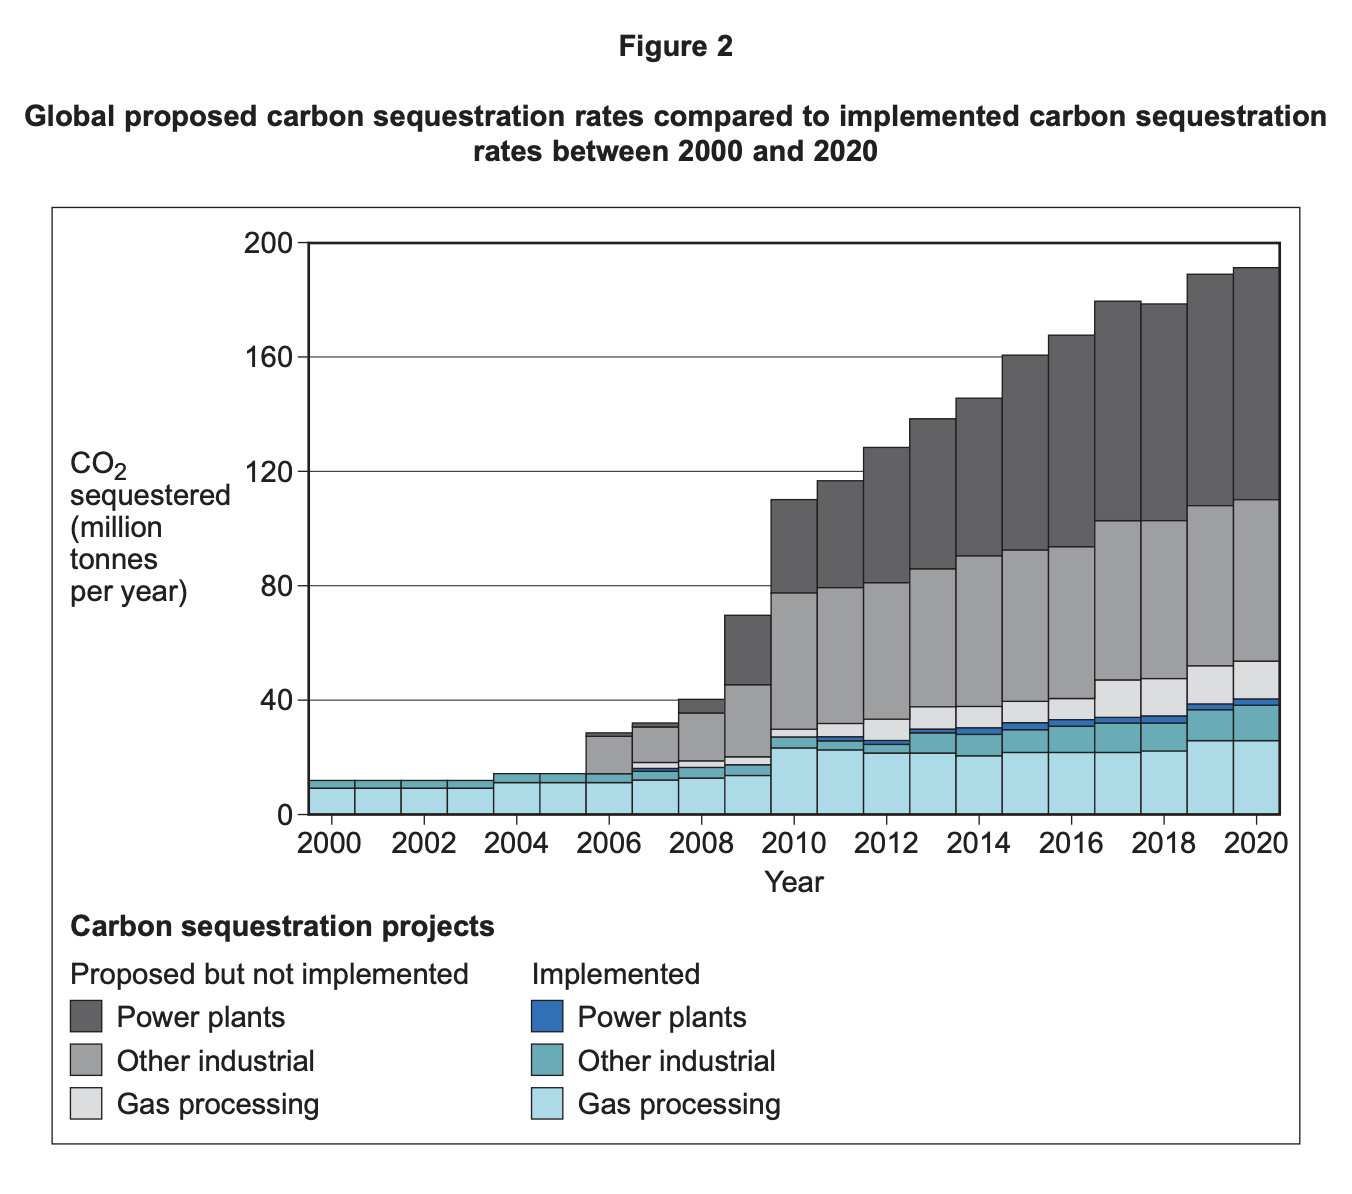
Figure 2 shows global proposed carbon sequestration rates compared to implemented carbon sequestration rates between 2000 and 2020.
Using Figure 2 and your own knowledge, assess the challenges associated with carbon sequestration.
Was this exam question helpful?
Assess the extent to which there are inter-relationships between processes in the water cycle and factors driving change in the carbon cycle.
Was this exam question helpful?
To what extent does an understanding of feedback systems in the carbon cycle help with attempts to mitigate the impacts of climate change?
Was this exam question helpful?
Discuss the extent to which the water and carbon cycles are interdependent in supporting life on Earth.
Was this exam question helpful?
To what extent has climate change altered the operation of the water and carbon cycles?
Was this exam question helpful?
To what extent is political action more important than technological change in mitigating climate change?
Was this exam question helpful?
With reference to a tropical rainforest that you have studied, evaluate attempts to mitigate the impacts of climate change.
Was this exam question helpful?