1
4 marks
Outline the human causes of desertification in the Sahel.
Was this exam question helpful?
Exam code: 7037
Outline the human causes of desertification in the Sahel.
Was this exam question helpful?
Outline the natural causes of desertification.
Was this exam question helpful?
Describe the impacts of desertification on people.
Was this exam question helpful?
Outline one strategy used to reduce the impacts of desertification.
Was this exam question helpful?
Outline the global distribution of areas at risk of desertification.
Was this exam question helpful?
Using Figure 4 and your own knowledge, assess the benefits of the shelterbelt system in combatting desertification.
[6]
Figure 4 Surrounded by mountains and far from any sea or ocean, the region of Xinjiang Uygur in the north-west region of the People’s Republic of China represents the largest stretch of drylands in China. Xinjiang territory stretches over 1 650 000 km2 of which 49.5% are mountainous zones and 22.5% is desert. It is estimated that 400 million people are suffering from the impact of desertification and the effects of sand dust that can attack skin and lungs. Desertification in China is mainly caused by human induced factors and by extreme climatic conditions. An oasis is an area with a plentiful supply of water in an otherwise arid environment. Vegetation growth will be adapted to the conditions in the oasis and will contain different species to the surrounding environment. What is shelterbelt system in the Xinjiang Oasis?
Ground wind speed is reduced by the presence of shrubs and grasses standing 50 cm to 60 cm high. In areas where sand accumulates, vegetation can reduce the development of dunes once the vegetation covers 40% of the surface. The shelterbelt also acts as a biological drainage system that plays an important role in the Xinjiang oases. In Anjiahi, in the northern part of Xinjiang, the groundwater level of farmland has been lowered by between 20 cm and 70 cm. The tree network creates a microclimate. In some instances, the rate of water consumption for one kilogram of wheat or corn has decreased by between 15% and 22.8%. |
Was this exam question helpful?
Figure 3 shows desertification risk levels by landscape type in an area of Tunisia, north Africa.
Figure 3 – desertification risk levels by landscape type in an area of Tunisia, north Africa

Analyse the relationship between landscape type and risk of desertification shown in Figure 3.
[6]
Was this exam question helpful?
Figure 3a shows the primary productivity in five study areas of northern China which are at different stages of aeolian desertification.
Figure 3b shows the percentages of soil particle size in the same five study areas.
Figure 3a
Primary productivity in five study areas of Northern China at different stages of aeolian desertification

Figure 3b
Percentages of soil particle size in the same five study areas

Analyse the data shown in Figure 3a and Figure 3b.
[6]
Was this exam question helpful?
Analyse the data shown in Figure 1.
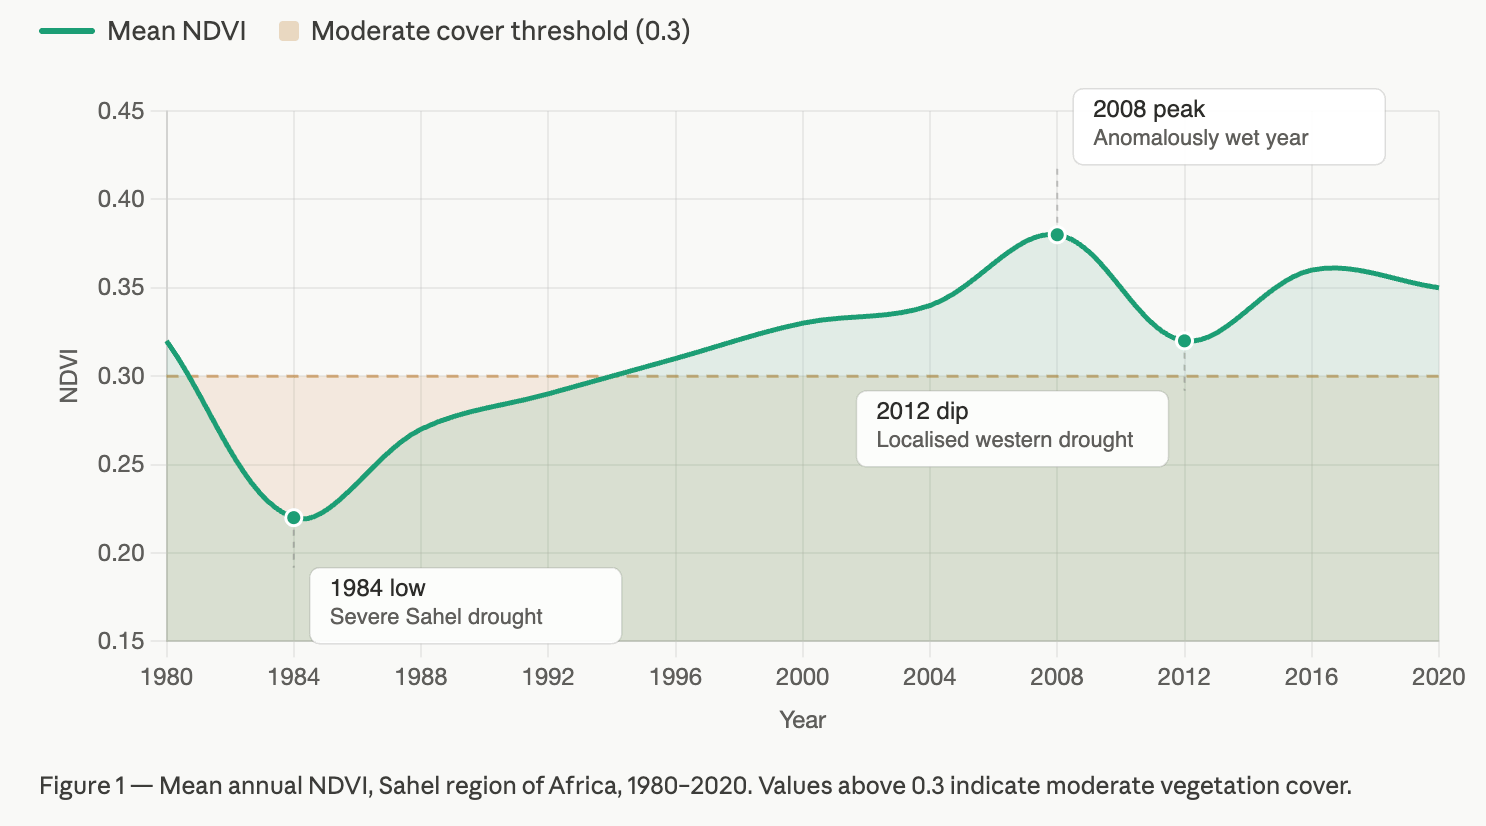
Source: NASA GIMMS satellite vegetation record, after Anyamba & Tucker (2005), updated.
Was this exam question helpful?
Using Figure 2 and your own knowledge, assess the challenges facing Sahel countries as a result of declining water availability.
Figure 2: Per-capita freshwater availability for selected Sahel countries, 1990–2020.
Year | Niger (m³/person/year) | Mali (m³/person/year) | Burkina Faso (m³/person/year) | Chad (m³/person/year) |
|---|---|---|---|---|
1990 | 3,200 | 5,800 | 1,200 | 4,600 |
1995 | 2,800 | 5,200 | 1,050 | 4,100 |
2000 | 2,400 | 4,800 | 960 | 3,800 |
2005 | 2,100 | 4,400 | 880 | 3,500 |
2010 | 1,850 | 4,100 | 820 | 3,200 |
2015 | 1,650 | 3,800 | 780 | 3,000 |
2020 | 1,400 | 3,500 | 740 | 2,800 |
Source: Adapted from UN FAO AQUASTAT data, 2021. Note: 1,700 m³/person/year is the internationally recognised water scarcity threshold.
Was this exam question helpful?
Using Figure 1 and your own knowledge, to what extent are physical factors the main cause of vulnerability to desertification in the Sahel?
Figure 1: Vulnerability to desertification in the Sahel region, 2020
Country | Vulnerability index | Annual rainfall (mm/yr) | Population density (people/km²) |
|---|---|---|---|
Niger | Very high (0.82) | 180 | 21 |
Mali | Very high (0.79) | 210 | 17 |
Chad | Very high (0.77) | 195 | 16 |
Burkina Faso | High (0.68) | 290 | 79 |
Senegal | High (0.61) | 390 | 82 |
Sudan (Sahel margins) | High (0.65) | 270 | 25 |
Source: adapted from UNCCD Land Degradation Neutrality Target Setting Programme, 2020. Vulnerability index: 0 = no vulnerability; 1 = extreme vulnerability. Higher population density indicates greater human pressure on land.
Was this exam question helpful?
Figure 4 shows some of the factors causing desertification in selected locations.
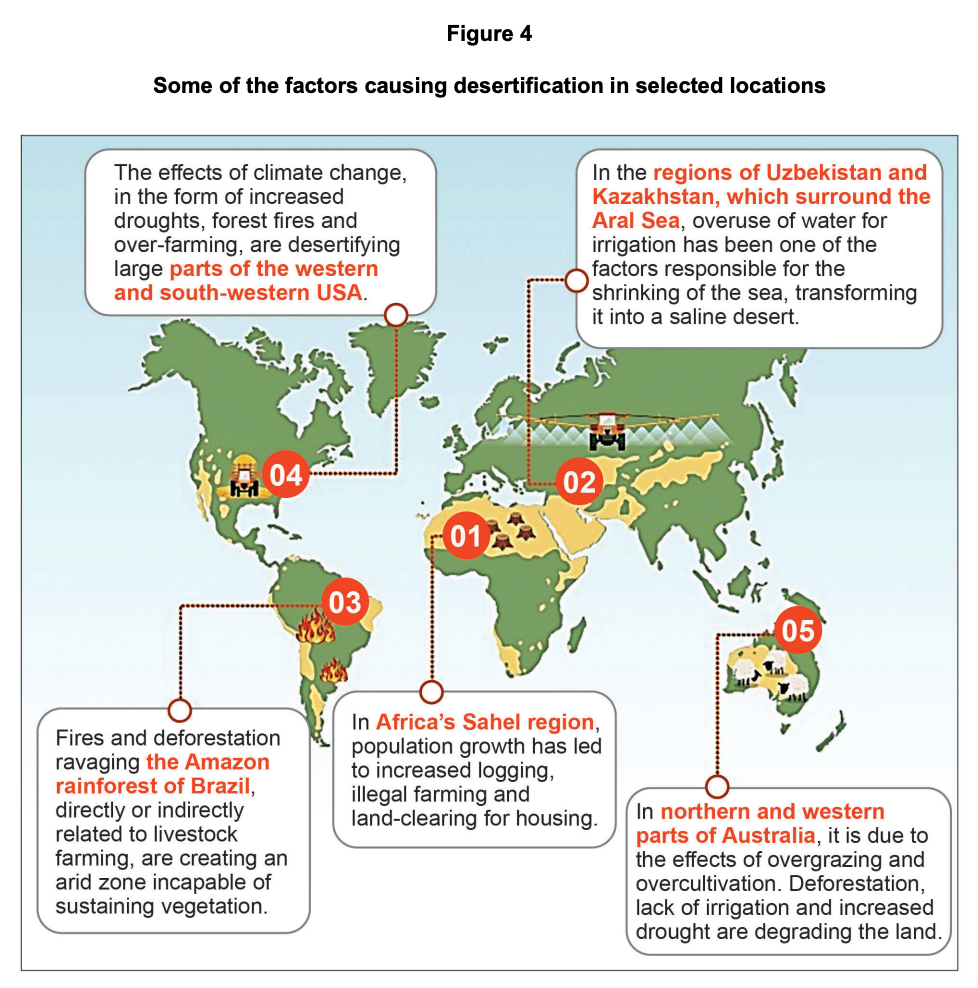
Using Figure 4 and your own knowledge, assess the potential impact of desertification.
Was this exam question helpful?
‘Desertification trends are entirely a product of human-induced climate change as opposed to naturally occurring phenomena.’
To what extent do you agree with this view?
Was this exam question helpful?
‘The fragile inter-relationship between climate, soils and vegetation in arid regions is becoming increasingly affected by human activity.’
How far do you agree with this view?
Was this exam question helpful?
‘Climate change is on course to radically alter the role of water in deserts and their margins, affecting both human populations and the physical landscape.’ To what extent do you agree with this view?
Was this exam question helpful?