1
4 marks
Outline the pattern of global trade flows between developed and developing countries.
Was this exam question helpful?
Exam code: 7037
Outline the pattern of global trade flows between developed and developing countries.
Was this exam question helpful?
Explain how one transnational corporation (TNC) has contributed to the globalisation of the world’s economy.
Was this exam question helpful?
Outline the spatial organisation of one transnational corporation (TNC) you have studied.
Was this exam question helpful?
Which of the following best describes a trade bloc?
A single company that controls the production and sale of a particular good across the world.
A tax placed by one country on goods imported from another country.
A group of countries that agree to reduce or remove trade barriers between themselves.
An international organisation that lends money to countries facing financial difficulty.
Was this exam question helpful?
Outline how Fairtrade can benefit producers of a commodity, such as bananas, in lower-income countries.
Was this exam question helpful?
Figure 2 shows the destination of China's biggest exports by total value in 2018.
Figure 2

Using Figure 2 and your own knowledge, assess the importance of geographical location in trading relationships between major economies such as China and smaller less developed economies.
Was this exam question helpful?
Figure 2 shows the global trade in oil in 2012
Figure 2

Using Figure 2 and your own knowledge, assess the extent to which this pattern is similar to the global trade in a food commodity or manufactured product you have studied.
Was this exam question helpful?
Analyse the data in Figure 1, which shows global FDI inflows by region, 2000–2020.
Figure 1: Global FDI (Foreign Direct Investment) inflows by region as a percentage of the world total, selected years
Region | 2000 (% of global total) | 2010 (% of global total) | 2020 (% of global total) |
|---|---|---|---|
North America and Europe | 68 | 43 | 38 |
China and East Asia | 10 | 20 | 27 |
South and Southeast Asia | 6 | 12 | 16 |
Sub-Saharan Africa | 3 | 5 | 4 |
Latin America and Caribbean | 9 | 13 | 11 |
Rest of world | 4 | 7 | 4 |
Source: Adapted from UNCTAD World Investment Report, 2021
Was this exam question helpful?
Using Figure 1 and your own knowledge, assess the extent to which the expansion of transnational corporations has benefited developing and emerging economies.
Figure 1: Apple Inc. net revenue by geographic segment, FY2019 and FY2023 (billion USD)
Geographic segment | FY2019 revenue (billion USD) | FY2023 revenue (billion USD) |
|---|---|---|
Americas | 116 | 162 |
Europe | 60 | 94 |
Greater China | 44 | 72 |
Japan | 21 | 24 |
Rest of Asia Pacific | 20 | 30 |
Total | 260 | 383 |
Source: Apple Inc., Annual Report 2023
Was this exam question helpful?
Study Figure 1, which shows the destination of China’s biggest exports by total value in 2018.
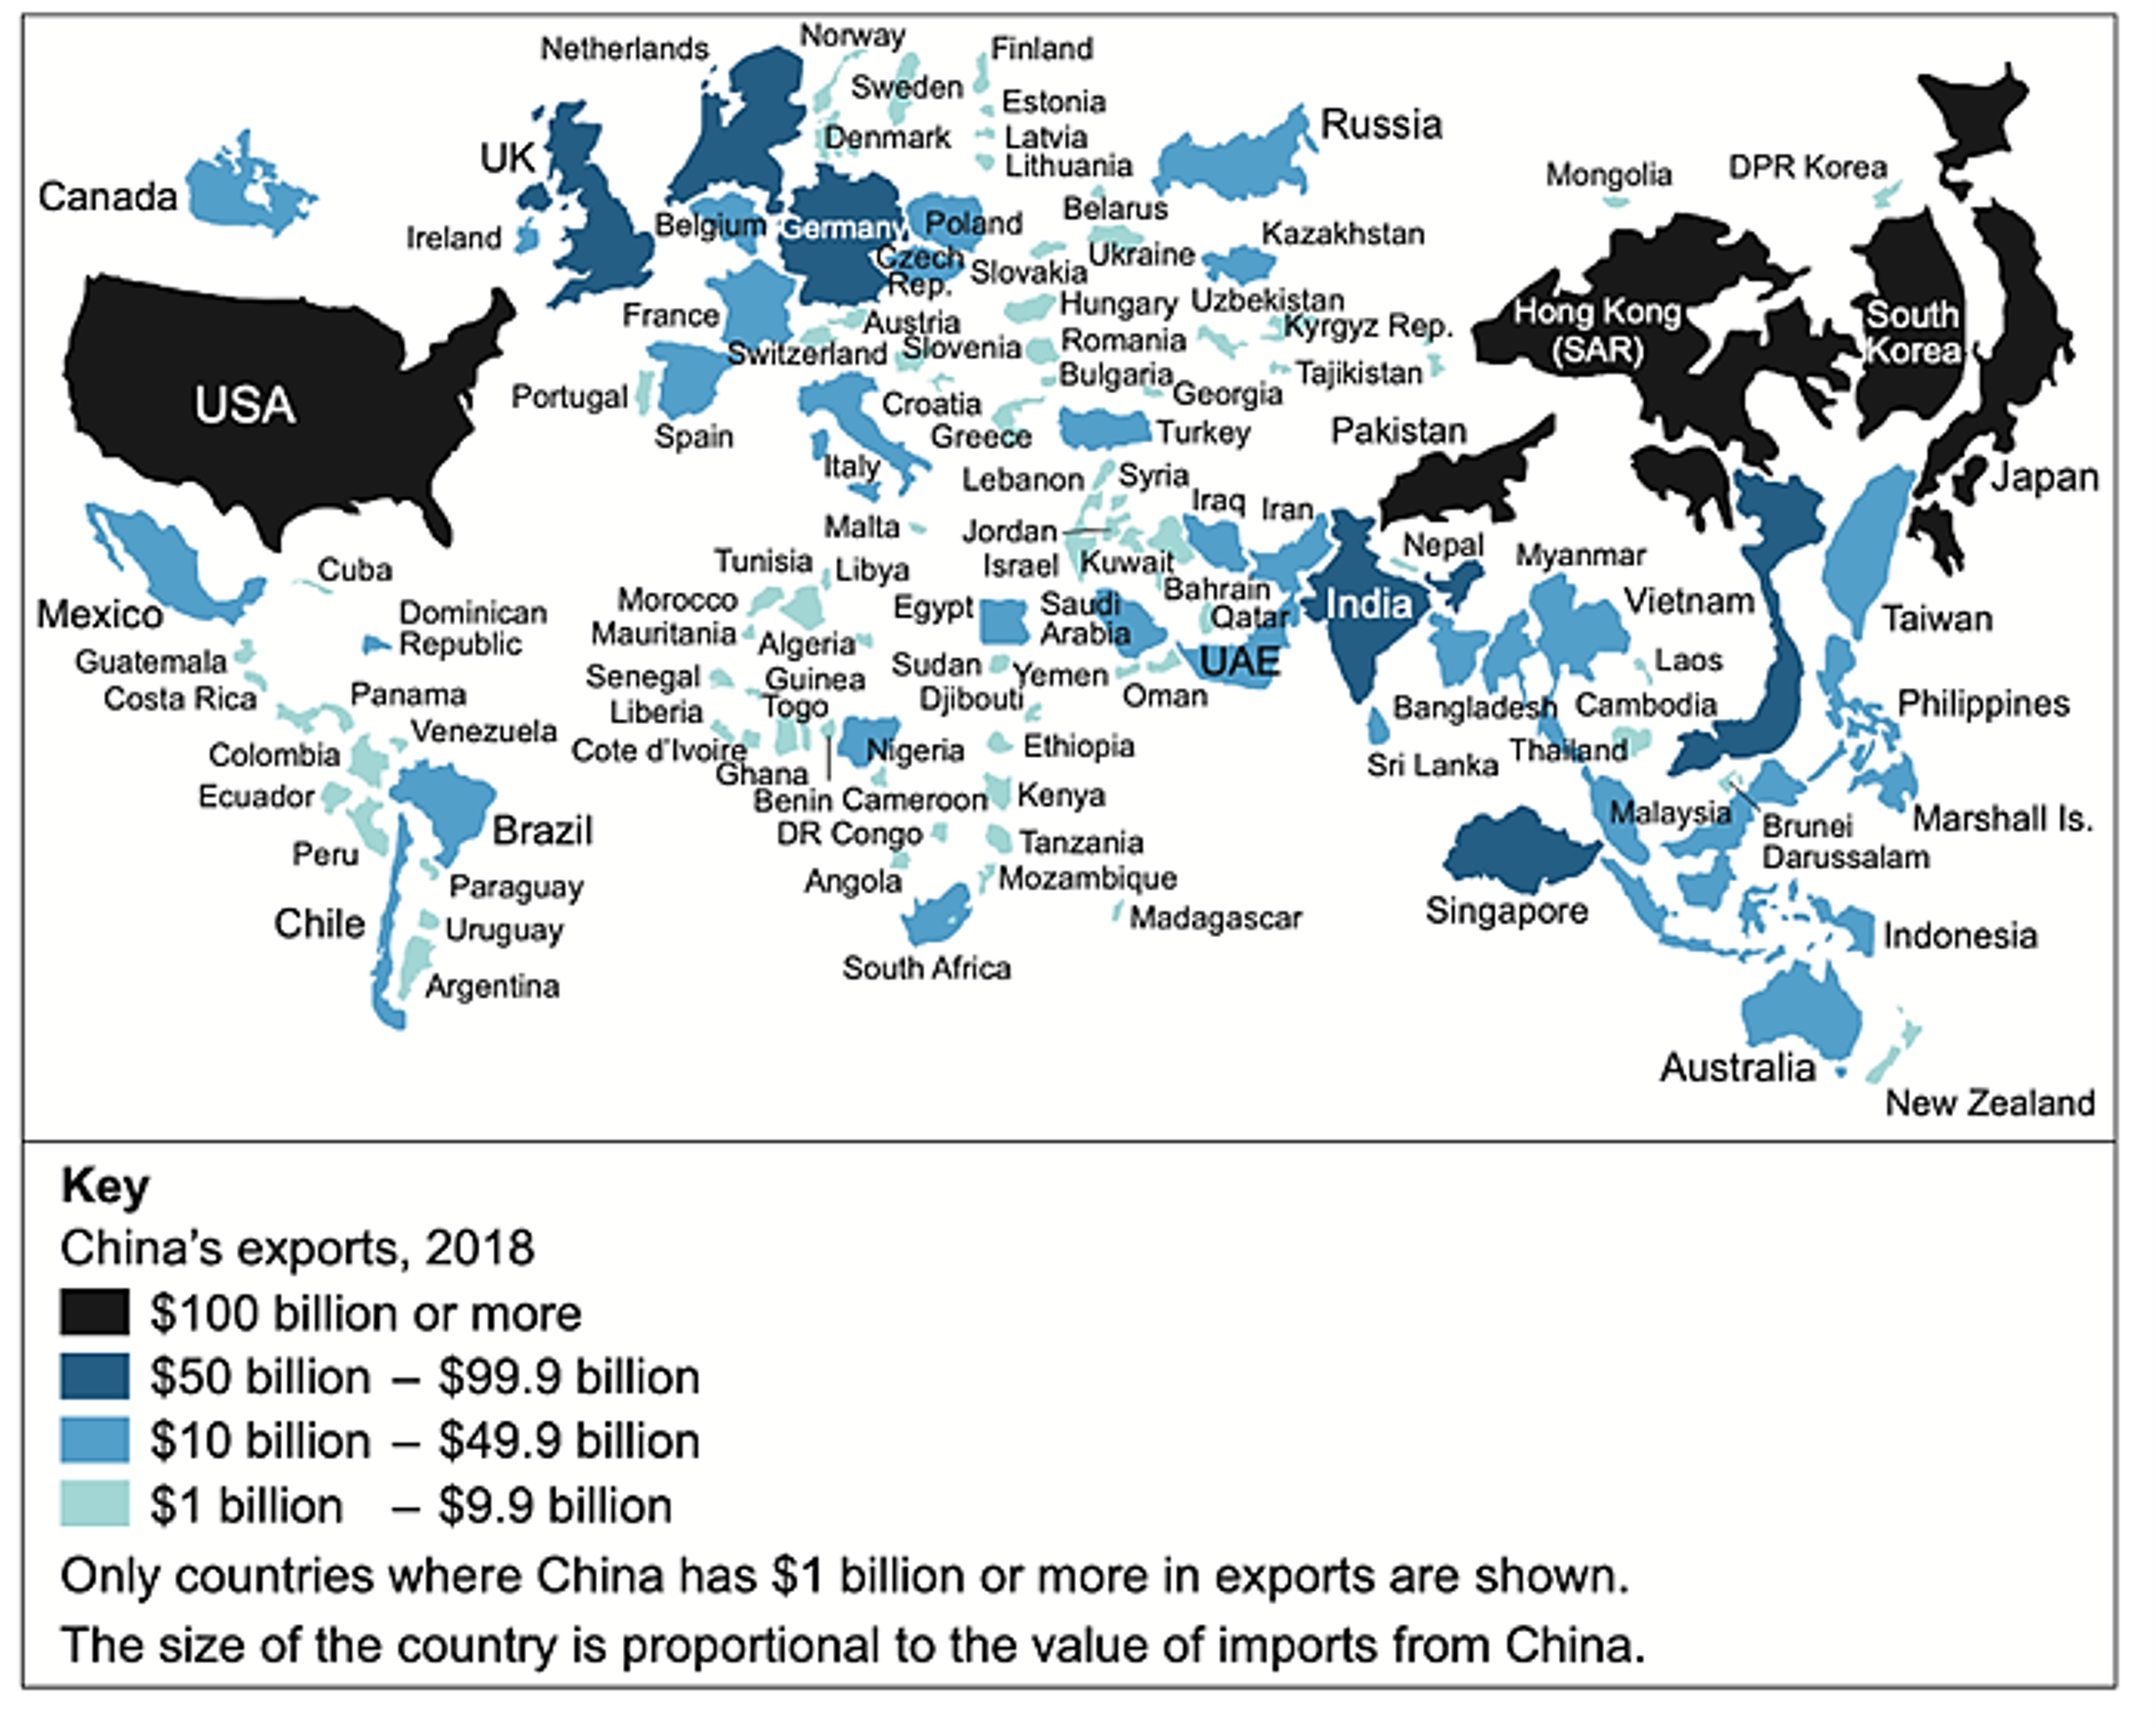
Analyse the data shown in Figure 1.
Was this exam question helpful?
Figure 2 shows workers in a shoe factory in Vietnam supplying TNCs.
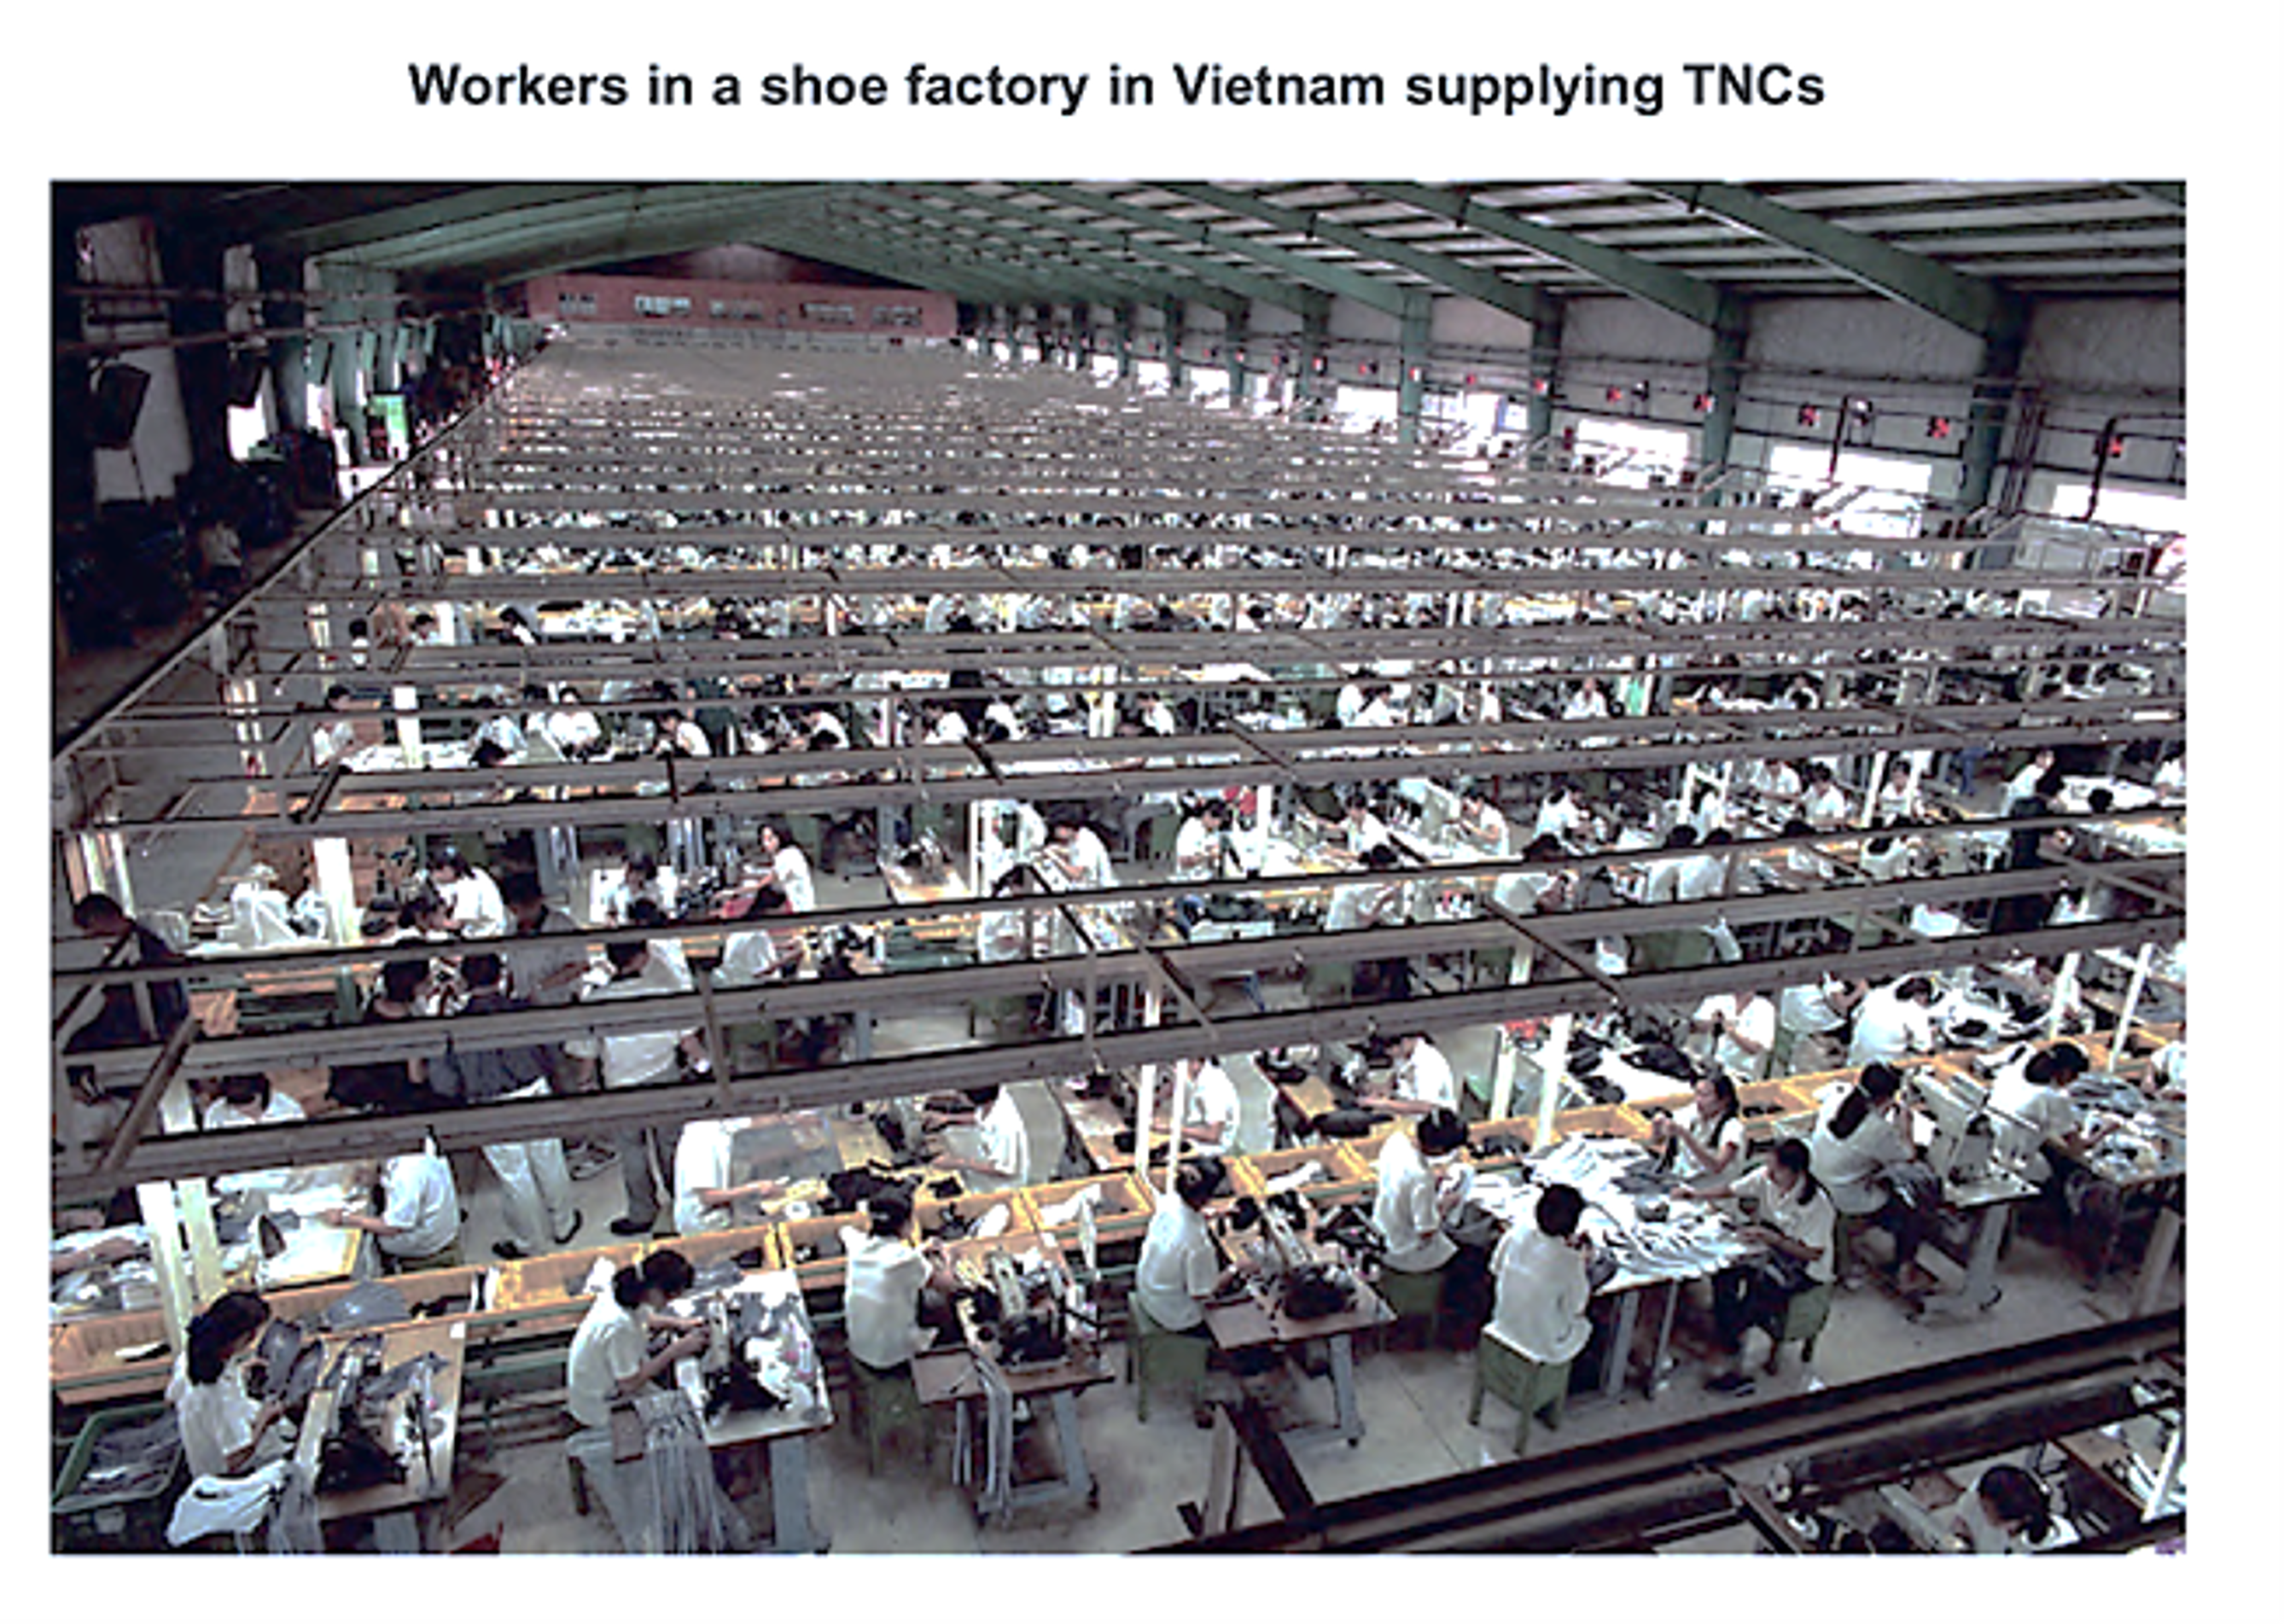
Using Figure 2 and your own knowledge, to what extent do TNCs have a positive impact on people in the countries in which they operate?
Was this exam question helpful?
Evaluate the view that global trade relationships are the primary cause of persistent inequality between developed and developing countries.
Was this exam question helpful?
Assess the extent to which membership of a trade bloc benefits the countries involved.
Was this exam question helpful?
Assess the view that the global food system brings greater benefits to consumers in higher-income countries (HICs) than to producers in lower-income countries (LICs).
Was this exam question helpful?