Transformations of Trigonometric Functions (DP IB Analysis & Approaches (AA): SL): Revision Note

Transformations of trigonometric functions
How do I apply a single transformation to a trig graph?
You can transform a trig graph using
a translation
a stretch
a reflection
The table below shows the equations of the trig graphs after each transformation
Transformation | Equation | Details |
|---|---|---|
Horizontal translation |
| |
Vertical translation |
| |
Horizontal stretch | Scale factor | |
Vertical stretch | Scale factor | |
Reflection in the -axis | ||
Reflection in the -axis |
How do I apply multiple transformations to a trig graph?
You need to be able to apply multiple transformations to draw graphs written in the form
The order for the vertical transformations are:
Reflection in the -axis if is negative
Stretch by scale factor
Translation units
Up if positive
Down if negative
The order for the horizontal transformations are:
Reflection in the -axis if is negative
Stretch by scale factor
Translation units
Right if it's
Left if it's
Examiner Tips and Tricks
It does not matter if you do the vertical transformations or the horizontal transformations first.
How do transformations affect the trig graph?
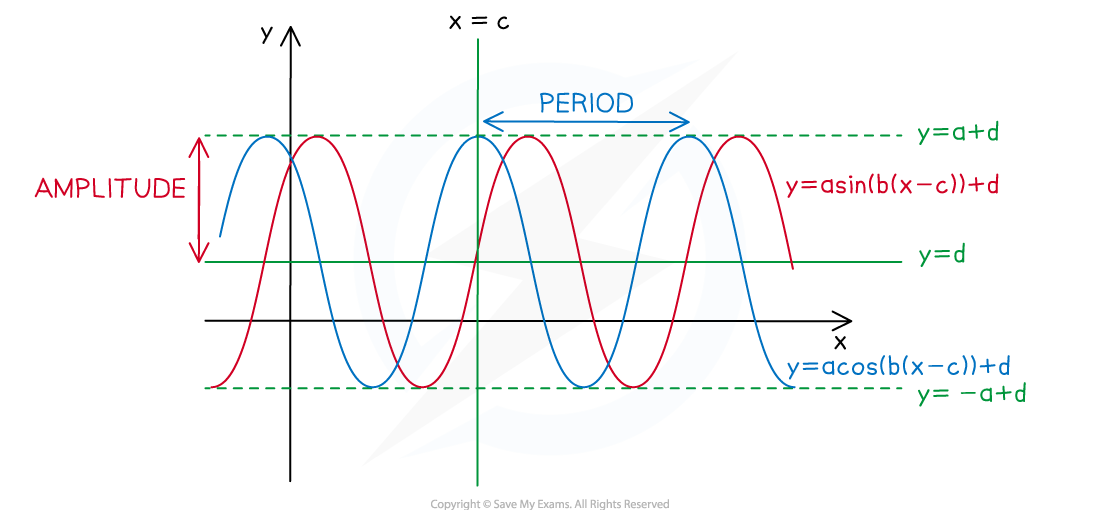
The graph and have the properties:
The principal axis is
The amplitude is
The period is
The phase shift is
You can use these properties to sketch a transformed trig graph
e.g.
Draw a sine curve without any axes
Identify where the -axis should go
Label the principal axis
Label the maximum points at
Label the minimum points at
Find the period
You can label the intersections with the principal axis temporarily as 0°, 60°, 120°, etc
Identify where the -axis should go
Temporally put the -axis going through 0°
Translate the graph 45° to the right
Add 45° to the intersections with the principal axis
The graph works similarly
There is no amplitude
The graph has no minimum or maximum points
The period is
The graph has asymptotes
These are located halfway between the intersections of the graph with the principal axis
Examiner Tips and Tricks
Check your sketch is correct by substituting easy values (such as ) into the equation.
Worked Example
Sketch the graph of for the interval . State the amplitude, period and principal axis of the function.
Answer:


Unlock more, it's free!
Join the 100,000+ Students that ❤️ Save My Exams
the (exam) results speak for themselves:

Was this revision note helpful?
Build on this topic
