A researcher investigated the populations of rabbits and foxes in a woodland area over 20 years.
Fig. 2 shows the estimated populations over this time period.
Fig. 2
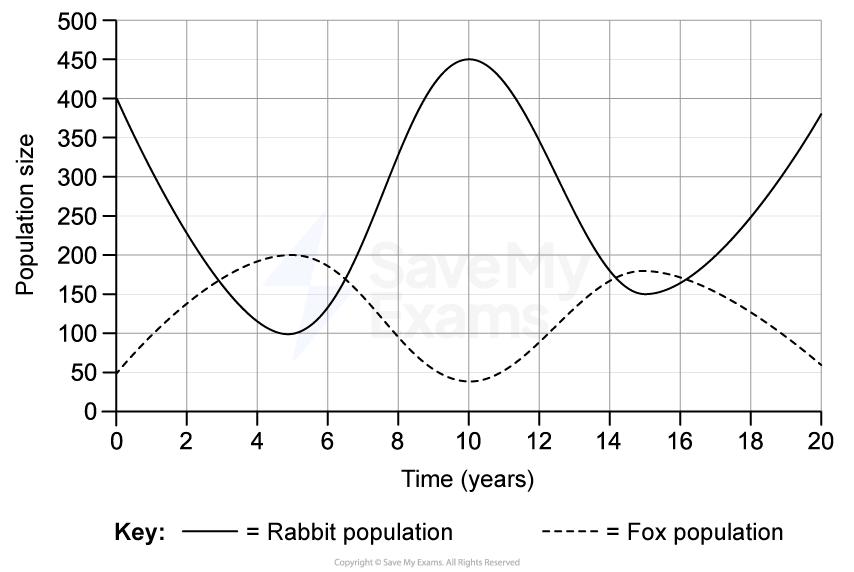
(i) Using Fig. 2, state the rabbit population at year 0.
[1]
(ii) Using Fig. 2, state the fox population at year 10.
[1]
Using Fig. 2, determine the fox population at year 12. Show on your graph how you obtained your answer
Describe the trend in the rabbit population over the 20 years shown in Fig. 2.
Describe the relationship between the rabbit and fox populations shown in Fig. 2.
Calculate the percentage decrease in the fox population between year 15 and year 20.
Give your answer to one decimal place. Show your working
In year 10, the student estimated the rabbit population by counting the number of rabbits seen in four different sectors of the woodland. The results are shown in Table 2.
Table 2
Sector 1 | Sector 2 | Sector 3 | Sector 4 | Mean | |
|---|---|---|---|---|---|
Number of rabbits | 112 | 115 | 42 | 118 | 115 |
(i) Identify the anomalous result in Table 2.
[1]
(ii) Explain how the student calculated the mean shown in Table 2.
[1]
(i) The anomalous result is:
42 (in Sector 3) [1 mark]
(ii) The student calculated the mean as follows:
The student excluded/ignored the anomalous result AND averaged the other three sectors [1 mark]
The anomalous result is the value that is significantly different from the other values in the data set.
Suggest one limitation of the data shown in Fig. 2.
Suggest two ways the student could improve their method for estimating the animal populations to increase confidence in the results.
Was this exam question helpful?