The Heart (Cambridge (CIE) O Level Biology): Exam Questions

Exam code: 5090

2 hours14 questions
1a
4 marks

A student completed different types of activity.

She measured her pulse rate during each type of activity in beats per minute (bpm).

The results are shown in Fig. 1.

2018-nov-s1-061031-q3a

Fig. 1

Use Fig. 1 to answer these questions.

(i) State the type of activity that results in the highest pulse rate.

[1]

(ii) State the pulse rate of the student when she was cycling. Give your answer in bpm.

[1]

(iii) Calculate the percentage increase in her pulse rate between resting and walking.

Show your working and give your answer to the nearest whole number.

[2]

1b
1 mark

Measuring the pulse is one way of monitoring the activity of the heart.

State one other way of monitoring the activity of the heart.

1c
2 marks

Describe the changes to a person's breathing during exercise.

2a
4 marks

The heart is part of the circulatory system.

Fig. 1 shows a mammalian heart. 

4a-heart

Fig. 1

Identify the structures labelled A to D in Fig. 1.

2b
1 mark

Label Fig. 1 to show the location of the septum.

2c
1 mark

Explain why the human circulatory system is described as a double circulation system.

2d
2 marks

Describe the function of the right side of the heart.

1a
5 marks

A scientist investigated the effect of different types of activity on the heart rate of participants, aged 21, after they had completed the activity for 10 minutes. 

The results are shown in Fig. 1.

cie-igcse-2023-specimen-q2a

Fig. 1

(i) State two control variables that the scientist should have kept constant throughout the investigation. 

[2]

(ii) Describe the results of the investigation.

[3]

1b
3 marks

Describe how the scientist could have measured and recorded heart rate.

1c
3 marks

Explain the effect of swimming on heart rate.

2a
4 marks

(i) State the name of the disease caused by a blockage in the arteries supplying the heart muscle.

[1]

(ii) List three risk factors that increase the risk of a blockage in the arteries supplying the heart muscle.

[3]

2b
4 marks

Fig. 1 is a diagram of the circulatory system. The blood vessels are labelled with letters.

061032-oct-2018-paper-3-q8d-circulatory-system---sq

Fig. 1

Complete Table 1 by identifying the letter of the named blood vessel in Fig. 1.

Table 1

name of blood vessel

letter

aorta


pulmonary artery


renal vein


vena cava


2c
4 marks

Describe how the structures of the circulatory system maintain a one-way flow of blood.

1a
2 marks

The coronary arteries supply the heart muscle tissue with blood.

Fig. 1 shows a coronary artery with a blockage. 

coronary

Fig. 1

Explain the effect this blockage could have on heart muscle cells.

1b
3 marks

A blocked coronary artery can lead to coronary heart disease. 

Table 1 shows information about blood flow through coronary arteries in two people.

Person X was diagnosed with coronary heart disease while person Y does not have coronary heart disease.

Table 1

person

blood flow through coronary arteries /

cm3 min -1

X 

167

Y 

295

(i) Explain the difference in blood flow through the coronary arteries for persons X and Y.

[1]

(ii) Calculate the volume of blood flowing through the coronary arteries of person X in 1 hour.

Give your answer in dm3.

[2]

1c
4 marks

A blockage of the coronary artery can be caused by fatty deposits called plaques. Drugs called statins can be taken to help prevent a blockage. 

Fig. 2 shows the effects of the treatment of one person with four different statins (ABC and D) over a period of 10 years. The arrows show when each new treatment was started.

graph-1

Fig. 2

Determine a conclusion on the effectiveness of the statin treatments in reducing the risk of coronary heart disease for this person.

1d
3 marks

The data was used to generate a report, with the claim: "Coronary heart disease can be cured by statins".

Evaluate the claim. 

1
2 marks

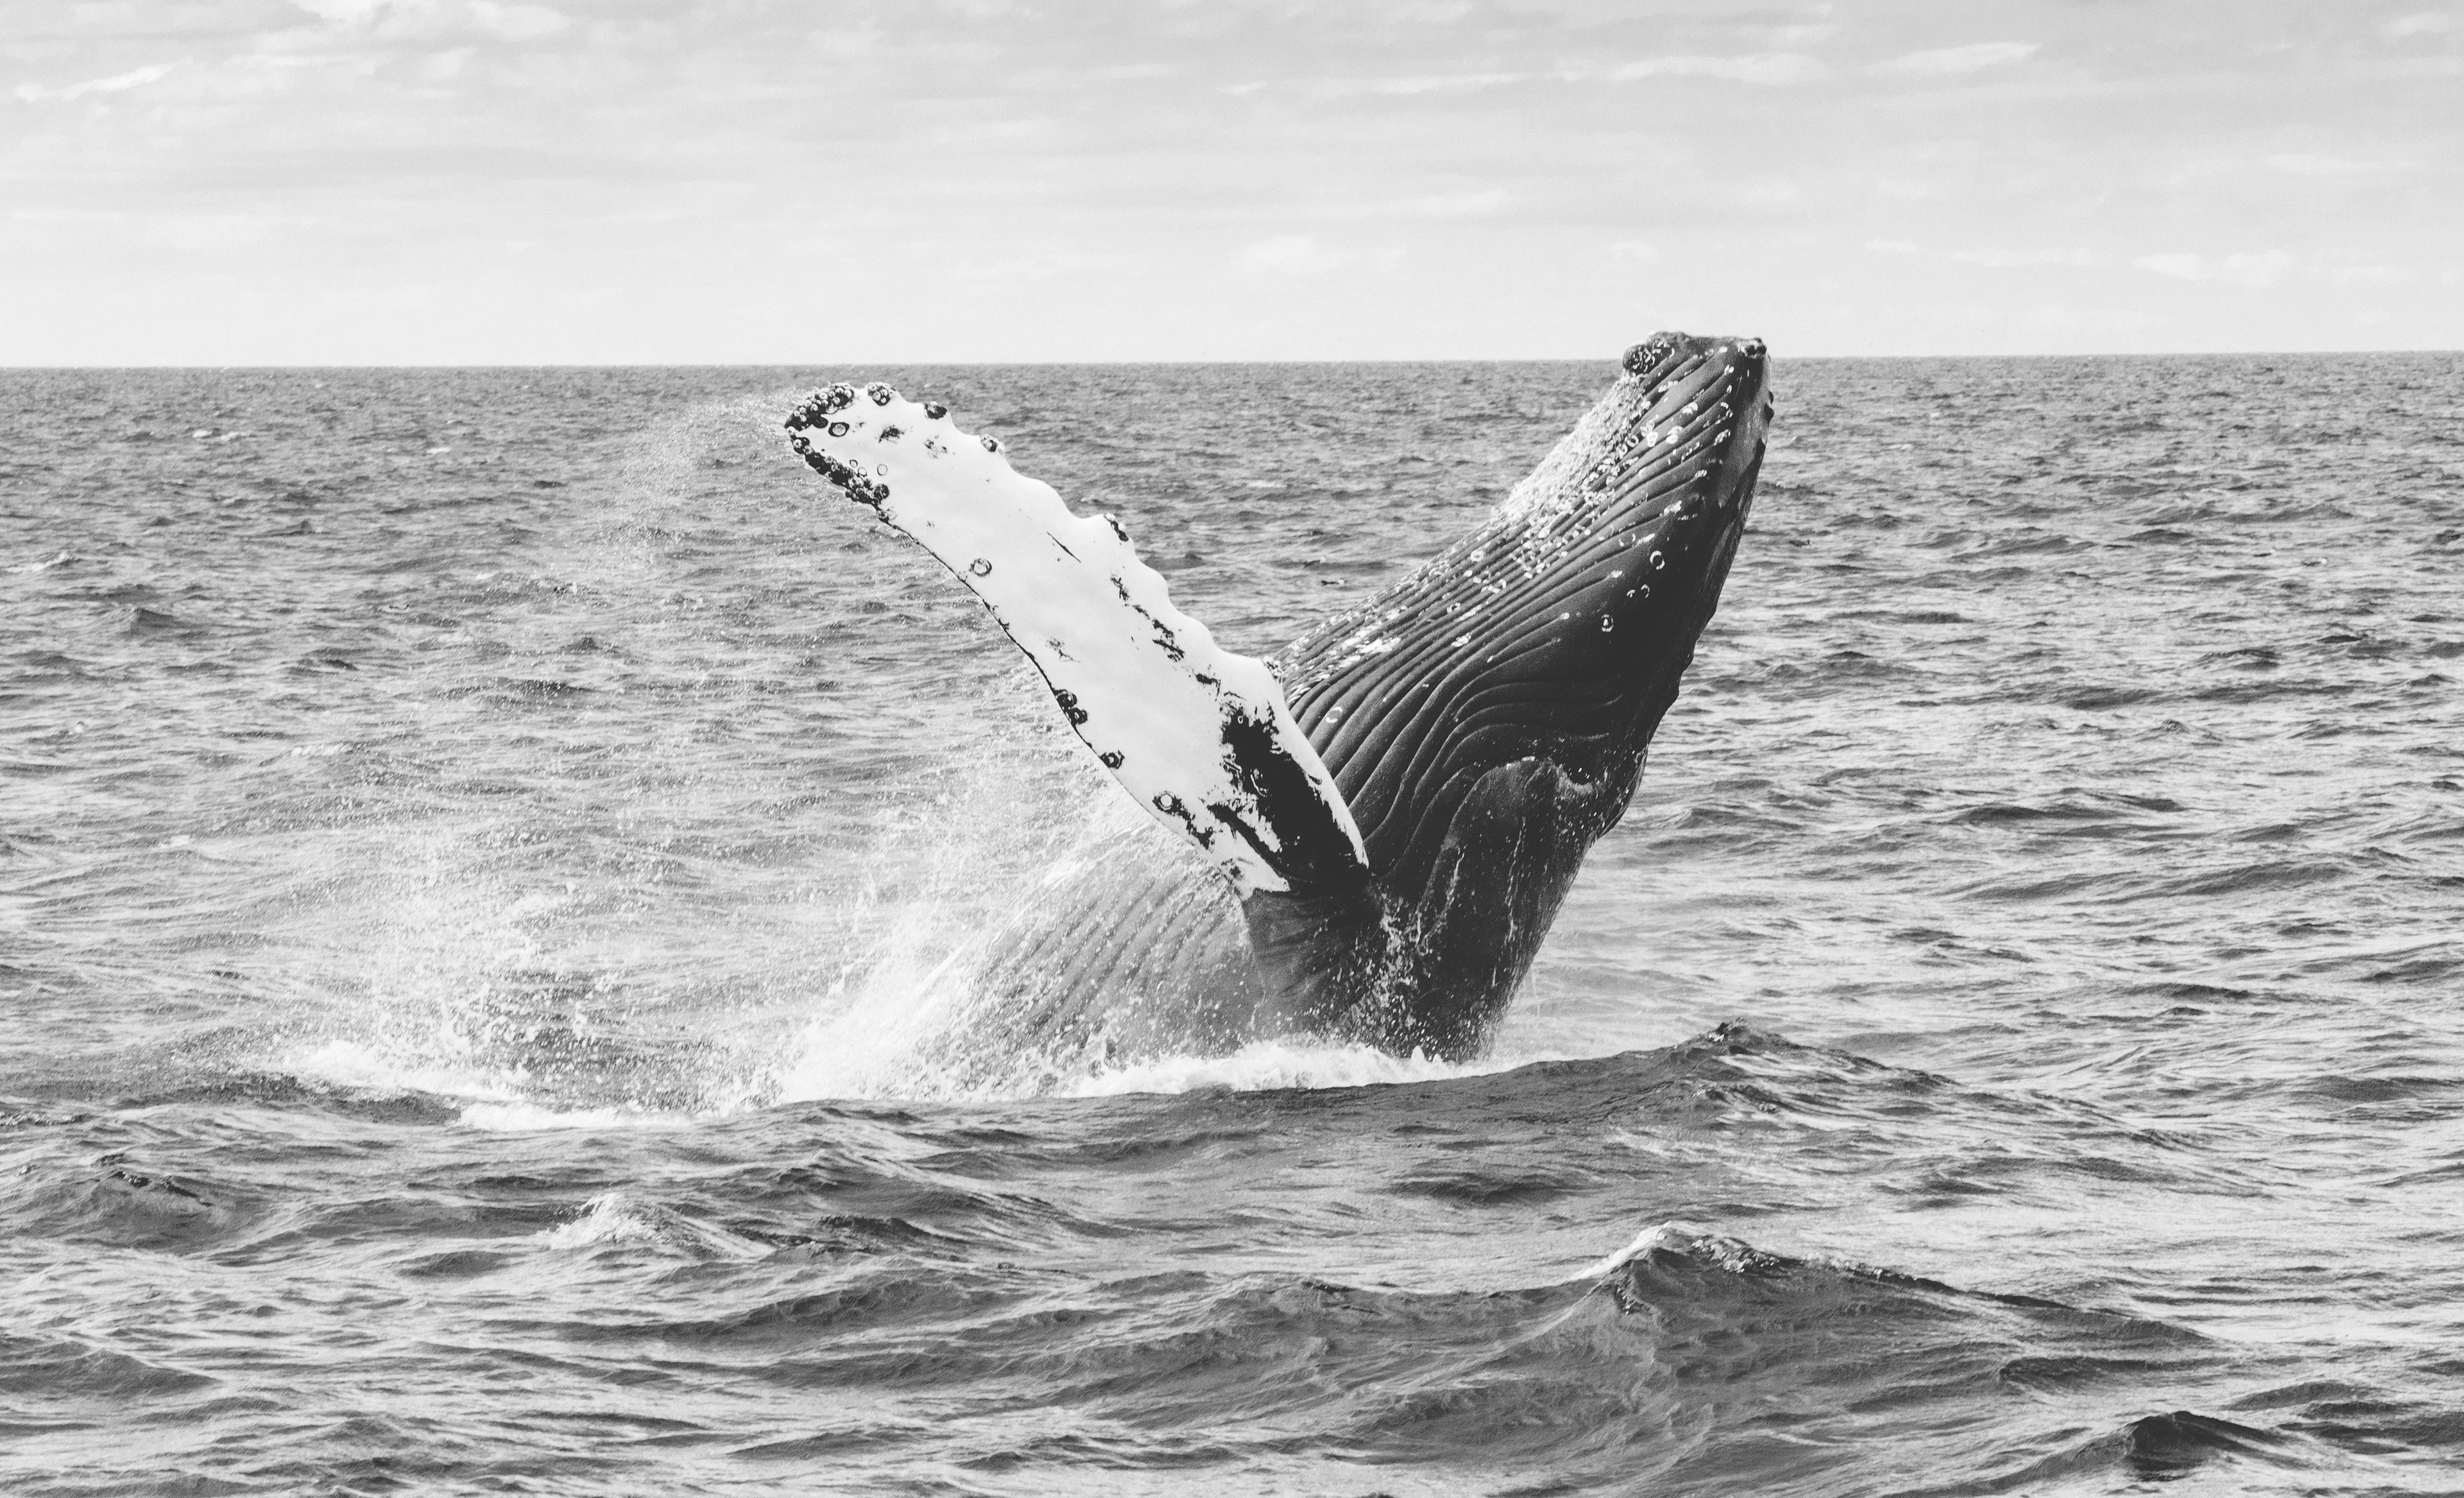
Fig. 4.1 shows a blue whale, a marine mammal that has a heart weighing up to 600 kg.

A photograph of a blue whale breaching the ocean surface.

Public domain, via rawpixel (opens in a new tab)

Fig. 4.1

In mammals, the wall of the left ventricle is approximately three times thicker than the wall of the right ventricle.

Explain why the muscle wall of the left ventricle is significantly thicker than the muscle wall of the right ventricle.